

Modeling demersal fish and benthic invertebrate assemblages in support of marine conservation planning
- PMID: 35080327
- PMCID: PMC9286868
- DOI: 10.1002/eap.2546
Modeling demersal fish and benthic invertebrate assemblages in support of marine conservation planning
Abstract
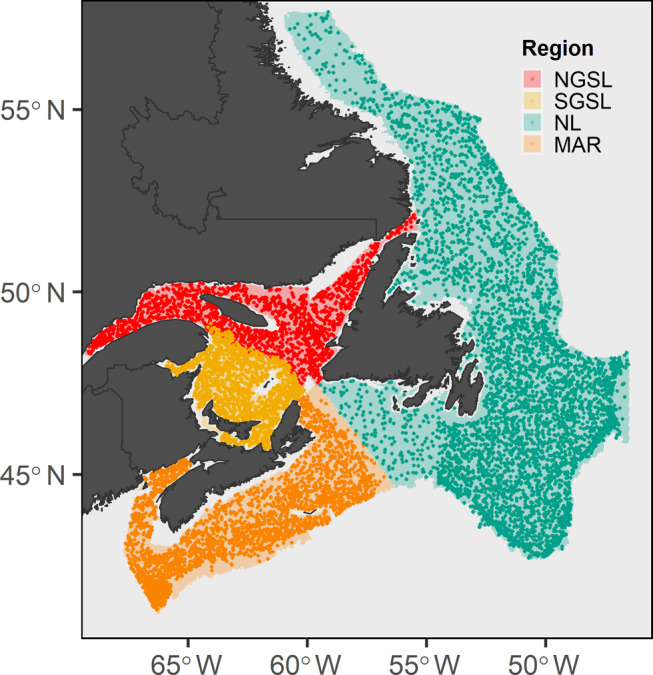
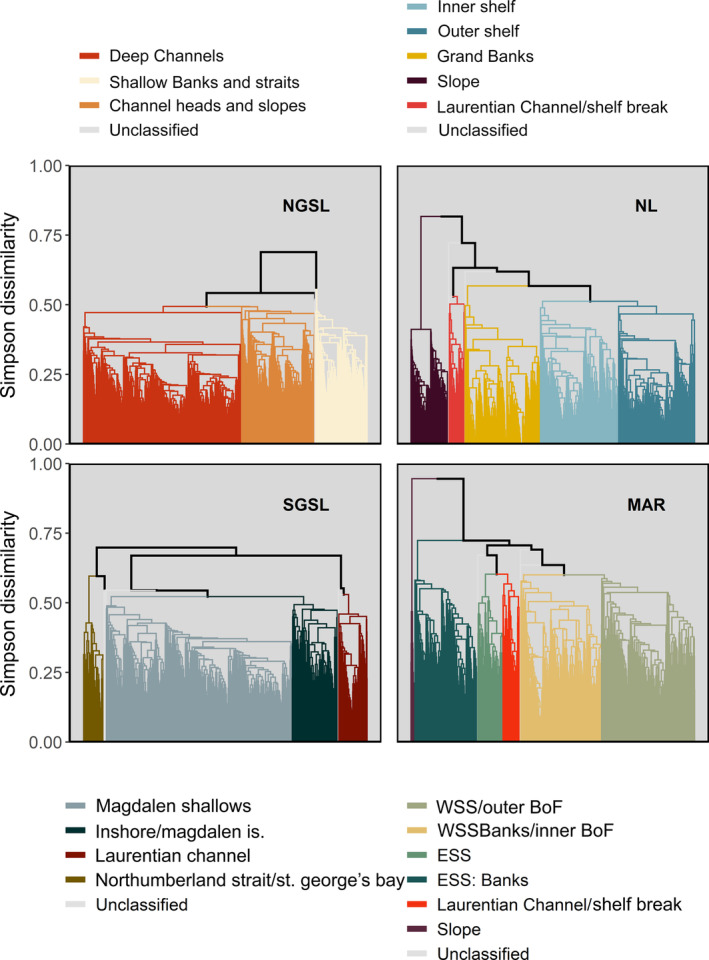
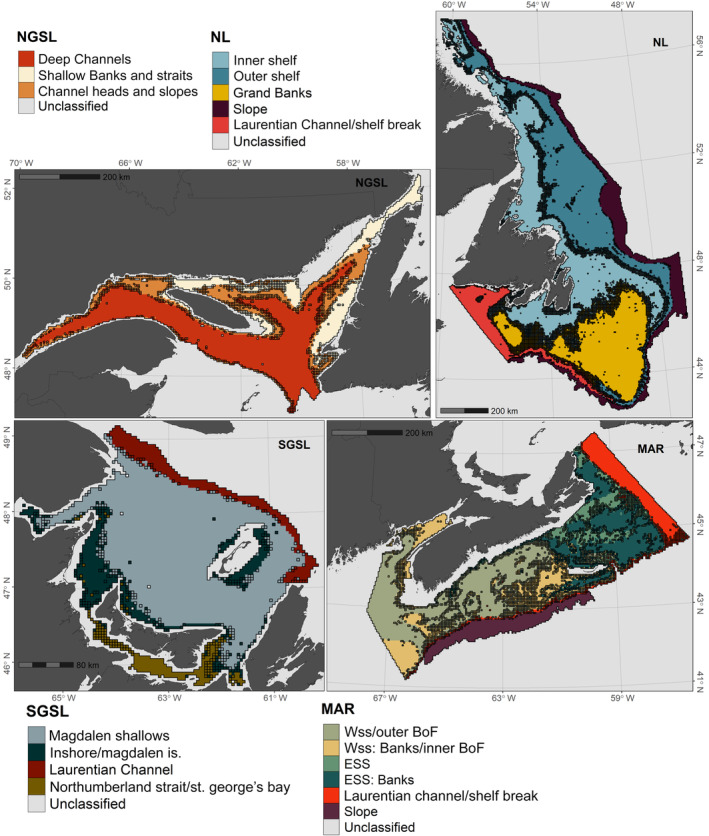
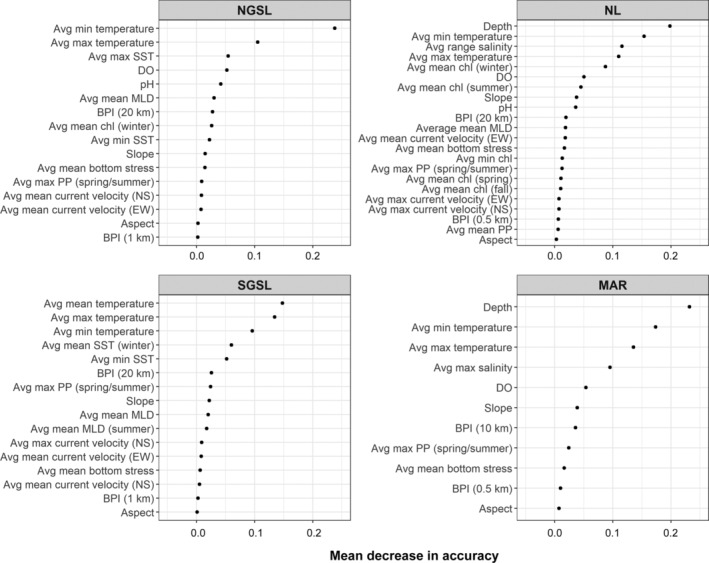
Marine classification schemes based on abiotic surrogates often inform regional marine conservation planning in lieu of detailed biological data. However, these schemes may poorly represent ecologically relevant biological patterns required for effective design and management strategies. We used a community-level modeling approach to characterize and delineate representative mesoscale (tens to thousands of kilometers) assemblages of demersal fish and benthic invertebrates in the Northwest Atlantic. Hierarchical clustering of species occurrence data from four regional annual multispecies trawl surveys revealed three to six groupings (predominant assemblage types) in each survey region, broadly associated with geomorphic and oceanographic features. Indicator analyses identified 3-34 emblematic taxa of each assemblage type. Random forest classifications accurately predicted assemblage distributions from environmental covariates (AUC > 0.95) and identified thermal limits (annual minimum and maximum bottom temperatures) as important predictors of distribution in each region. Using forecasted oceanographic conditions for the year 2075 and a regional classification model, we projected assemblage distributions in the southernmost bioregion (Scotian Shelf-Bay of Fundy) under a high emissions climate scenario (RCP 8.5). Range expansions to the northeast are projected for assemblages associated with warmer and shallower waters of the Western Scotian Shelf over the 21st century as thermal habitat on the relatively cooler Eastern Scotian Shelf becomes more favorable. Community-level modeling provides a biotic-informed approach for identifying broadscale ecological structure required for the design and management of ecologically coherent, representative, well-connected networks of Marine Protected Areas. When combined with oceanographic forecasts, this modeling approach provides a spatial tool for assessing sensitivity and resilience to climate change, which can improve conservation planning, monitoring, and adaptive management.
Keywords: climate change adaptation; community-level modeling; conservation planning; ecological coherence; ocean warming; representativity.
© 2022 Her Majesty the Queen in Right of Canada. Ecological Applications published by Wiley Periodicals LLC on behalf of The Ecological Society of America. Reproduced with the permission of the Minister of Fisheries and Oceans Canada.
Conflict of interest statement
The authors declare no conflict of interest.
Figures
Similar articles
-
Abiotic proxies for predictive mapping of nearshore benthic assemblages: implications for marine spatial planning.Ecol Appl. 2017 Mar;27(2):603-618. doi: 10.1002/eap.1469. Ecol Appl. 2017. PMID: 27862606
-
Hydroids (Cnidaria, Hydrozoa) from Mauritanian Coral Mounds.Zootaxa. 2020 Nov 16;4878(3):zootaxa.4878.3.2. doi: 10.11646/zootaxa.4878.3.2. Zootaxa. 2020. PMID: 33311142
-
The Effects of Sub-Regional Climate Velocity on the Distribution and Spatial Extent of Marine Species Assemblages.PLoS One. 2016 Feb 22;11(2):e0149220. doi: 10.1371/journal.pone.0149220. eCollection 2016. PLoS One. 2016. PMID: 26901435 Free PMC article.
-
Long-term oceanographic and ecological research in the Western English Channel.Adv Mar Biol. 2005;47:1-105. doi: 10.1016/S0065-2881(04)47001-1. Adv Mar Biol. 2005. PMID: 15596166 Review.
-
Explaining bathymetric diversity patterns in marine benthic invertebrates and demersal fishes: physiological contributions to adaptation of life at depth.Biol Rev Camb Philos Soc. 2014 May;89(2):406-26. doi: 10.1111/brv.12061. Epub 2013 Oct 4. Biol Rev Camb Philos Soc. 2014. PMID: 24118851 Free PMC article. Review.
References
-
- Airamé, S. , Dugan J. E., Lafferty K. D., Leslie H., McArdle D. A., and Warner R. R.. 2003. “Applying Ecological Criteria to Marine Reserve Design: A Case Study from the California Channel Islands.” Ecological Applications 13: 170–84.
-
- Araújo, M. B. 2002. “Biodiversity Hotspots and Zones of Ecological Transition.” Conservation Biology 16: 1662–3.
-
- Ardron, J. A. 2008. “The Challenge of Assessing whether the OSPAR Network of Marine Protected Areas Is Ecologically Coherent.” Hydrobiologia 606: 45–53.
-
- Balbar, A. C. , Daigle R. M., Heaslip S. G., Jeffery N. W., Proudfoot B., Robb C. K., Rubidge E. & Stanley R.. 2020. “Approaches for Assessing and Monitoring Representation, Replication, and Connectivity in Marine Conservation Networks.” Canadian Science Advisory Secretariat Research Document 2020/050. vii + 57 p. Ottawa, ON: Fisheries and Oceans Canada.
-
- Balbar, A. C. , and Metaxas A.. 2019. “The Current Application of Ecological Connectivity in the Design of Marine Protected Areas.” Global Ecology and Conservation 17: e00569.
Publication types
MeSH terms
LinkOut - more resources
Full Text Sources
