. 2022 Jan 28;8(4):eabj8138.
doi: 10.1126/sciadv.abj8138. Epub 2022 Jan 26.

Unexplored Antarctic meteorite collection sites revealed through machine learning

Affiliations

Unexplored Antarctic meteorite collection sites revealed through machine learning

Veronica Tollenaar et al. Sci Adv. .

Abstract

Meteorites provide a unique view into the origin and evolution of the Solar System. Antarctica is the most productive region for recovering meteorites, where these extraterrestrial rocks concentrate at meteorite stranding zones. To date, meteorite-bearing blue ice areas are mostly identified by serendipity and through costly reconnaissance missions. Here, we identify meteorite-rich areas by combining state-of-the-art datasets in a machine learning algorithm and provide continent-wide estimates of the probability to find meteorites at any given location. The resulting set of ca. 600 meteorite stranding zones, with an estimated accuracy of over 80%, reveals the existence of unexplored zones, some of which are located close to research stations. Our analyses suggest that less than 15% of all meteorites at the surface of the Antarctic ice sheet have been recovered to date. The data-driven approach will greatly facilitate the quest to collect the remaining meteorites in a coordinated and cost-effective manner.


Figures
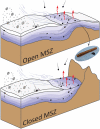
Fig. 1.
Fig. 1.. Schematic representation of two possible settings of the meteorite concentration mechanism, related to a submerged barrier (open MSZ) and to an emerged barrier (closed MSZ); not to scale.
Bedrock (both subglacial and exposed) is shown in brown. Blue colors represent the ice (the darker, the older), and white represents snow. Accumulating snow is displayed, as well as the direction of katabatic winds, which enhance the ablation. The red arrows indicate the occurrence of ablation (sublimation). Gray arrows display the flow of the ice in which meteorites are embedded. Black dots represent meteorites. The picture of a meteorite and a folding rule for scale was taken during the JARE-54 (Japanese Antarctic Research Expedition)/BELARE (Belgian Antarctic Research Expedition) 2012–2013 expedition to the Nansen blue ice field (60).
Fig. 2.
Fig. 2.. Overview of the features in the area of Elephant Moraine (76°17′S, 157°20′E).
The reprojected meteorite finding locations are shown in all panels (black dots), while the expanded BIA outlines are shown in the lower right panel. The four features framed with a black line are used for the final classification. (A) For the radar backscatter (200-m resolution), the dataset RAMP AMM-1 SAR Image Mosaic of Antarctica v2 (22) is used. No unit is indicated, as the values of the dataset represent the radar backscatter intensity in eight-bit digital numbers (22). (B) For the 99th percentile of the surface temperature (1000-m resolution), preprocessed observations of MODIS, from 1 January 2001 to 1 January 2020, are used (MOD11A2 MODIS/Terra Land Surface Temperature Daytime, 8-Day Global, V006) (29). (C) The surface slope over 2.2 km is calculated using the Reference Elevation Model of Antarctica (33) at 200-m resolution, and a dataset of rock outcrops (Rock Outcrop medium resolution v7.1) (34, 40). (D) For the surface velocity (450-m resolution), MEaSUREs Phase-Based Antarctica Ice Velocity Map v1 (21) is used. (E) For the ice thickness (500-m resolution), MEaSUREs BedMachine Antarctica v2 (36) is used. (F) For the distance to outcrops, the dataset of rock outcrops (34, 40) is used. (G) The background image in the lower right overview is taken from the Center-Filled Landsat Image Mosaic of Antarctica (LIMA) Project (61).
Fig. 3.
Fig. 3.. Exhaustive feature selection.
(A) The (average) AUC is calculated for all 63 combinations of the six features. Two sets of calibration data are used, one with actual negative data (based on which the results are arranged; dark blue) and the other with a random selection of the unlabeled data (light blue). One SD of the AUCs (obtained in the cross-validation) is shown as error bar. (B) Improvement of the classifier when including a given feature. The mean AUC of the 32 combinations with a certain feature is divided by the mean AUC of the 31 combinations without a certain feature. (C) Three ROC curves (obtained with negative data) illustrating the relation between the false-positive rate and the true-positive rate. These rates are estimated by applying the classifier to calibration data and comparing the predicted class (positive or negative) to the actual class. By varying parameters of the classifier (see Materials and Methods), different true-positive and false-positive rates are obtained. To compare ROC curves, the area under the curve (AUC) is used. In this example, the AUC when using the four selected features (radar backscatter, surface temperature, surface slope, and surface velocity; solid line) is larger than the AUC with a different combination of features (radar backscatter, surface velocity, ice thickness, distance to outcrops; blue dashed line). When solely relying on the surface slope (red dashed line), the classification approximates a random classification, as the classifier is not able to distinguish positive from negative observations.
Fig. 4.
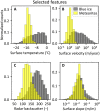
Fig. 4.. Histograms of the four selected features.
(A) Surface temperature (99th percentile), (B) surface velocity, (C) radar backscatter, and (D) surface slope (averaged over 2.2 km). Values for the ca. 2.1 million unlabeled observations at the expanded BIAs are in gray (“blue ice”) and the 2554 positive observations are in yellow (“meteorites”). Histograms of other features are provided in the Supplementary Materials (fig. S4). For references and details about the datasets used, refer to the caption of Fig. 2.
Fig. 5.
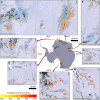
Fig. 5.. Antarctic meteorite hotspot map with positive classified observations.
In the central overview map, the size of the positive classified observations is exaggerated for visual contrast, while in the submaps (A to G), the positive classified observations are shown to scale. The expanded BIAs over which the classification is performed are delineated in black. The “probability to find meteorites” at a given location corresponds to the a posteriori probability (see Eq. 4.1 in Materials and Methods).
Fig. 6.
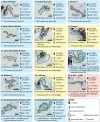
Fig. 6.. MSZs with a high potential.
MSZs larger than 10 km2 with a high expected feasibility and success of a field visit. The panel titles give the name of each MSZ and its ranking based on the where-to-go index (“1” being the highest). The panel colors and remarks indicate whether the MSZ has been successfully visited (meteorites predicted and found in the field, blue), unexplored (containing meteorites but not visited yet, yellow), or unsuccessfully visited (meteorites predicted but not found in the field, red). Background images are false-color, pan-sharpened images of the LIMA project (61). The maximum temperature (99th percentile) and the ice flow velocity represent the median value of the observations within the MSZ (see Materials and Methods). “Snow-free days” represents the number of days per field season (szn) (November to February) that at least 50% of the MSZ (or for MSZs larger than 20 km2, at least 10 km2) is snow-free (see Materials and Methods).
Fig. 7.
Fig. 7.. Positive observations for the nine most productive field sites and results of the cross-validation based on the four selected features (surface temperature, surface velocity, radar backscatter, and surface slope).
The Antarctic map shows the location of the field sites. The submaps [(A to G), all on the same scale] display the positive observations as black dots, with the number of meteorite finds indicated with “mets,” and the resulting number of reprojected positive observations indicated with “obs.” The corresponding ROC curves (FP = false positive; TP = true positive), obtained with the actual negative observations (Fig. 3), indicate the performance of each individual field site (colored) compared to the weighted average ROC curve (black). The weighted average ROC curve is obtained by averaging the individual field sites, where the number of meteorite finds (mets) is used as a weight.

References

    1. Gounelle M., Gounelle M., Meteorites: International law and regulations. Meteorit. Planet. Sci. 54, 2887–2901 (2019).
    1. Bintanja R., On the glaciological, meteorological, and climatological significance of Antarctic blue ice areas. Rev. Geophys. 37, 337–359 (1999).
    1. Hui F., Ci T., Cheng X., Scambos T. A., Liu Y., Zhang Y., Chi Z., Huang H., Wang X., Wang F., Zhao C., Jin Z., Wang K., Mapping blue-ice areas in Antarctica using ETM+ and MODIS data. Ann. Glaciol. 55, 129–137 (2014).
    1. Cassidy W., Harvey R., Schutt J., Delisle G., Yanai K., The meteorite collection sites of Antarctica. Meteoritics 27, 490–525 (1992).
    1. Sinisalo A., Moore J. C., Antarctic blue ice areas—Towards extracting palaeoclimate information. Antarct. Sci. 22, 99–115 (2010).