. 2022 Jan 26;18(1):e1010025.
doi: 10.1371/journal.pgen.1010025. eCollection 2022 Jan.

Proline-specific aminopeptidase P prevents replication-associated genome instability

Affiliations

Proline-specific aminopeptidase P prevents replication-associated genome instability

Nicola Silva et al. PLoS Genet. .

Abstract

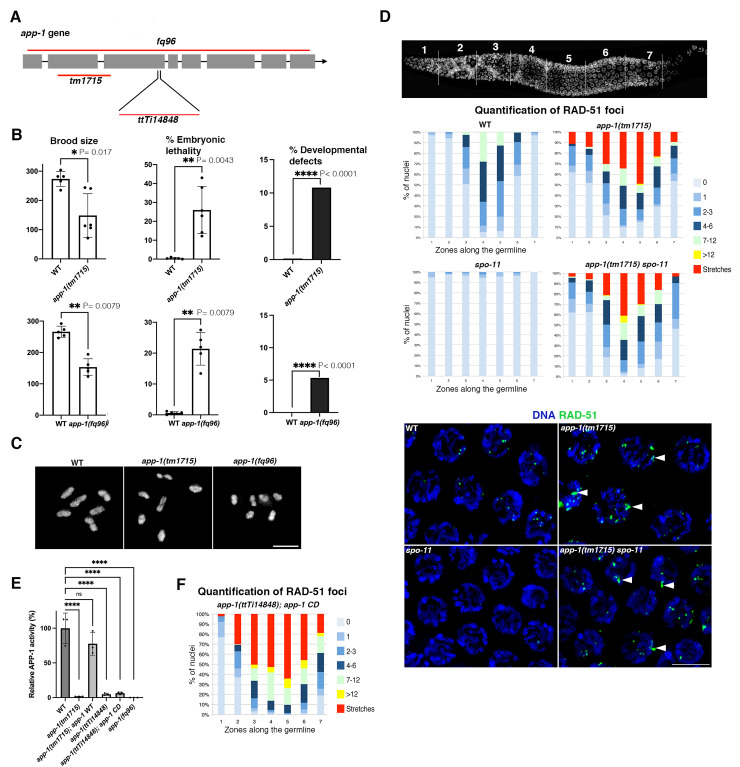
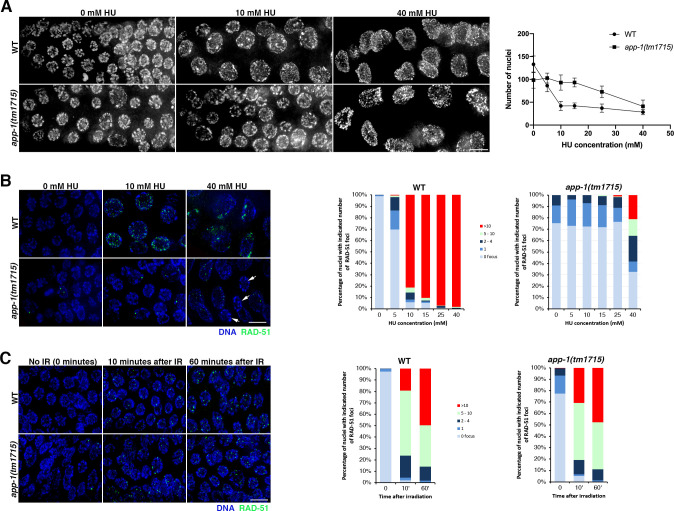
Genotoxic stress during DNA replication constitutes a serious threat to genome integrity and causes human diseases. Defects at different steps of DNA metabolism are known to induce replication stress, but the contribution of other aspects of cellular metabolism is less understood. We show that aminopeptidase P (APP1), a metalloprotease involved in the catabolism of peptides containing proline residues near their N-terminus, prevents replication-associated genome instability. Functional analysis of C. elegans mutants lacking APP-1 demonstrates that germ cells display replication defects including reduced proliferation, cell cycle arrest, and accumulation of mitotic DSBs. Despite these defects, app-1 mutants are competent in repairing DSBs induced by gamma irradiation, as well as SPO-11-dependent DSBs that initiate meiotic recombination. Moreover, in the absence of SPO-11, spontaneous DSBs arising in app-1 mutants are repaired as inter-homologue crossover events during meiosis, confirming that APP-1 is not required for homologous recombination. Thus, APP-1 prevents replication stress without having an apparent role in DSB repair. Depletion of APP1 (XPNPEP1) also causes DSB accumulation in mitotically-proliferating human cells, suggesting that APP1's role in genome stability is evolutionarily conserved. Our findings uncover an unexpected role for APP1 in genome stability, suggesting functional connections between aminopeptidase-mediated protein catabolism and DNA replication.


Conflict of interest statement

The authors have declared that no competing interests exist.

Figures

Fig 1
Fig 1. Loss of APP-1 causes lethality and accumulation of SPO-11-independent DSBs.
(A) Schematic representation of the app-1 locus indicating the regions deleted by the tm1715 and fq96 deletion alleles, and the site of insertion in the ttTi14848 allele. (B) Brood size, embryonic lethality, and developmental defects observed among the progeny of homozygous app-1(tm1715) and app-1(fq96) mutants. Total numbers of embryos scored: 1369 (WT control top row graphs), 891 (app-1(tm1715)), 1330 (WT control bottom row graphs), and 767 (app-1(fq96)). In graphs for brood size and embryonic lethality circles indicate values from progeny of individual worms, bar indicates mean, error bars show standard deviation, and statistical analysis was calculated using two-tailed nonparametric Mann-Whitney test. % of developmental defects were measured by counting worms with abnormal morphology among the total hatched embryos from each genotype and statistical analysis was calculated using two-sided Chi square test. (C) Diakinesis oocytes demonstrating normal chiasma formation in app-1 mutants. (D) Graphs display the regions along the germ line (X axis) as indicated in the DAPI-stained germ line and the percentage of nuclei with a given number of RAD-51 foci (Y axis) as indicated in the color key. RAD-51 foci accumulate in all germline regions of app-1(tm1715) and app-1(tm1715); spo-11 mutants. Number of nuclei analysed per genotype and zone: WT (143, 265, 140, 156, 127, 114, 96), app-1(tm1715) (97, 106, 99, 110, 149, 95, 84), spo-11 (119, 195,118, 127, 118, 84, 70), app-1(tm1715); spo-11 (158, 173, 165, 107, 147, 124, 95). (E) Enzymatic assay monitoring proteolytic degradation of the APP-1 substrate Lys(εDNP)-Pro-Pro-Amp by soluble protein extracts prepared from an equal weight of wild-type (WT) controls and different app-1 mutants. APP activity is presented relative to the activity of WT N2, bars indicate mean of three measurements, circles show individual measurements, and errors bars indicate standard deviation. One-way ANOVA test shows that all app-1 mutants are significantly different from WT controls (**** P<0.0001), while expression of the transgene encoding wild-type APP-1 [app-1WT] rescues the catalytic activity in app-1(tm1715) mutants (P = 0.21 WT vs app-1(tm1715) app-1 WT). No increase in fluorescence was observed with enzyme from app-1(fq96). (F) Quantification of RAD-51 foci in worms homozygous for the app-1(ttTi14848) allele and for a transgene expressing a catalytically dead version of APP-1 (carrying the H392A and H496A mutations), note high accumulation of RAD-51 similar to app-1(tm1715) and app-1(fq96) mutants (see panel D and S1D Fig). Number of nuclei analysed per zone: 130, 159, 161, 110, 126, 74, 90. Scale bar = 5 μm in all panels. See S1 Table for underlaying numerical data of graphs.
Fig 2
Fig 2. app-1 mutant germ lines display DNA replication defects.
All images show projections of the mitotic compartment of the germ line containing mitotically-proliferating germ cells. (A) DAPI staining reveals the presence of enlarged nuclei (arrow heads) and an overall reduction in the number of nuclei in app-1 mutants. (B) Graphs show quantification of the number of mitotic nuclei, 10 germ lines were scored per genotype and the total number of nuclei analysed was: 1296 (WT for app-1(tm1715)), 918 (app-1(tm1715)), 1490 (WT for app-1(fq96)), 860 (app-1(fq96)). (C) Germ lines dissected, fixed, and stained after 14 hours of feeding on EdU labelled bacteria, note the presence of unlabelled nuclei (arrowheads) in app-1 mutants. Graph shows quantification of the % of unlabelled nuclei in 5 germ lines per genotype and the total number of nuclei analysed per genotype was: 346 (WT) and 287 (app-1(tm1715)). (D) Germ lines dissected, fixed, and stained 3 hours after Rho dUTP was injected into the germ line, note increased presence of unlabelled nuclei in app-1 mutants. Graph shows quantification of the % of unlabelled nuclei in 7 germ lines per genotype and the total number of nuclei analysed per genotype was: 681 (WT) and 571 (app-1(tm1715)). In all graphs dots correspond to values of individual germ lines, columns indicate mean value, error bars show standard deviation, and statistical significance was calculated by unpaired t test (**** indicates P value < 0.0001 and *** indicates P value <0.001). Scale bar = 5 μm in all panels. See S1 Table for underlaying numerical data of graphs.
Fig 3
Fig 3. Effect of exogenous genotoxic stress on app-1 mutants.
All images show projections of the mitotic compartment of the germ line containing mitotically-proliferating germ cells. (A) DAPI staining of dissected germ lines following exposure to the indicated doses of HU for 16 hours. Note that appearance of enlarged nuclei and overall reduction in the number of nuclei requires higher doses of HU in app-1 mutants. In the graph, individual data points represent the mean and error bars standard deviation, the number of nuclei and germ lines (in brackets) analysed per condition (0 mM HU, 5 mM HU, 10 mM HU, 15 mM HU, 25 mM HU, and 40 mM HU) were: WT: 1330 (10), 863 (10), 419 (10), 420 (10), 370 (10), and 227 (8); app-1(tm1715): 984 (10), 1029 (10), 930 (10), 933 (10), 727 (10), and 410 (10). (B) RAD-51 loading following exposure to the indicated doses of HU for 16 hours, note that significant accumulation of RAD-51 foci in app-1 mutants is only observed with 40 mM HU. Arrows in the app-1 panel treated with 40 mM HU point to nuclei displaying no RAD-51 foci. Graphs show quantification of RAD-51 foci in mitotically-proliferating germ cells, the number of nuclei and germ lines (in brackets) analysed per condition (0 mM HU, 5 mM HU, 10 mM HU, 15 mM HU, 25 mM HU, 40 mM HU were: WT: 605 (5), 355 (5), 238 (5), 219 (5), 193 (5), and 216 (6); app-1(tm1715): 359 (5), 356 (5), 364 (5), 423 (5), 350 (6), and 237 (6). (C) RAD-51 loading before (time 0), 10 minutes and 60 minutes after exposure to 10 Gy of γ irradiation, note similar levels of RAD-51 foci in WT and app-1 mutant germ lines. 5–6 germ lines were quantified per genotype and condition. Total number of nuclei: 638 (WT at 0), 645 (WT at 10’), 535 (WT at 60’), 488 (app-1 at 0). 473 (app-1 at 10’), and 400 (app-1 at 60’). Scale bar = 5 μm in all panels. See S1 Table for underlaying numerical data of graphs.
Fig 4
Fig 4. poly(ADP-ribosyl)ation contributes to DNA repair in app-1 mutants.
(A-B) Removal of PARP-1 and PARP-2 from app-1(tm1715) mutants increases embryonic lethality and the incidence of developmental defects amongst viable progeny. Number of embryos scored per genotype: 1275 (WT), 941 (app-1), 2361 (parp-1), 3449 (parp-1, app-1), 5040 (parp-2), 1872 (app-1; parp-2), 2209 (parp-1; parp-2), and 1401 (parp-1, app-1; parp-2). In (A) dots indicate % of embryonic lethality among the progeny of individual worms, bars indicate mean value of % embryonic lethality from all scored worms, and error bars indicate standard deviation. Statistics were calculated using a one-way ANOVA test, P values = 0.998 (app-1 vs parp-1, app1 and app-1 vs app-1; parp-2); <0.0001 (app-1 vs parp-1, app-1; parp-2). In (B) % of developmental defects were measured by counting worms with abnormal morphology among the total hatched embryos from each genotype, statistical analysis was performed using two-sided Chi square test (**** indicates P value < 0.0001 and ** indicates P = 0.002). (C) Quantification of RAD-51 foci in germ lines of indicated genotypes, graphs display the regions along the germ line (X axis) and the percentage of nuclei with a given number of RAD-51 foci (Y axis) as indicated in color key. Note that removing PARP-1 and PARP-2 reduces the accumulation of RAD-51 aggregates in germ lines of app-1(tm1715) mutants, but RAD-51 foci still accumulate to high levels in germ lines of app-1; parp-1 and app-1; parp-2 double mutants. The number of nuclei analysed per genotype and zone were: parp-1, app-1(tm1715) (152, 161, 119, 154, 175, 94, 103), app-1; parp-2 (155, 168, 102, 129, 112, 94, 137), parp-1; parp-2 (287, 265, 237, 184, 181, 194, 169), and parp-1, app-1(tm1715); parp-2 (195, 183, 167, 181, 209, 152, 190). See S1 Table for underlaying numerical data of graphs.
Fig 5
Fig 5. MRE-11 and COM-1 promote RAD-51 accumulation in app-1 mutant germ lines.
Quantification of RAD-51 foci in germ lines of indicated genotypes, graphs display the regions along the germ line (X axis) and the percentage of nuclei with a given number of RAD-51 foci (Y axis) as indicated in color key. Note that removing MRE-11 or COM-1 from app-1 mutants causes a reduction in the number of RAD-51 observed in meiotic nuclei compared to app-1 single and app-1; spo-11 double mutants (see Fig 1D). Number of nuclei analysed per genotype and zone: mre-11 (211, 178, 245, 226, 241, 175, 98), app-1(tm1715); mre-11 (101, 199, 193, 170, 171, 146, 103), com-1 (125, 150, 183, 177, 122, 126, 63), and app-1(tm1715); com-1 (167, 177, 121, 125, 153, 150, 95). See S1 Table for underlaying numerical data of graphs.
Fig 6
Fig 6. The crossover pathway repairs DSBs in app-1 mutants.
(A) Quantification of the number of DAPI-stained bodies in diakinesis oocytes of indicated genotypes. Columns indicate mean value and error bars show standard deviation. Statistical significance was calculated by two tailed Mann Whitney U test (**** indicates P value < 0.0001 and * indicates P value = 0.01420). Number of oocytes analysed: WT (25), app-1(fq96) (25), app-1(tm1715) (61), spo-11 (23), app-1(fq96) spo-11 (27), app-1(tm1715) spo-11 (85), syp-2 (43), app-1(tm1715) syp-2 (60), msh-5 (53), app-1 (tm1715) msh-5 (58). Images show projections of diakinesis oocytes of indicated genotype stained with DAPI. (B) Quantification of MSH-5 and COSA-1 foci in germ lines of indicated genotypes. Graphs show zones along the germ line from transition zone (1) to late pachytene (5) on the X axis and the number of foci per nucleus on the Y axis. Columns indicate mean value and error bars show standard deviation. Statistical significance between numbers of MSH-5 and COSA-1 foci between spo-11 and app-1 spo-11 were calculated by a two tailed Mann Whitney U test (**** indicates P value < 0.0001). The number of nuclei analysed per genotype and zone were: WT (236, 230, 186, 101, 70), app-1(tm1715) (214, 202, 177, 121, 93), spo-11 (244, 243, 208, 137, 118), and app-1(tm1715) spo-11 (310, 218, 198, 156, 122). Images show projections of late pachytene nuclei stained with anti-GFP (MSH-5), anti-OLLAS (COSA-1), and DAPI. Note that COSA-1 and MSH-5 foci are largely absent in spo-11 mutants, but present in app-1 spo-11 double mutants. Scale bar = 5 μm in all panels. See S1 Table for underlaying numerical data of graphs.
Fig 7
Fig 7. Knockdown of human XPNPEP1 causes accumulation of DNA damage.
(A) Western blot analysis on total protein extracts showing efficient knock down of XPNPEP1 by two independent siRNAs that also induce accumulation of Topoisomerase IIα. (Β) Pulse field gel stained with ethidium bromide in control cells and following knock down of XPNPEP1. Note increased intensity of band labelled as “a” and the smear label as “b” corresponding to fragmented DNA. Graphs show quantification of the relative intensity of band “a” and smear “b”. (C) XPNPEP1 knockdown causes an increase in the % of cells positive for γH2AX. Dots show % of cells with >5 γH2AX foci from three experiments, bars show mean of the three experiments, and error bars represent standard deviations. Statistical significance was calculated by a one-way ANOVA test, note that differences between siRNA control and the two siRNAs targeting XPNPEP1 are significant (* indicates P value = 0.048 and ** indicates P value = 0.0082). (D) Western blot analysis on fractionated protein extracts from U2OS cells treated with control siRNA and two independent XPNPEP1 siRNAs showing that Topoisomerase II accumulates on the DNA-bound fraction following XPNPEP1 knockdown.

References

    1. Tubbs A, Nussenzweig A. Endogenous DNA Damage as a Source of Genomic Instability in Cancer. Cell. 2017;168(4):644–56. doi: 10.1016/j.cell.2017.01.002 . - DOI - PMC - PubMed
    1. Mehta A, Haber JE. Sources of DNA double-strand breaks and models of recombinational DNA repair. Cold Spring Harb Perspect Biol. 2014;6(9):a016428. Epub 2014/08/12. doi: 10.1101/cshperspect.a016428 ; PubMed Central PMCID: PMC4142968. - DOI - PMC - PubMed
    1. Aguilera A, Garcia-Muse T. Causes of genome instability. Annu Rev Genet. 2013;47:1–32. doi: 10.1146/annurev-genet-111212-133232 . - DOI - PubMed
    1. Bellelli R, Boulton SJ. Spotlight on the Replisome: Aetiology of DNA Replication-Associated Genetic Diseases. Trends Genet. 2021;37(4):317–36. Epub 2020/10/13. doi: 10.1016/j.tig.2020.09.008 . - DOI - PubMed
    1. Hunter N. Meiotic Recombination: The Essence of Heredity. Cold Spring Harb Perspect Biol. 2015;7(12). doi: 10.1101/cshperspect.a016618 . - DOI - PMC - PubMed

Publication types