. 2022 Feb 17;82(4):816-832.e12.
doi: 10.1016/j.molcel.2021.12.037. Epub 2022 Jan 25.

SETDB1/NSD-dependent H3K9me3/H3K36me3 dual heterochromatin maintains gene expression profiles by bookmarking poised enhancers

Affiliations

SETDB1/NSD-dependent H3K9me3/H3K36me3 dual heterochromatin maintains gene expression profiles by bookmarking poised enhancers

Amandine Barral et al. Mol Cell. .

Abstract

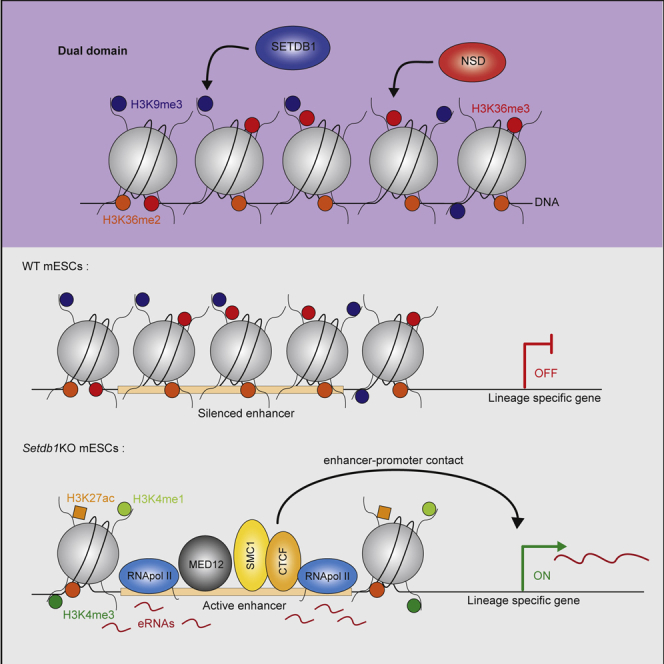
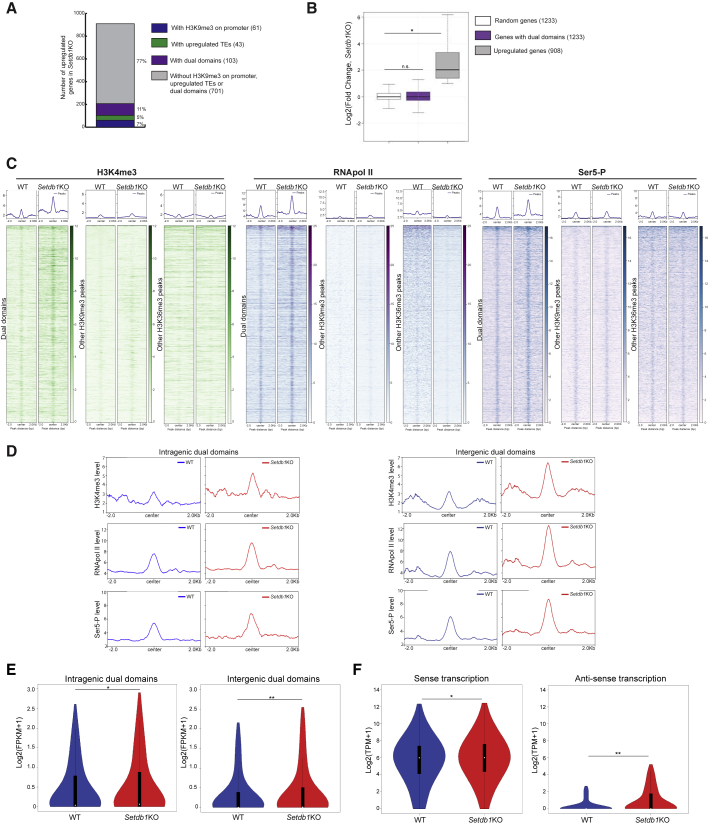
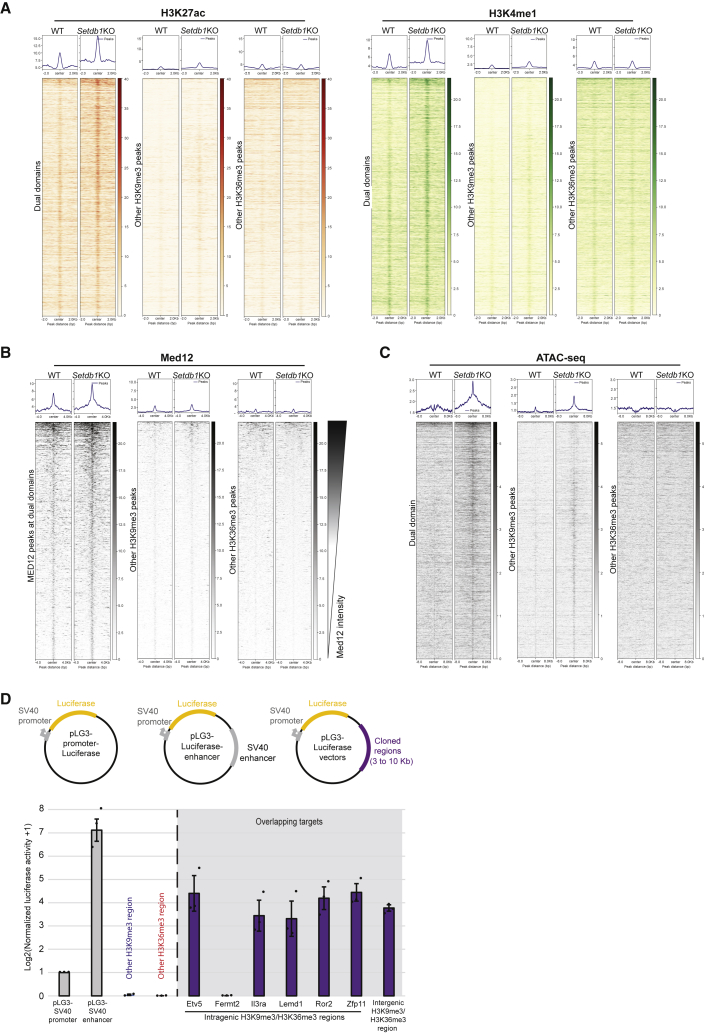
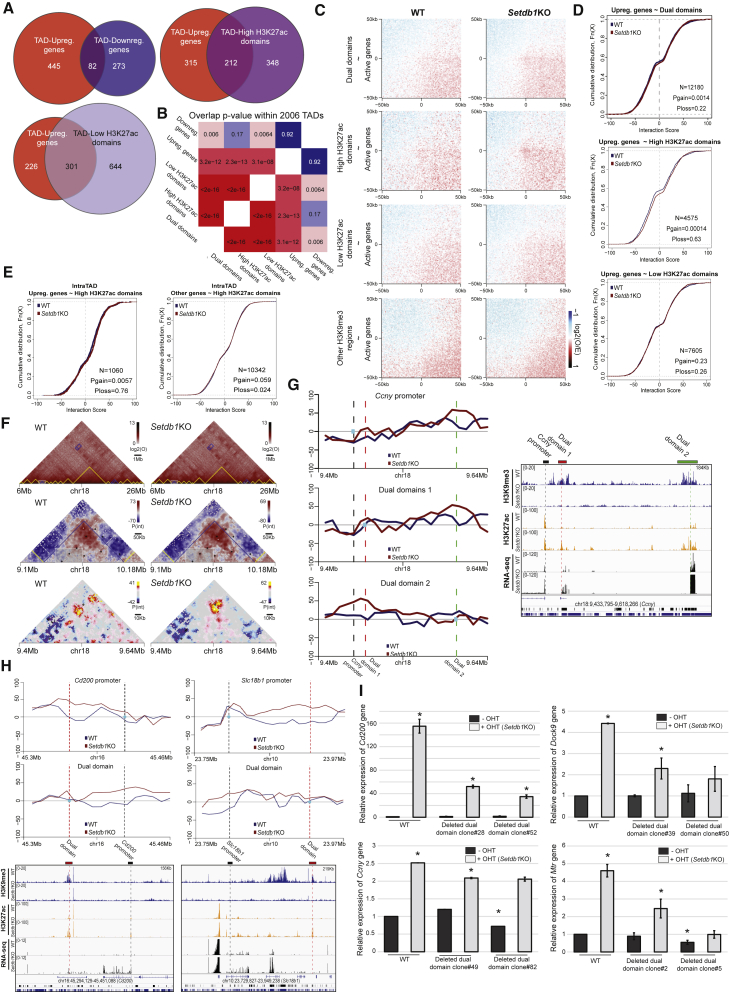
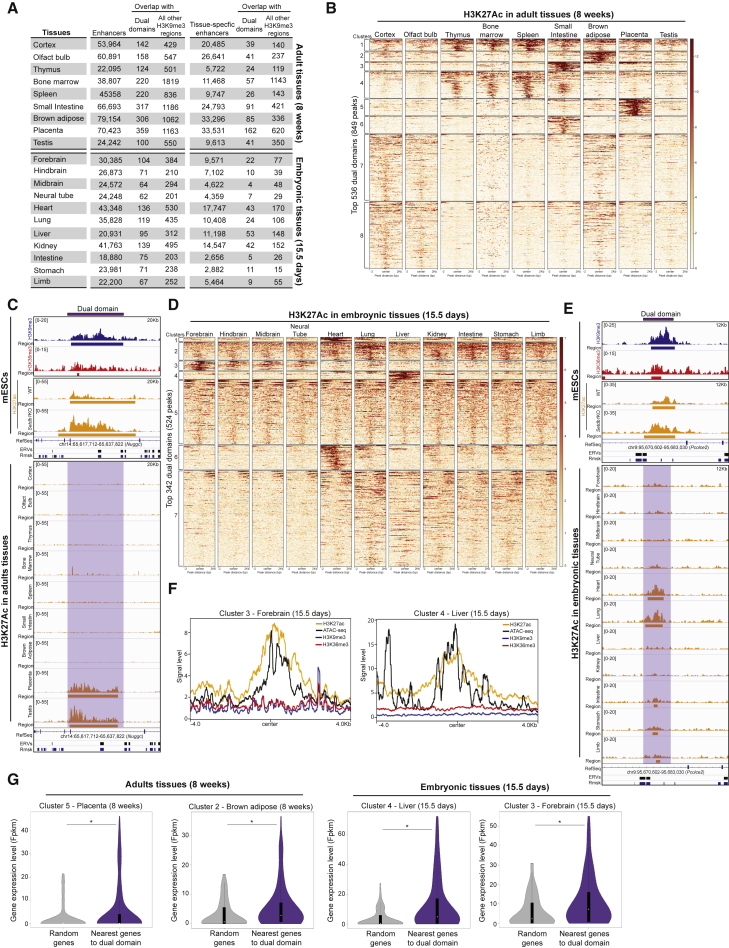
Gene silencing by heterochromatin plays a crucial role in cell identity. Here, we characterize the localization, the biogenesis, and the function of an atypical heterochromatin, which is simultaneously enriched in the typical H3K9me3 mark and in H3K36me3, a histone mark usually associated with gene expression. We identified thousands of dual regions in mouse embryonic stem (ES) cells that rely on the histone methyltransferases SET domain bifurcated 1 (SETDB1) and nuclear set domain (NSD)-containing proteins to generate H3K9me3 and H3K36me3, respectively. Upon SETDB1 removal, dual domains lose both marks, gain signatures of active enhancers, and come into contact with upregulated genes, suggesting that it might be an important pathway by which genes are controlled by heterochromatin. In differentiated tissues, a subset of these dual domains is destabilized and becomes enriched in active enhancer marks, providing a mechanistic insight into the involvement of heterochromatin in the maintenance of cell identity.

Keywords: cellular identity; enhancer; gene expression; heterochromatin.


Conflict of interest statement

Declaration of interests The authors declare no competing interests.

Figures

None
Graphical abstract
Figure 1
Figure 1
H3K9me3 and H3K36me3 colocalize at thousands of sites in mouse ES cells (A) Left: H3K9me3 distribution and tracks for intergenic and intragenic regions (blue). Right: H3K36me3 distribution and tracks for intergenic and intragenic regions (red). Reference sequence (RefSeq) track with annotated genes from mm10 genome. Endogenous retrovirus (ERV) track contains all annotated LTR transposable elements. Rmsk, RepeatMasker, track contains all annotated DNA repeat sequences. (B) Venn diagram showing the overlap between H3K9me3 and H3K36me3. (C) Genome-wide distribution of H3K9me3/H3K36me3 colocalized domains and genome browser tracks of H3K9me3 and H3K36me3. Purple bars show H3K9me3/H3K36me3 domains based on peak calling. (D) H3K9me3 and H3K36me3 distributions on H3K9me3/H3K36me3 regions, ranked by H3K9me3 enrichment. (E) Distribution of H3K9me3/H3K36me3 regions according to percentage of overlap between H3K9me3 domains and H3K36me3 domains allowing to categorize “colocalized” and “embedded” domains (STAR Methods for details). Right: tracks of H3K9me3 and H3K36me3 at “colocalized” H3K9me3/H3K36me3 regions (top) and “embedded” H3K9me3/H3K36me3 regions (bottom). (F) Enrichment of H3K9me3 (blue), H3K36me3 (red), and CIDOP (purple) chromatin on H3K9me3/H3K36me3 regions or on other H3K9- or H3K36me3 regions. (G) Tracks of H3K9me3, H3K36me3, and CIDOP on “colocalized” H3K9me3/H3K36me3 regions (left) and “embedded” H3K9me3/H3K36me3 regions (right). (H) ChIP-reChIP for H3K9me3 (blue) and H3K36me3 (red) fold-enrichment after input normalization in positive dual regions (In.), or in flanking regions (Flk.), intracisternal A particle (IAPs, used as a H3K9me3 control) or Bzw1 transcribed gene body (used as H3K36me3 control) in WT cells (, Student’s t test p value < 0.05). Also see Figure S1 and Table S1.
Figure 2
Figure 2
Both H3K9me3 and H3K36me3 depend on SETDB1 (A) SETDB1, H3K9me3, SETD2, H3K36me3, and PCNA immunoblots performed on nuclear extracts from WT, Setdb1 KO, Setd2 KO, and double KO cells. (B) Enrichment of H3K9me3 and H3K36me3 on H3K9me3/H3K36me3 regions and on other H3K9me3 or H3K36me3 regions in WT and Setdb1 KO cells (Wilcoxson signed rank test: p value = 2.2 × 10⁻¹⁶; 2.2 × 10⁻¹⁶; and 2.2 × 10⁻¹⁶, respectively). (C) Tracks of H3K9me3 and H3K36me3 on H3K9me3/H3K36me3 regions compared with other H3K9me3 or H3K36me3 regions in WT and Setdb1 KO cells. Also see Figure S2 and Table S1.
Figure 3
Figure 3
NSD proteins trimethylate H3K36 on dual domains (A) Enrichment of H3K9me3 and H3K36me3 on dual domains and on other H3K9me3 or H3K36me3 regions in WT, Setd2KO, Setdb1 KO, and double KO cells (Wilcoxson signed rank test: p value = 2.2 × 10−16; 2.2 × 10−16; 2.2 × 10−16, respectively). (B) H3K36me3 (red), H3K36me2 (orange) and H3K36me1 (yellow) enrichment on dual domains and other H3K36me3 regions in WT and Setd2 KO cells (Wilcoxson signed rank test: p value = 2.2 × 10−16; 2.2 × 10−16 for H3K36me3; p value = 6.83 × 10−3; 2.4 × 10−4 for H3K36me2; p value = 6.83 × 10−3; 2.4 × 10−4 for H3K36me1 on dual domains and other H3K36me3 regions, respectively). (C) Left: H3K36me3 enrichment on “colocalized” and on “embedded” dual domains in WT and Setd2 KO cells (Wilcoxson signed rank test: p value = 2.2 × 10−16; 2.2 × 10−16 on colocalized dual domains and embedded dual domains, respectively). Right: tracks of H3K9me3 and of H3K36me3 on colocalized and embedded dual domains in WT and Setd2 KO cells. (D) ChIP-qPCR showing the relative H3K36me3 fold-enrichment (left) and H3K9me3 fold-enrichment (right) after input normalization inside positive H3K9me3/H3K36me3 regions (In.), or in Flanking regions (Flk), on intracisternal A particle (IAP, used as a H3K9me3 domain control) or on the Csrnp1 transcribed gene body (used as a H3K36me3 domain control) in WT, Nsd1 KO, Nsd2 KO, and Nsd3 KO cells (: Student’s t test p value < 0.05). (E) Left: H3K36me3 on transcribed gene body regions and on embedded dual domains in WT and in Nsd1 KO cells. Right: tracks of H3K36me3 on a gene body and on an “embedded” dual domain in WT and Nsd1 KO cells. (F) Left: H3K36me3 enrichment on “colocalized” dual domains in WT and Nsd1 KO cells. Right: Tracks of H3K36me3 on a “colocalized” dual domain in WT and Nsd1 KO cells. Also see Figure S3 and Table S1.
Figure 4
Figure 4
Dual domain might repress local bidirectional transcription (A) Number of upregulated genes in Setdb1 KO cells and their status in WT cells. (B) Log2 fold change in expression for a random set of genes (white), for genes hosting a dual domain (purple) and for upregulated genes in Setdb1 KO (gray) (Wilcoxson signed rank test: × p value = 2.2.10−16). (C) H3K4me3, RNA Pol II and Serine 5 (Ser-5) on dual domains and on other H3K9- or H3K36me3 regions in WT and Setdb1 KO cells (Wilcoxson signed rank test: p value = n.s; 0.042; 0.021 for H3K4me3, p value = 1.10 × 10−9; 2.2 × 10−16; 5.538 × 10−4 for RNA Pol II, and p value = 2.2 × 10−16; 2.2 × 10−16; n.s. for Ser5-P on dual domains, other H3K9me3 regions and other H3K36me3 regions, respectively). (D) H3K4me3, RNA Pol II and Serine 5 (Ser5-P) levels on intragenic (left) and on intergenic (right) dual domains in WT, Setdb1 KO cells. (E) Expression levels, log2(Fpkm+1), of intragenic (left) and intergenic (right) dual domains in WT and Setb1 KO cells (Wilcoxson signed rank test: p value = 8.9 × 10−3; ∗∗p value = 5.2 × 10−12). (F) Sense (left) and anti-sense (right) transcription levels, log2(Tpm+1), on dual domains in WT and Setdb1 KO cells (Wilcoxson signed rank test: p value = 3.8 × 10−6; ∗∗p value < 2.2 × 10−16). Also see Figure S4 and Table S1.
Figure 5
Figure 5
Dual domains repress functional enhancers (A) H3K27ac (left) and H3K4me1 (right) enrichment on dual domains, on other H3K9me3 regions or other H3K36me3 regions in WT and Setdb1 KO cells (Wilcoxson signed rank test: : p value = 2.3 × 10−6; 1.85 × 10−15; n.s. for H3K27ac and p value = 1.18 × 10−7; n.s.; 1.36 × 10−10 for H3K4me1 on dual domains, other H3K9me3 regions and other H3K36me3 regions, respectively). (B) MED12 enrichment on dual domains and on other H3K9me3 regions or other H3K36me3 regions at in WT and Setdb1 KO cells. Heatmaps ranked according to the Med12 signal (Wilcoxson signed rank test: p value = 2.05 × 10−7 for dual domains and n.s for other H3K9me3 and H3K36me3 regions). (C) ATAC-seq enrichment on dual domains and on other H3K9me3 regions, or other H3K36me3 regions in WT and Setdb1 KO cells (Wilcoxson signed rank test: p value < 2.2 × 10−16). (D) Top: plasmids used in the enhancer assay. Bottom: normalized luciferase activity after transfection of constructs containing a minimal SV40 promoter only, with an SV40 enhancer, with an H3K9me3 “only” region, with an H3K36me3 “only” region, or 7 selected dual domains. Also see Figure S5 and Table S1.
Figure 6
Figure 6
Dual domains contact promoters of upregulated genes upon SETDB1 depletion (A) Overlap of TADs harboring upregulated and downregulated genes (left), or upregulated genes and dual domains with high (right) and low (bottom) levels of H3K27ac (hypergeometric test: p value = 0.925; 2.27 × 10−13; 3.13 × 10−8). (B) Significance of the overlap between misregulated genes and dual domain classes (hypergeometric test values are shown in each square). (C) PeSCANs of active genes (FPKM > 10) with all dual domains, dual domains with high H3K27ac and low H3K27ac and other H3K9me3 regions, respectively. The maximum distance allowed for interaction scoring is 3 Mb, and the minimum distance is 100 kb. The window sizes span 50 kb upstream and downstream the interaction centers at a resolution of 1 kb. (D) Empirical distribution functions illustrating the interaction strength dynamics upon SETDB1 depletion between upregulated genes and dual domains (top), high H3K27ac domains (middle), and low H3K27ac domains (bottom) (KS one-sided test: p = 1.4 × 10−3; p = 1.4 × 10−4; n.s. for all dual domains, high- and low-H3K27ac domains, respectively). (E) Estimation of intra-TAD target gene specificity of high H3K27a dual domains versus upregulated genes (left) and all the other genes in the same TAD (right) (KS one-sided test: p = 5.7 × 10−3; n.s. upregulated gene and all other genes, respectively). (F) Multiscale representation of the Hi-C results (from 20 Mb to 240 kb). Top: A large genomic region of chromosome 18 is represented based on observed values (log2). TAD calls are highlighted in yellow. TADs harboring both upregulated genes and dual domains are highlighted in blue. Secondary interactions between them are also highlighted as blue boxes. The close-up region represented in the next plot is highlighted by a gray box. Middle: example of a TAD containing an upregulated gene and 4 dual domains. Potential interactions between them are highlighted by the black squares. TAD boundaries are highlighted in blue. Bin-free, distance normalized, interaction scores (shaman) are shown. Bottom: representation of the Ccny locus interaction patterns (score). Interactions between the promoter of Ccny and dual domains are highlighted with black squares on the Hi-C plot. (G) Left: virtual 4C plots using the Ccny promoter, the dual domain 1 and the dual domain 2 as viewpoints, respectively. Right: tracks showing H3K9me3, H3K27ac and RNA-seq level on the Ccny locus in WT and Setdb1 KO cells. (H) Top: virtual 4C plots using the Cd200 (left) or Slc18b1 (right) promoter and the dual domain as viewpoint, respectively. Bottom: tracks showing H3K9me3, H3K27ac, and RNA-seq level on the Cd200 (left) and Slc18b1 (right) locus in WT and Setdb1 KO cells. (I) RT-qPCR to measure the relative mRNA level from target genes, Cd200, Dock9, Mtr, and Ccny, respectively, of after normalization in WT, Setdb1KO, deleted dual domain clones and Setdb1KO-deleted dual domain clones (: Student’s t test p value < 0.05). Also see Figure S6 and Table S1.
Figure 7
Figure 7
Dual domains become enhancers in embryonic and adult tissues (A) Overlap between enhancers or tissue-specific enhancers and dual domains or all other H3K9me3 regions in adult tissues (top) and in embryonic tissues (bottom). (B) H3K27Ac enrichment on 342 dual domains identified after k-mean clustering (see experimental procedure) in adult tissues. (C) Top: tracks showing H3K9me3, H3K36me3 and H3K27ac distributions on a dual domain in WT and Setdb1 KO cells. Bottom: tracks of H3K27ac distribution on a dual domain in adult tissues. (D) H3K27ac enrichment on 342 dual domains identified after k-mean clustering (see experimental procedure) in embryonic tissues. (E) Top: tracks showing H3K9me3, H3K36me3, H3K27ac distributions on a dual domain in WT and Setdb1 KO cells. Bottom: tracks of H3K27ac distributions on dual domains in embryonic tissues. (F) H3K27ac, ATAC-seq, H3K9me3, and H3K36me3 on clustered dual domains (based on k-mean clustering) in forebrain tissue (left) and in liver tissue (right). (G) Transcription levels, log2(fpkm+1), of randomly selected genes (gray) and nearby genes of clustered dual domains (purple) in adult tissues (Wilcoxson signed rank test: : p value = 0.04; 4.3.10−4) and in embryonic tissues (Wilcoxson signed rank test: : p value = 0.036; 1.12.10−6, respectively). Also see Figure S7.

References

    1. Allshire R.C., Madhani H.D. Ten principles of heterochromatin formation and function. Nat. Rev. Mol. Cell Biol. 2018;19:229–244. - PMC - PubMed
    1. Bailey T.L., Boden M., Buske F.A., Frith M., Grant C.E., Clementi L., Ren J., Li W.W., Noble W.S. MEME SUITE: tools for motif discovery and searching. Nucleic Acids Res. 2009;37:W202–W208. - PMC - PubMed
    1. Baubec T., Colombo D.F., Wirbelauer C., Schmidt J., Burger L., Krebs A.R., Akalin A., Schübeler D. Genomic profiling of DNA methyltransferases reveals a role for DNMT3B in genic methylation. Nature. 2015;520:243–247. - PubMed
    1. Bilodeau S., Kagey M.H., Frampton G.M., Rahl P.B., Young R.A. SetDB1 contributes to repression of genes encoding developmental regulators and maintenance of ES cell state. Genes Dev. 2009;23:2484–2489. - PMC - PubMed
    1. Blahnik K.R., Dou L., Echipare L., Iyengar S., O’Geen H., Sanchez E., Zhao Y., Marra M.A., Hirst M., Costello J.F., et al. Characterization of the contradictory chromatin signatures at the 3′ exons of zinc finger genes. PLoS One. 2011;6 - PMC - PubMed

Publication types

MeSH terms

LinkOut - more resources