. 2022 Mar;233(6):2573-2584.
doi: 10.1111/nph.17915. Epub 2022 Jan 26.

From cultivar mixtures to allelic mixtures: opposite effects of allelic richness between genotypes and genotype richness in wheat

Affiliations

From cultivar mixtures to allelic mixtures: opposite effects of allelic richness between genotypes and genotype richness in wheat

Germain Montazeaud et al. New Phytol. 2022 Mar.

Abstract

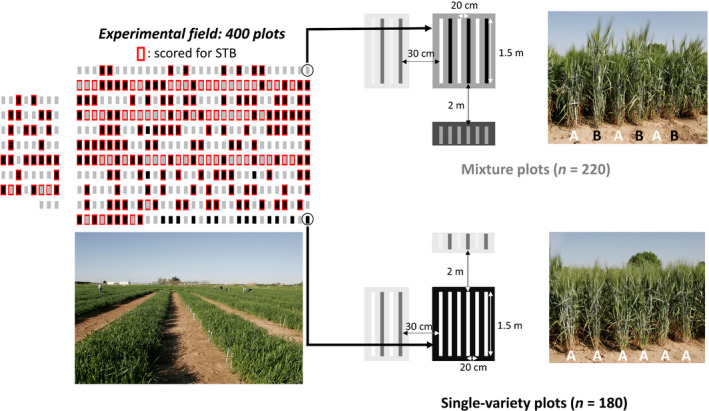
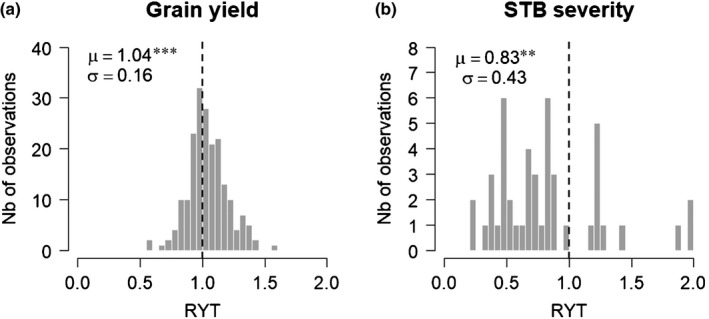
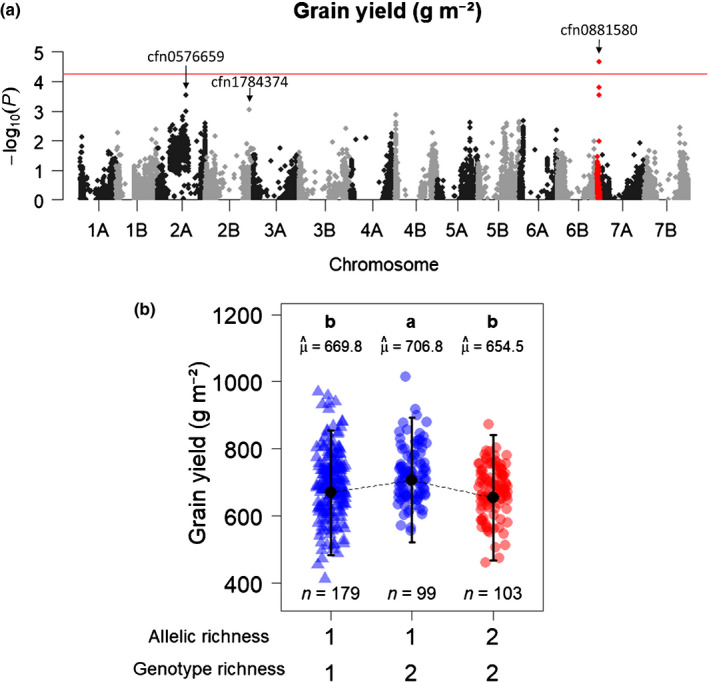
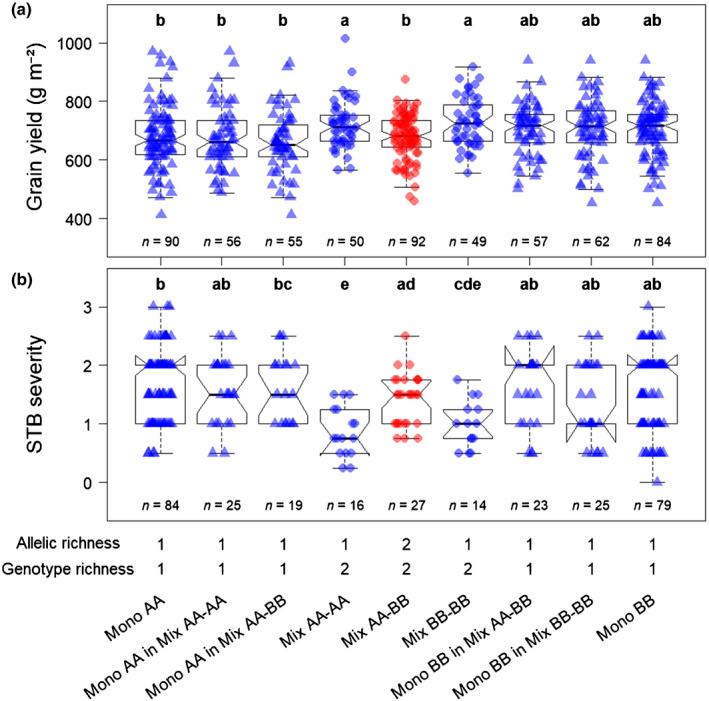
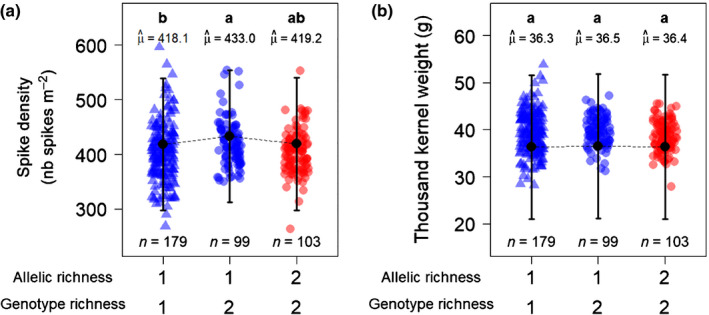
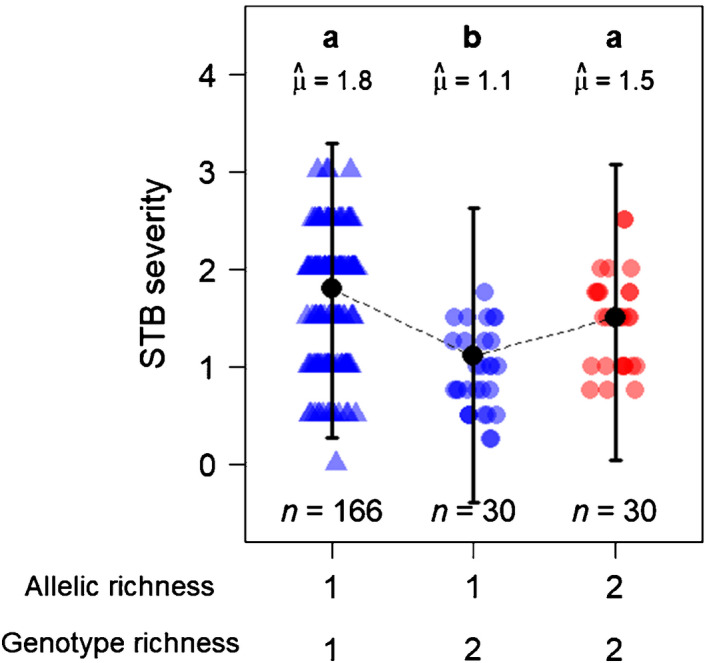
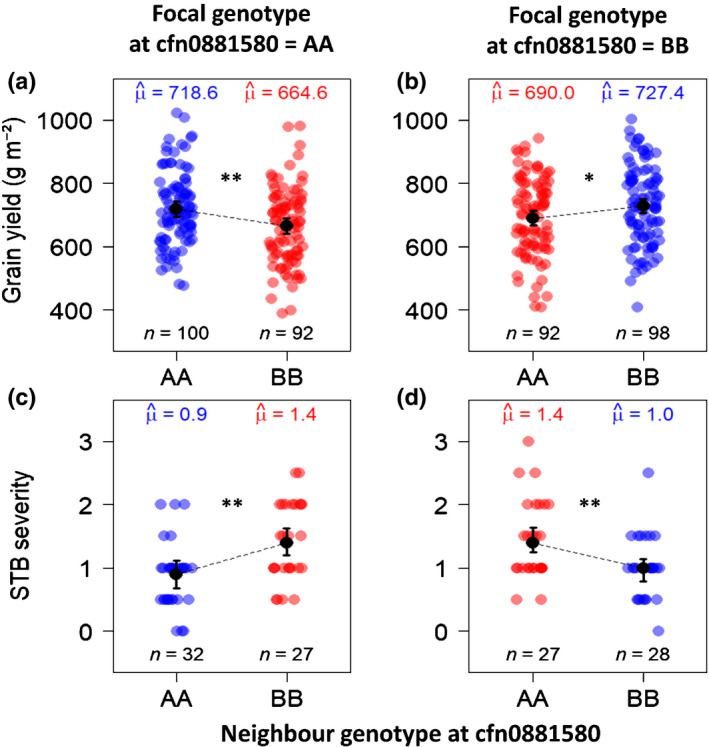
Agroecosystem diversification through increased crop genetic diversity could provide multiple services such as improved disease control or increased productivity. However, we still poorly understand how genetic diversity affects agronomic performance. We grew 179 inbred lines of durum wheat in pure stands and in 202 binary mixtures in field conditions. We then tested the effect of allelic richness between genotypes and genotype richness on grain yield and Septoria tritici blotch disease. Allelic richness was tested at 19K single nucleotide polymorphisms distributed along the durum wheat genome. Both genotype richness and allelic richness could be equal to 1 or 2. Mixtures were overall more productive and less diseased than their pure stand components. Yet, we identified one locus at which allelic richness between genotypes was associated with increased disease severity and decreased grain yield. The effect of allelic richness at this locus was stronger than the effect of genotype richness on grain yield (-7.6% vs +5.7%). Our results suggest that positive effects of crop diversity can be reversed by unfavourable allelic associations. This highlights the need to integrate genomic data into crop diversification strategies. More generally, investigating plant-plant interactions at the genomic level is promising to better understand biodiversity-ecosystem functioning relationships.

Keywords: Septoria tritici blotch; allelic richness; crop; diversity; genome-wide analysis; plant-plant interactions; varietal mixtures.


Figures

Fig. 1
Fig. 1
Overview of the experimental design with 400 field plots of durum wheat (Triticum turgidum ssp. durum) grown as single‐variety plots or binary mixtures. The whole design is represented on the left, with single‐variety (pure stand) plots in black, and mixture plots in grey. As shown in the figure, the design had to be split in two parts separated by c. 10 m to allow the irrigation system wheel to pass through. Pure stands and mixture plots were arranged randomly in the field. Plots scored for Septoria tritici blotch disease (STB) are framed in red. In total, 381 plots (179 pure stands and 202 mixtures) were included in the analyses after removing plots with incomplete data due to sowing or sampling problems.
Fig. 2
Fig. 2
Distribution of mixing effects in field‐grown varietal mixtures of durum wheat (Triticum turgidum ssp. durum). Mixing effects are reported for grain yield (a, n = 197) and Septoria tritici blotch disease (STB) severity (b, n = 46). Mixing effects were quantified with the relative yield total (RYT) index. Means (μ) and standard deviations (σ) are reported. The star symbol indicates a mean RYT significantly different from 1 (t‐test, **, P ≤ 0.01; ***, P ≤ 0.001).
Fig. 3
Fig. 3
Effects of allelic richness and genotype richness on grain yield in durum wheat (Triticum turgidum ssp. durum). (a) Manhattan plot reporting P‐values (−log10 transformed) for the association tests between grain yield and allelic richness at 18 868 SNPs distributed along the durum wheat genome. The solid red line represents the family‐wise error rate (FWER) of 5% computed with the Galwey method. (b) Grain yield over the different combinations of allelic richness at cfn0881580 and genotype richness. Genotype richness is quantified as the number of genotypes in the plot, while allelic richness is quantified as the number of alleles in the plot. Point shapes: triangle, pure stand plots; circles, mixture plots. Point colours: blue, monoallelic plots; red, bi‐allelic plots. Black points and error bars represent the estimated marginal means and their 95% confidence interval. n, number of observations in each category, μ^, marginal means. Categories with different letters are significantly different at P < 0.05 (Tukey adjustment). Detailed results of the statistical analyses can be found in Supporting Information Table S4.
Fig. 4
Fig. 4
Detailed effects of allelic richness at cfn0881580 and genotype richness on grain yield (a) and Septoria tritici blotch disease (STB) severity (b) in durum wheat (Triticum turgidum ssp. durum). Here we compare grain yield and STB severity, both measured at the plot level, among different subsets of pure stand and mixture plots: all pure stands in which genotypes carried the ‘A’ allele at cfn0881580 (‘Mono AA’), subset of pure stands in which genotypes carried the ‘A’ allele and were used in monoallelic mixtures (‘Mono AA in Mix AA‐AA’), subset of pure stands in which genotypes carried the ‘A’ allele and were used in bi‐allelic mixtures (‘Mono AA in Mix AA‐BB’), mixtures in which both genotypes carried the ‘A’ allele (‘Mix AA‐AA’), mixtures in which one genotype carried the ‘A’ allele and the other genotype carried the ‘B’ allele (‘Mix AA‐BB’), mixtures in which both genotypes carried the ‘B’ allele (‘Mix BB‐BB’), subset of pure stands in which genotypes carried the ‘B’ allele and were used in bi‐allelic mixtures (‘Mono BB in Mix AA‐BB’), subset of pure stands in which genotypes carried the ‘B’ allele and were used in monoallelic mixtures (‘Mono BB in Mix BB‐BB’), and all pure stands in which genotypes carried the ‘B’ allele (‘Mono BB’). Point shapes: triangles, pure stand plots; circles, mixture plots. Point colours: blue, monoallelic plots; red, bi‐allelic plots. n, number of observations in each category. Categories with different letters are significantly different at P < 0.05 (Tukey adjustment).
Fig. 5
Fig. 5
Effects of allelic richness at cfn0881580 and genotype richness on spike density (a) and 1000 kernel weight (b) in durum wheat (Triticum turgidum ssp. durum). Both spike density and 1000 kernel weight are compared over the different combinations of allelic richness at cfn0881580 and genotype richness. Genotype richness is quantified as the number of genotypes in the plot, while allelic richness is quantified as the number of alleles at in the plot. Point shapes: triangles, pure stand plots; circles, mixture plots. Point colours: blue, monoallelic plots; red, bi‐allelic plots. Black points and error bars represent the estimated marginal means and their 95% confidence interval. n, number of observations in each category, μ^, marginal means. Categories with different letters are significantly different at P < 0.05 (Tukey adjustment). Detailed results of the statistical analyses can be found in Supporting Information Table S5.
Fig. 6
Fig. 6
Effects of allelic richness at cfn0881580 and genotype richness on Septoria tritici blotch disease (STB) severity in durum wheat (Triticum turgidum ssp. durum). Septoria tritici blotch severity is compared over the different combinations of allelic richness at cfn0881580 and genotype richness. Genotype richness is quantified as the number of genotypes in the plot, while allelic richness is quantified as the number of alleles at in the plot. Point shapes: triangles, pure stand plots; circles, mixture plots. Point colours: blue, monoallelic plots; red, bi‐allelic plots. Black points and error bars represent the estimated marginal means and their 95% confidence interval. n, number of observations in each category, μ^, marginal means. Categories with different letters are significantly different at P < 0.05 (Tukey adjustment). Detailed results of the statistical analyses can be found in Supporting Information Table S4.
Fig. 7
Fig. 7
Effect of the interaction between focal allele and neighbour allele at cfn0881580 on grain yield (a, b) and Septoria tritici blotch disease (STB) severity (c, d) in mixture plots of durum wheat (Triticum turgidum ssp. durum). Neighbour allele (genotype) here refers to the allele (genotype) carried by the mixture partner of the focal genotype. Point colours: blue, grain yield (a, b) or STB severity (c, d) measured on mixture components that shared the same allele as their neighbours, red, grain yield (a, b) or STB severity (c, d) measured on mixture components that carried a different allele than their neighbours. n, number of observations in each category, μ^, marginal means. Black points and error bars represent the estimated marginal means and their 95% confidence interval. Statistical significance is highlighted with black stars (*, P ≤ 0.05; **, P ≤ 0.01). Detailed results of the statistical analyses can be found in Supporting Information Tables S2, S3.

References

    1. Altieri MA. 1999. The ecological role of biodiversity in agroecosystems. Agriculture, Ecosystems & Environment 74: 19–31.
    1. Ballini E, Tavaud M, Ducasse A, Sanchez D, Paux E, Kitt J, Charmet G, Audigeos D, Roumet P, David J et al. 2020. Genome wide association mapping for resistance to multiple fungal pathogens in a panel issued from a broad composite cross‐population of tetraploid wheat Triticum turgidum . Euphytica 216: 92.
    1. Barot S, Allard V, Cantarel A, Enjalbert J, Gauffreteau A, Goldringer I, Lata J‐C, Roux XL, Niboyet A, Porcher E. 2017. Designing mixtures of varieties for multifunctional agriculture with the help of ecology. A review. Agronomy for Sustainable Development 37: 13.
    1. Borg J, Kiær LP, Lecarpentier C, Goldringer I, Gauffreteau A, Saint‐Jean S, Barot S, Enjalbert J. 2018. Unfolding the potential of wheat cultivar mixtures: a meta‐analysis perspective and identification of knowledge gaps. Field Crops Research 221: 298–313.
    1. Castro AC, Simón MR. 2016. Effect of tolerance to Septoria tritici blotch on grain yield, yield components and grain quality in Argentinean wheat cultivars. Crop Protection 90: 66–76.

Publication types

LinkOut - more resources