. 2022 Mar;32(3):425-436.
doi: 10.1101/gr.276449.121. Epub 2022 Jan 26.

Genomic context sensitivity of insulator function

Affiliations

Genomic context sensitivity of insulator function

André M Ribeiro-Dos-Santos et al. Genome Res. 2022 Mar.

Abstract

The specificity of interactions between genomic regulatory elements and potential target genes is influenced by the binding of insulator proteins such as CTCF, which can act as potent enhancer blockers when interposed between an enhancer and a promoter in a reporter assay. But not all CTCF sites genome-wide function as insulator elements, depending on cellular and genomic context. To dissect the influence of genomic context on enhancer blocker activity, we integrated reporter constructs with promoter-only, promoter and enhancer, and enhancer blocker configurations at hundreds of thousands of genomic sites using the Sleeping Beauty transposase. Deconvolution of reporter activity by genomic position reveals distinct expression patterns subject to genomic context, including a compartment of enhancer blocker reporter integrations with robust expression. The high density of integration sites permits quantitative delineation of characteristic genomic context sensitivity profiles and their decomposition into sensitivity to both local and distant DNase I hypersensitive sites. Furthermore, using a single-cell expression approach to test the effect of integrated reporters for differential expression of nearby endogenous genes reveals that CTCF insulator elements do not completely abrogate reporter effects on endogenous gene expression. Collectively, our results lend new insight into genomic regulatory compartmentalization and its influence on the determinants of promoter-enhancer specificity.


Figures

Figure 1.
Figure 1.
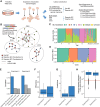
Cellular activity of enhancer blocker activity. (A) Reporter scheme consisting of HBG1 promoter (GGlo) driving Puro and GFP expression. A CTCF site is interposed between the promoter and an HS2 enhancer to act as an enhancer blocker. (ITR) Sleeping Beauty inverted terminal repeats; (HS2) beta-globin hypersensitive site 2 enhancer. (B) Reporter plasmids cotransfected with a plasmid expressing the Sleeping Beauty SB100X transposase for random genomic integration. GFP activity was measured by flow cytometry. A1 and C1 represent previously characterized CTCF-binding insulator elements (Liu et al. 2015). A1Core and C1Core were truncated to the core 54-bp CTCF recognition sequence. FW and RV indicate forward or reverse orientation of insulator elements. Independent transfections are shown separately. Dots indicate median GFP levels, and whiskers extend to the 25th and 75th percentiles.
Figure 2.
Figure 2.
Site-specific profiling of enhancer blocker activity. (A) Barcoded reporters were randomly integrated using SB100X transposase. Site-specific reporter activity was read out in multiplex using sequencing to map insertion sites (inverse PCR libraries), barcode representation (DNA libraries), and expression (RNA libraries). (GGlo) HBG1 promoter; (BC) unique barcode; (HS2) beta-globin hypersensitive site 2 enhancer; (ITR) Sleeping Beauty inverted terminal repeats. (B) Counts of analyzed sites in thousands for five experiments including promoter-only (GGlo), promoter and HS2 enhancer (GGlo + HS2), with CTCF site interposed between GGlo and HS2 (Ins + GGlo + Ins + HS2), or with CTCF sites fully flanking the reporter and enhancer (Ins + GGlo + HS2 + Ins). (C,D) Analysis of enhancer blocker functionality at the HBB (C) and MYC (D) loci. The top three tracks show reporter activity. Data shown merged from replicate experiments. The bottom three tracks show CTCF ChIP-seq data for K562 erythroleukemia cells, and DNase-seq data for K562 and Jurkat T-cell leukemia cells. Regions highlighted in D include the MYC-335 enhancer region coinciding with a genetic association for colorectal cancer (Sur et al. 2012), the Notch-T-ALL (Acute Lymphocytic Leukemia) enhancer cluster (Herranz et al. 2014), and the AML (acute myeloid leukemia) amplified region (Radtke et al. 2009).
Figure 3.
Figure 3.
Quantitative assessment of genomic context effects on reporter activity. (A) Distribution of activity by reporter class. Average activity was computed across all fully mappable 10-kb bins with at least one insertion. Horizontal bars represent medians. (B) Correlation in activity for nearby insertions by reporter class merged across all experiments. For each insertion, 50 nearby insertions were sampled with replacement from within 500 kb. Correlation was computed across pairs of insertions in each distance bin. Bins with fewer than 100 data points were omitted. (C) Model of genomic context effects on reporter activity and correlation profiles. Increased correlation across all length scales reflects deterministic versus stochastic activity. Constant correlation across all length scales reflects context-independent activity, whereas a reduction of correlation with distance represents genomic context dependency. (D) Linear regression coefficients for model partitioning reporter activity into close and long-range genomic context represented by count of DHSs within 5 and 100 kb, respectively. (E) Predictive performance of reporter activity using DHS data from other cell types. Bar indicates median. (F) Predictive performance of models incorporating ENCODE histone and TF ChIP-seq data, and lamin-associated domains (LADs) (Leemans et al. 2019). Model including the number of DHSs within 5 and 100 kb as features is used as baseline for comparison (dashed line). (G) Analysis of TF ChIP-seq feature importance under iterative removal of feature with smallest effect size. Inflection points are labeled with the number of ChIP-seq features.
Figure 4.
Figure 4.
scRNA-seq inference of clonal relationship of reporter insertions. (A) scRNA-seq experiment to infer clonal relationships between single cells using presence of reporter BCs. (B) Graph-based inference of clones from scRNA-seq data using reporter BC to link cells deriving from the same clone. (C,D) Deconvolution of pooled transfections in Experiment 5. The x-axis represents cells (C) or final inferred clones (D), grouped by inferred transfection and ordered according to hierarchical clustering. (Multiple) reporter BCs or cellBCs linked to multiple transfections; (Unknown) reporter BCs or cellBCs detected only in scRNA-seq data. (E) Reporter BC counts show high correlation across multiple cells. All reporter BCs in the same cells or reporter BC counts shuffled within clones show little correlation. (FH) Summary of clones including number of cells per clone (F), number of reporter BCs per clone (G), and distance between reporters integrated in cells derived from the same clone (H). Boxes represent 1st and 3rd quartiles, horizontal bars indicate median, and whiskers represent ±1.5 interquartile range. Horizontal red line in H at 500 kb indicates distance cutoff selected for insertions in the same clone to be considered independent.
Figure 5.
Figure 5.
Analysis of reporter effect on nearby endogenous gene expression. (A) Schematic of DECAL analysis framework. (B,C) Rate of significant effect on gene expression by whether reporter and gene are in the same TAD (B) and whether reporter is inside or outside gene body (C). Numbers at the top indicate the number of significant tests. Error bars represent 99% confidence intervals estimated by 1000 bootstrap simulations. (D) Significant tests for each category broken down by proportion of those that increase versus decrease expression.

References

    1. Akhtar W, de Jong J, Pindyurin AV, Pagie L, Meuleman W, de Ridder J, Berns A, Wessels LFA, van Lohuizen M, van Steensel B. 2013. Chromatin position effects assayed by thousands of reporters integrated in parallel. Cell 154: 914–927. 10.1016/j.cell.2013.07.018 - DOI - PubMed
    1. Bell AC, Felsenfeld G. 2000. Methylation of a CTCF-dependent boundary controls imprinted expression of the Igf2 gene. Nature 405: 482–485. 10.1038/35013100 - DOI - PubMed
    1. Biddy BA, Kong W, Kamimoto K, Guo C, Waye SE, Sun T, Morris SA. 2018. Single-cell mapping of lineage and identity in direct reprogramming. Nature 564: 219–224. 10.1038/s41586-018-0744-4 - DOI - PMC - PubMed
    1. Chung JH, Whiteley M, Felsenfeld G. 1993. A 5′ element of the chicken β-globin domain serves as an insulator in human erythroid cells and protects against position effect in Drosophila. Cell 74: 505–514. 10.1016/0092-8674(93)80052-G - DOI - PubMed
    1. de Jong J, Akhtar W, Badhai J, Rust AG, Rad R, Hilkens J, Berns A, van Lohuizen M, Wessels LFA, de Ridder J. 2014. Chromatin landscapes of retroviral and transposon integration profiles. PLoS Genet 10: e1004250. 10.1371/journal.pgen.1004250 - DOI - PMC - PubMed

Publication types

Substances