. 2022 Feb 1;119(5):e2111607119.
doi: 10.1073/pnas.2111607119.

Surface NMR using quantum sensors in diamond

Affiliations

Surface NMR using quantum sensors in diamond

Kristina S Liu et al. Proc Natl Acad Sci U S A. .

Abstract

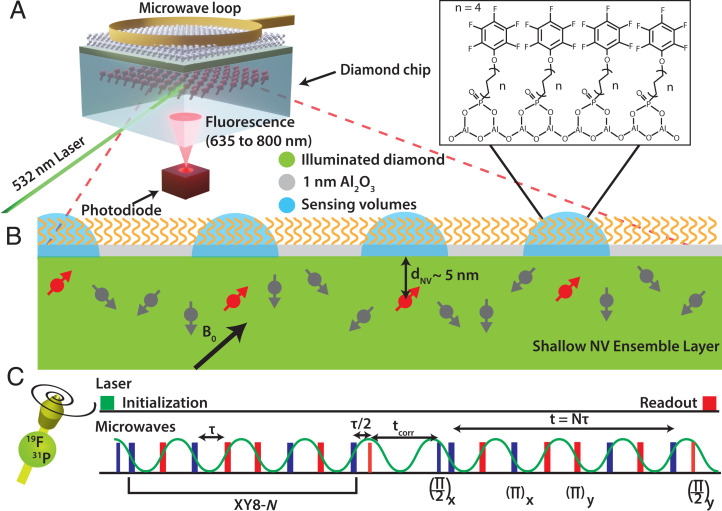
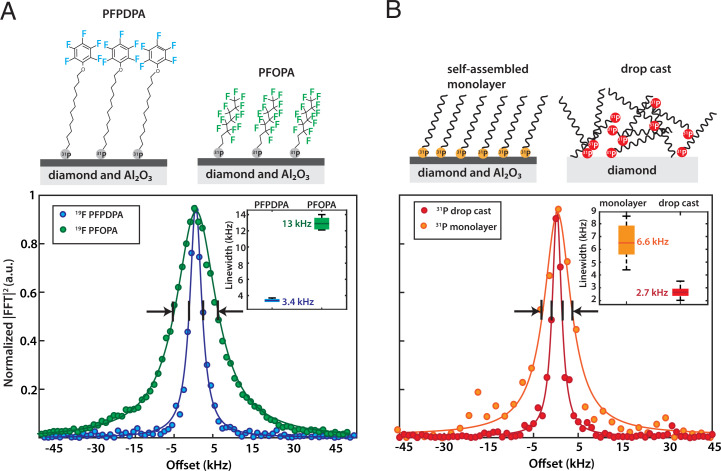
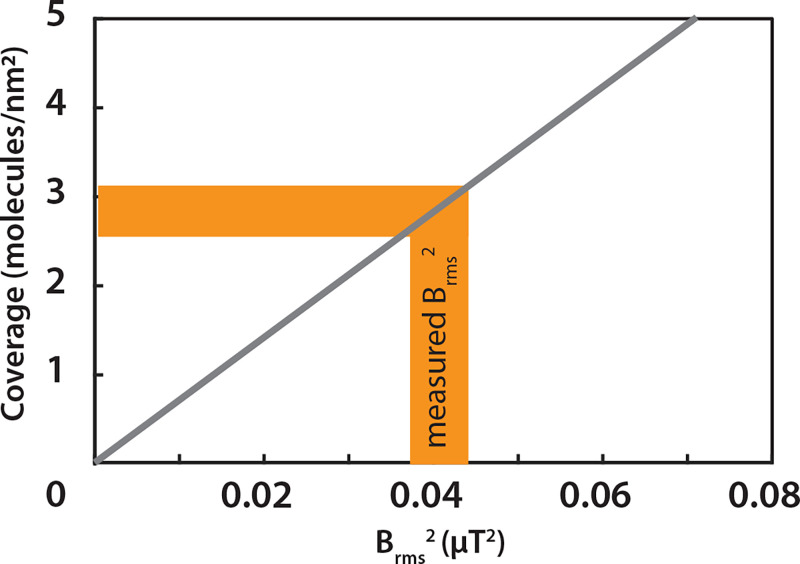
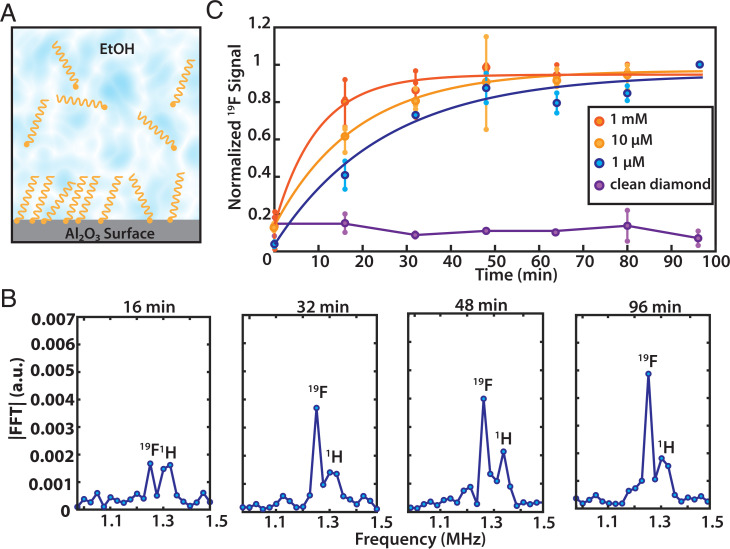
NMR is a noninvasive, molecular-level spectroscopic technique widely used for chemical characterization. However, it lacks the sensitivity to probe the small number of spins at surfaces and interfaces. Here, we use nitrogen vacancy (NV) centers in diamond as quantum sensors to optically detect NMR signals from chemically modified thin films. To demonstrate the method's capabilities, aluminum oxide layers, common supports in catalysis and materials science, are prepared by atomic layer deposition and are subsequently functionalized by phosphonate chemistry to form self-assembled monolayers. The surface NV-NMR technique detects spatially resolved NMR signals from the monolayer, indicates chemical binding, and quantifies molecular coverage. In addition, it can monitor in real time the formation kinetics at the solid-liquid interface. With our approach, we show that NV quantum sensors are a surface-sensitive NMR tool with femtomole sensitivity for in situ analysis in catalysis, materials, and biological research.

Keywords: NV center in diamond; quantum sensing; self-assembled monolayer; spectroscopy; surface analysis.


Conflict of interest statement

The authors declare no competing interest.

Figures

Fig. 1.
Fig. 1.
Surface NV-NMR spectroscopy on a functionalized metal oxide surface. (A) Scheme of the experiment. Near surface NV centers in a 2 × 2 × 0.5 mm diamond chip are excited with a 532-nm laser in a total internal reflection geometry. The resulting spin-dependent photoluminescence from the NV defects is detected with an avalanche photodiode. The microwave pulses for quantum control of the spin state of the defects are delivered through a small wire loop. (B) NV centers aligned with the magnetic field have sensing volumes with a radius determined by their distance to the surface, 4.5 ± 1.9 nm in our case. (Inset) Schematic of an organic monolayer formed from PFPDPA on 1 nm Al2O3 deposited on the diamond surface by ALD. (C) Correlation spectroscopy pulse sequence. Two blocks of dynamic decoupling XY8-N sequences are correlated by sweeping the time between them (tcorr). The time spacing τ between the π pulses is set to half the period of the Larmor frequency of the nuclear spin being sensed. The NV spin state is initialized with a 532-nm laser pulse, and photoluminescence detection with a photodiode occurs after the microwave pulse sequence.
Fig. 2.
Fig. 2.
Surface NV-NMR and validation with complementary analytical surface techniques. (A) Diamond coated with an Al2O3 layer. The thickness of the ALD-deposited Al2O3 layer was determined by AFM scratching measurements. The height profile along the segment indicated by a blue arrow was used to determine the Al2O3 film thickness of 0.9 ± 0.1 nm. (B) Functionalized Al2O3 surface on diamond. The presence of PFPDPA molecules on the surface is confirmed with XPS by the appearance of F 1s and P 2s peaks (blue), which are absent on the clean diamond (yellow). (C) Surface NV-NMR spectroscopy. (Top) Image of the laser spot (∼4,000 µm2) on the diamond and time domain correlation signal of 19F. (Bottom) Surface NV-NMR spectrum of 31P detected from the monolayer measured at 174 mT and 19F nuclei detected at 31 mT. The clean diamond reference is shown in yellow.
Fig. 3.
Fig. 3.
Probing the homogeneity of the phosphonate monolayer. (A) Optical image of the diamond with marked measurement positions (color-coded, the laser spot for the green position is shown). The microwave loop for quantum control appears in black, the NV fluorescence of the excitation laser spot in white. (B) Normalized 19F spectra of the different positions that are indicated in A.
Fig. 4.
Fig. 4.
Spectroscopic characterization of the SAM layer. (A) Influence of molecular structure on 19F resonance linewidth. The 19F linewidth of a monolayer made from PFOPA is approximately four times broader than that of PFPDPA. This is likely caused by local dynamics of the fluorinated phenolic moiety, which lead to line narrowing of the NMR signal. (Inset) Statistics over three experiments. The green and blue bars show one SD for the PFPDPA and PFOPA monolayers. The darker green and blue lines indicate the mean. The black lines are the minimum and maximum obtained linewidths. (B) Comparison of the 31P linewidth for a SAM layer (Left) and a drop cast sample (Right). The 31P linewidth in the case of a SAM layer is more than two times broader than that of the drop cast sample. (Inset) Statistics over eight repeated experiments. The orange and red bars show one SD for the monolayer and drop cast, respectively. The darker orange and red lines indicate the mean. The black lines are the minimum and maximum obtained linewidths.
Fig. 5.
Fig. 5.
Quantification of the molecular coverage. The gray curve shows the molecular coverage as a function of sensed fluctuating magnetic field (Brms2). Experimentally obtained Brms2 of ∼0.04 μT2 corresponds to a molecular coverage of ∼3 molecules/nm2 shown in yellow shading for a monolayer.
Fig. 6.
Fig. 6.
Probing surface chemistry in situ. (A) Schematic of monolayer formation on Al2O3 in PA solution. (B) Individual spectra of 19F showing the time evolution for a 1-µM solution. The peak around 1.35 MHz can be assigned to protons (1H) which are known to be ubiquitous on or within the diamond and are not characteristic of the surface chemistry. (C) Real-time monitoring of the 19F NMR signal amplitude growth in solution for three different PA concentrations shows a decrease in formation rate for lower concentrations. Small markers are measured data points of repeated experiments connected with a vertical line, averaged data are shown with the large points. Data points are fitted with a single exponential. Background signal of a clean, non-Al2O3–coated diamond in a 10-µM PA solution shows no 19F signal. Note that due to the absolute value of the Fourier transformation, the noise floor is always positive.

References

    1. Somorjai G. A., Li Y., Impact of surface chemistry. Proc. Natl. Acad. Sci. U.S.A. 108, 917–924 (2011). - PMC - PubMed
    1. Salmeron M., From surfaces to interfaces: Ambient pressure XPS and beyond. Top. Catal. 61, 2044–2051 (2018).
    1. Velasco-Vélez J. J., et al. , Atmospheric pressure X-ray photoelectron spectroscopy apparatus: Bridging the pressure gap. Rev. Sci. Instrum. 87, 053121 (2016). - PubMed
    1. Bolli E., Kaciulis S., Mezzi A., ESCA as a tool for exploration of metals’ surface. Coatings 10, 1182 (2020).
    1. Wang M., Árnadóttir L., Xu Z. J., Feng Z., In situ X-ray absorption spectroscopy studies of nanoscale electrocatalysts. Nano-Micro Lett. 11, 47 (2019). - PMC - PubMed

Publication types