. 2022 Feb 15;208(4):941-954.
doi: 10.4049/jimmunol.2100213. Epub 2022 Jan 26.

TPL-2 Inhibits IFN-β Expression via an ERK1/2-TCF-FOS Axis in TLR4-Stimulated Macrophages

Affiliations

TPL-2 Inhibits IFN-β Expression via an ERK1/2-TCF-FOS Axis in TLR4-Stimulated Macrophages

Louise Blair et al. J Immunol. .

Abstract

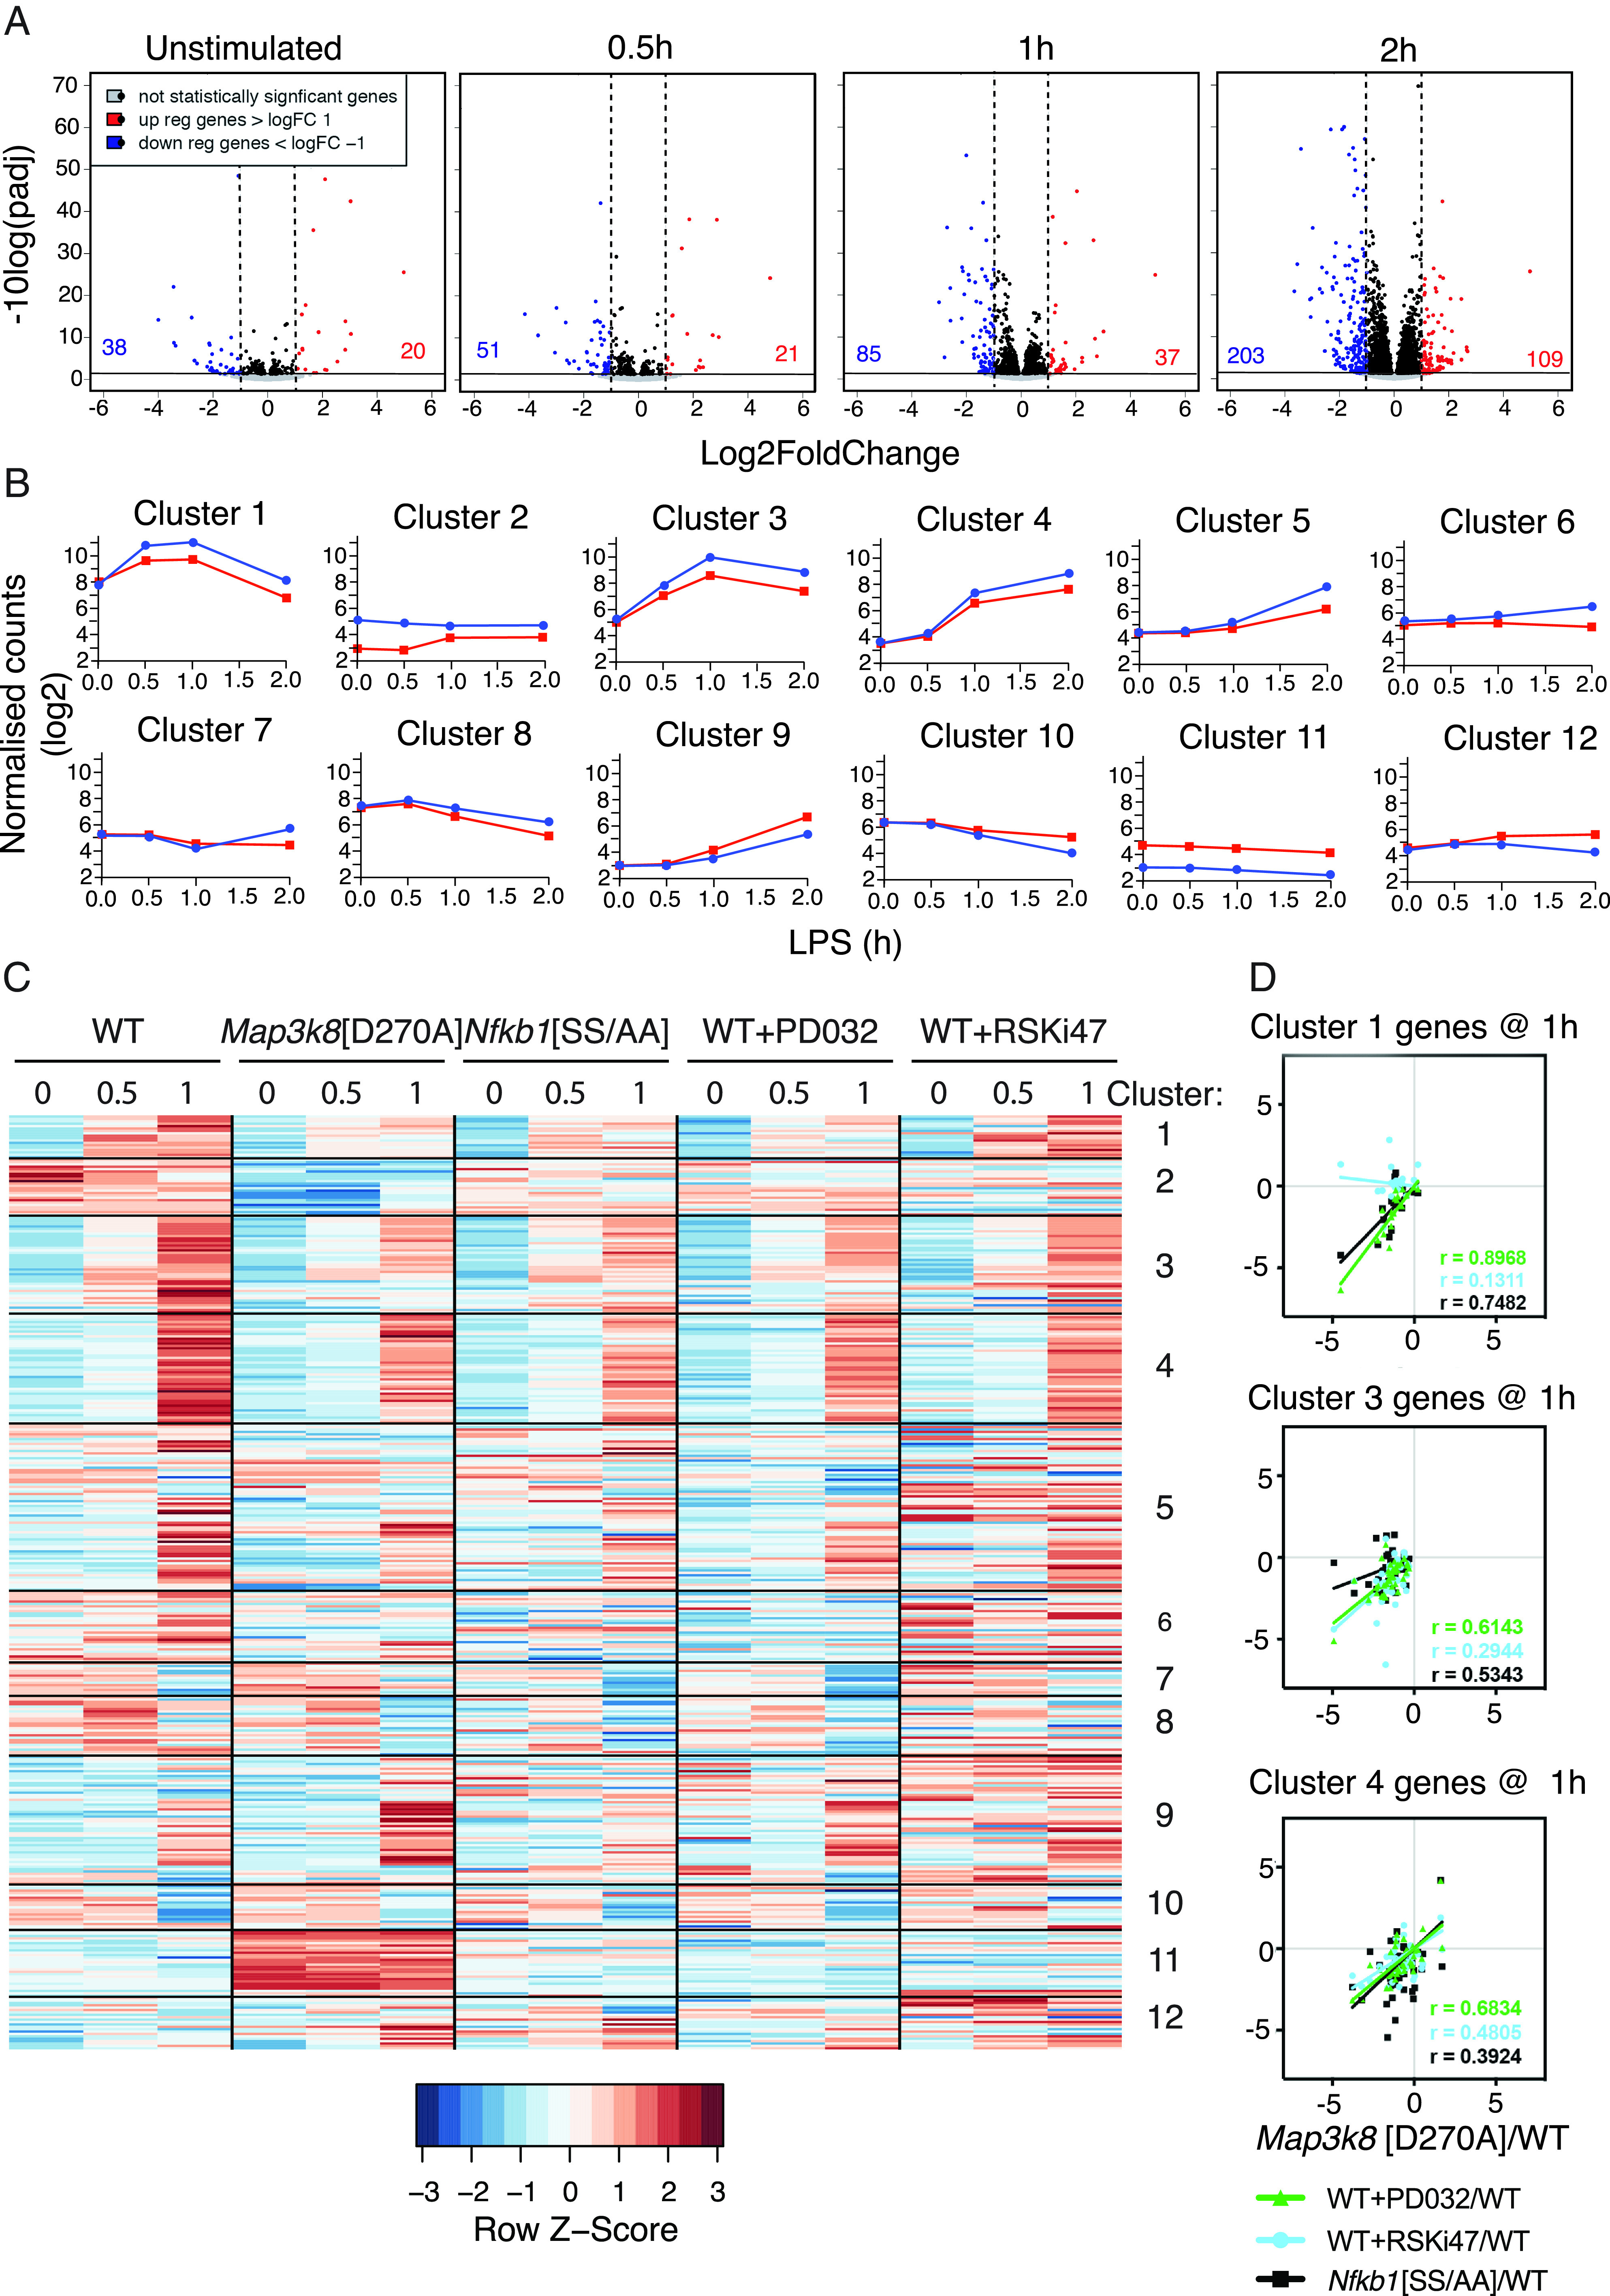
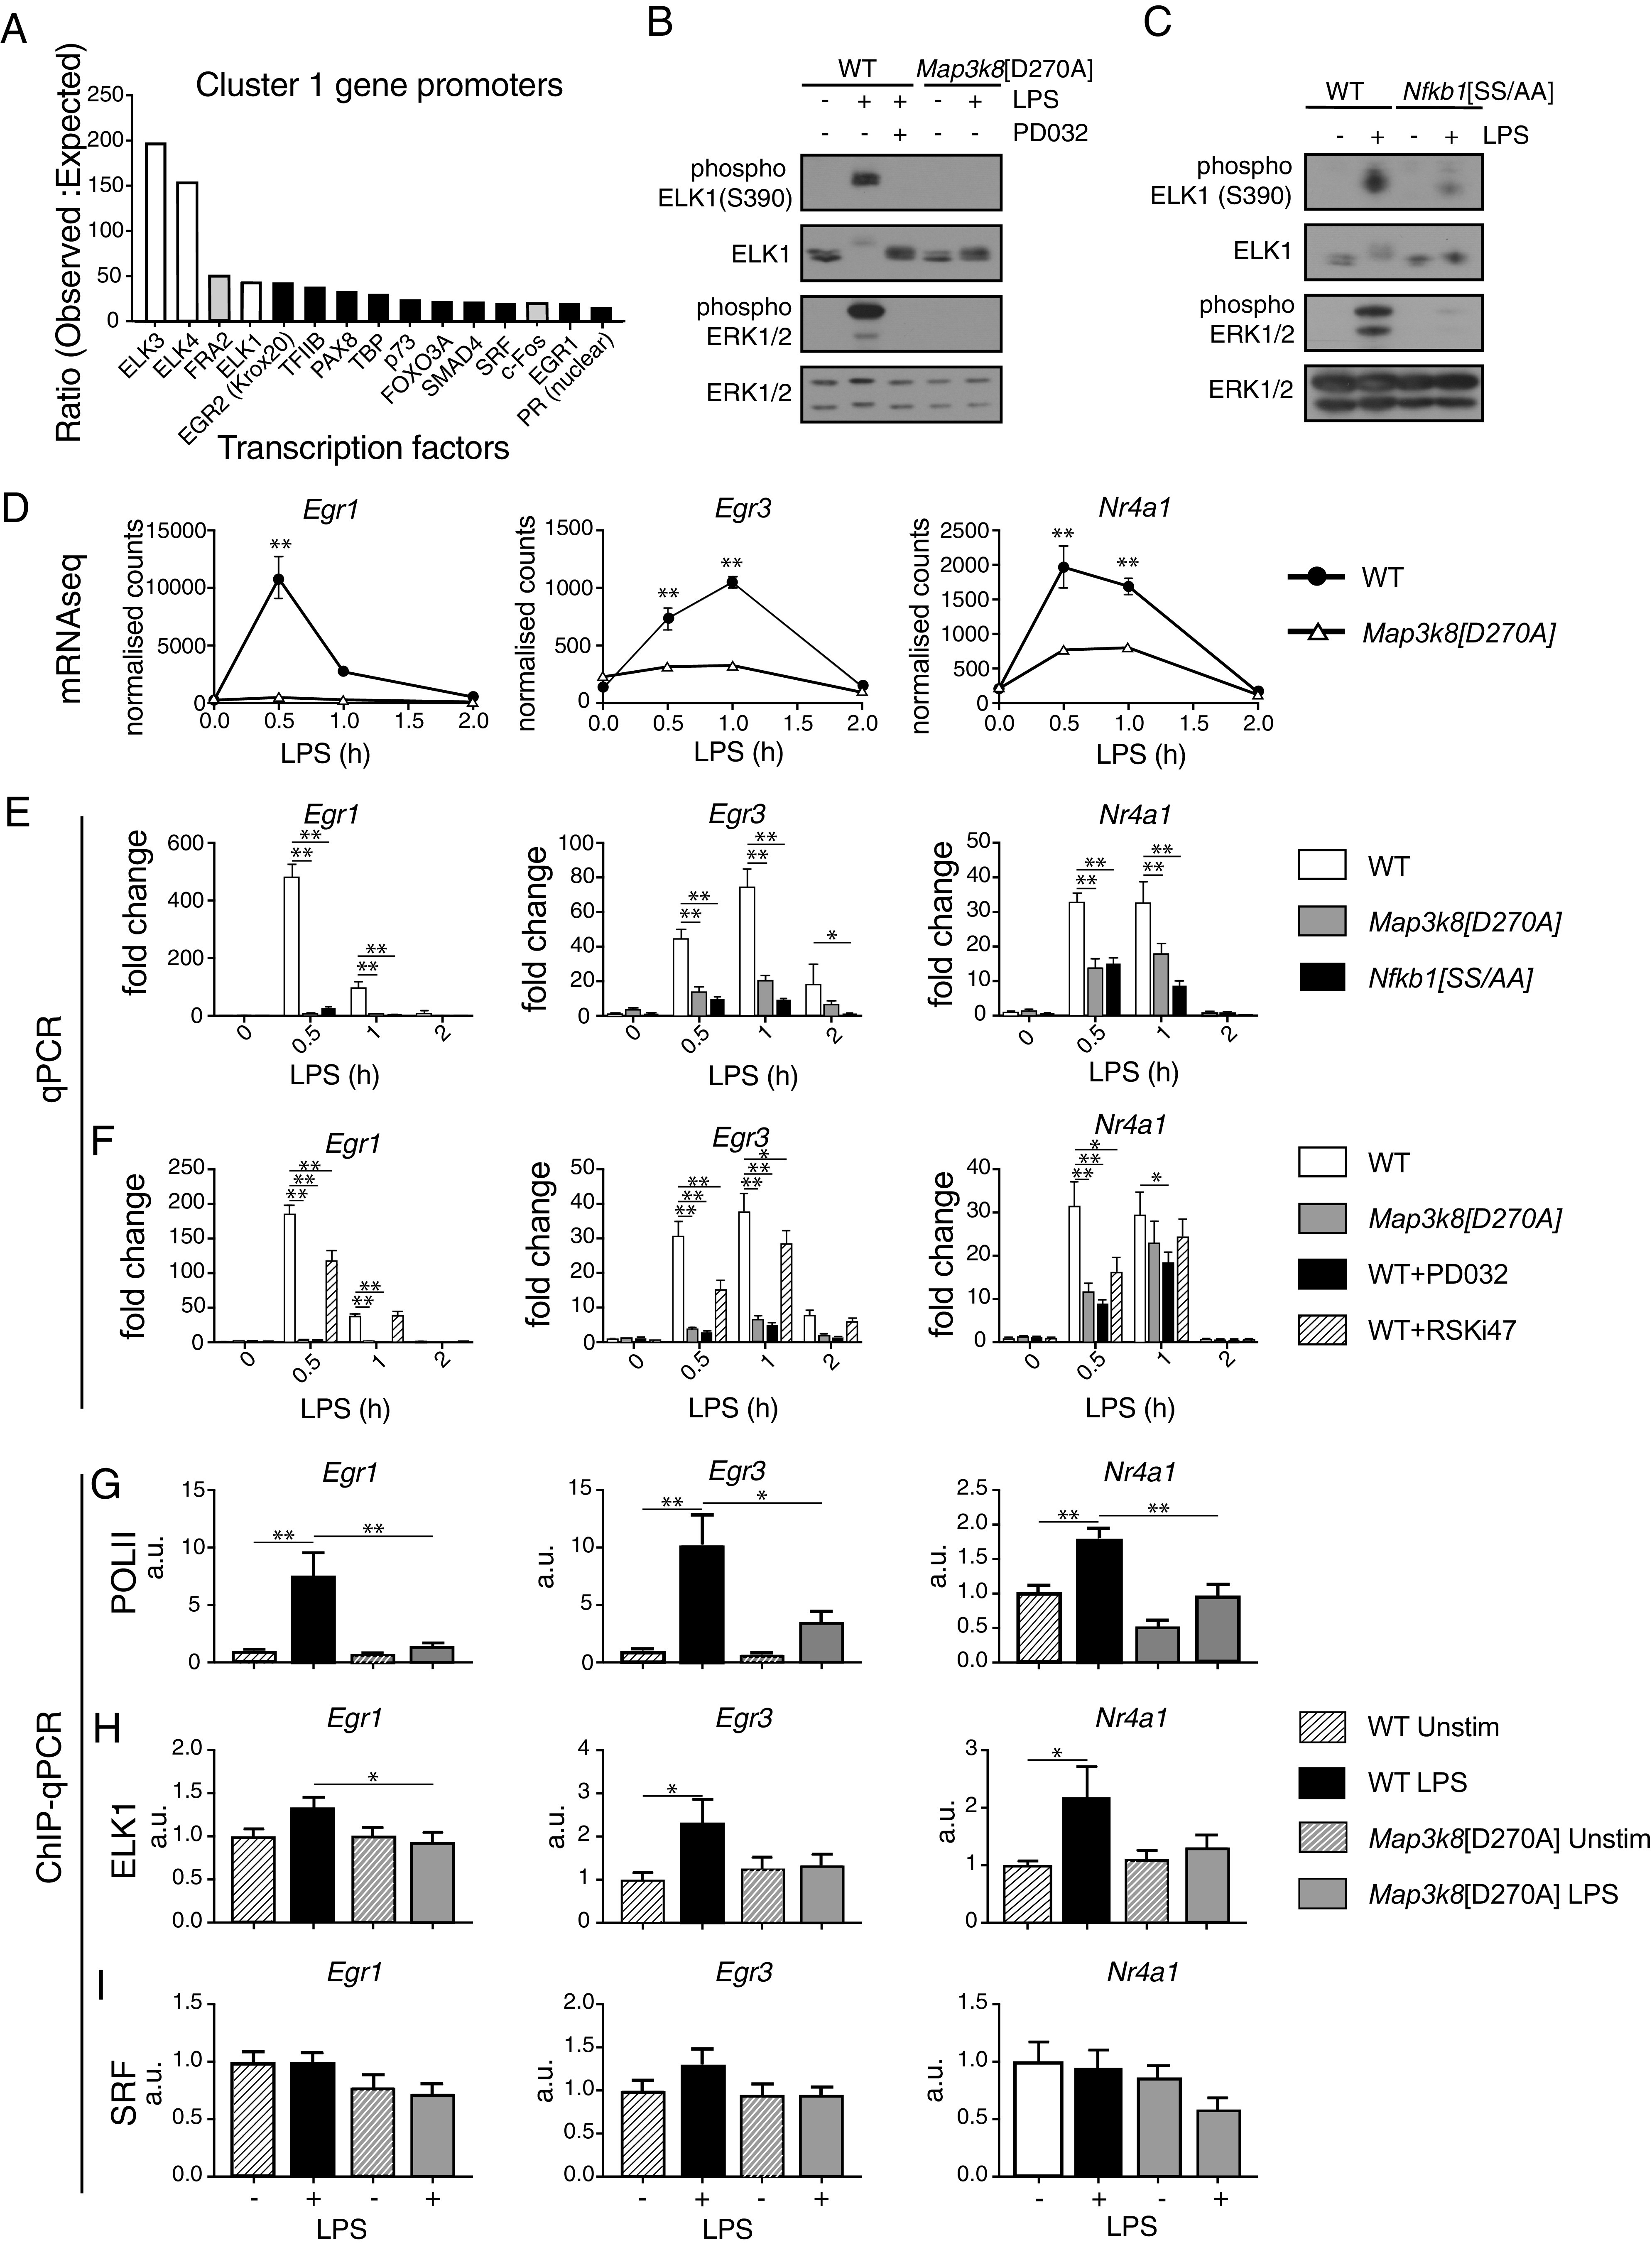
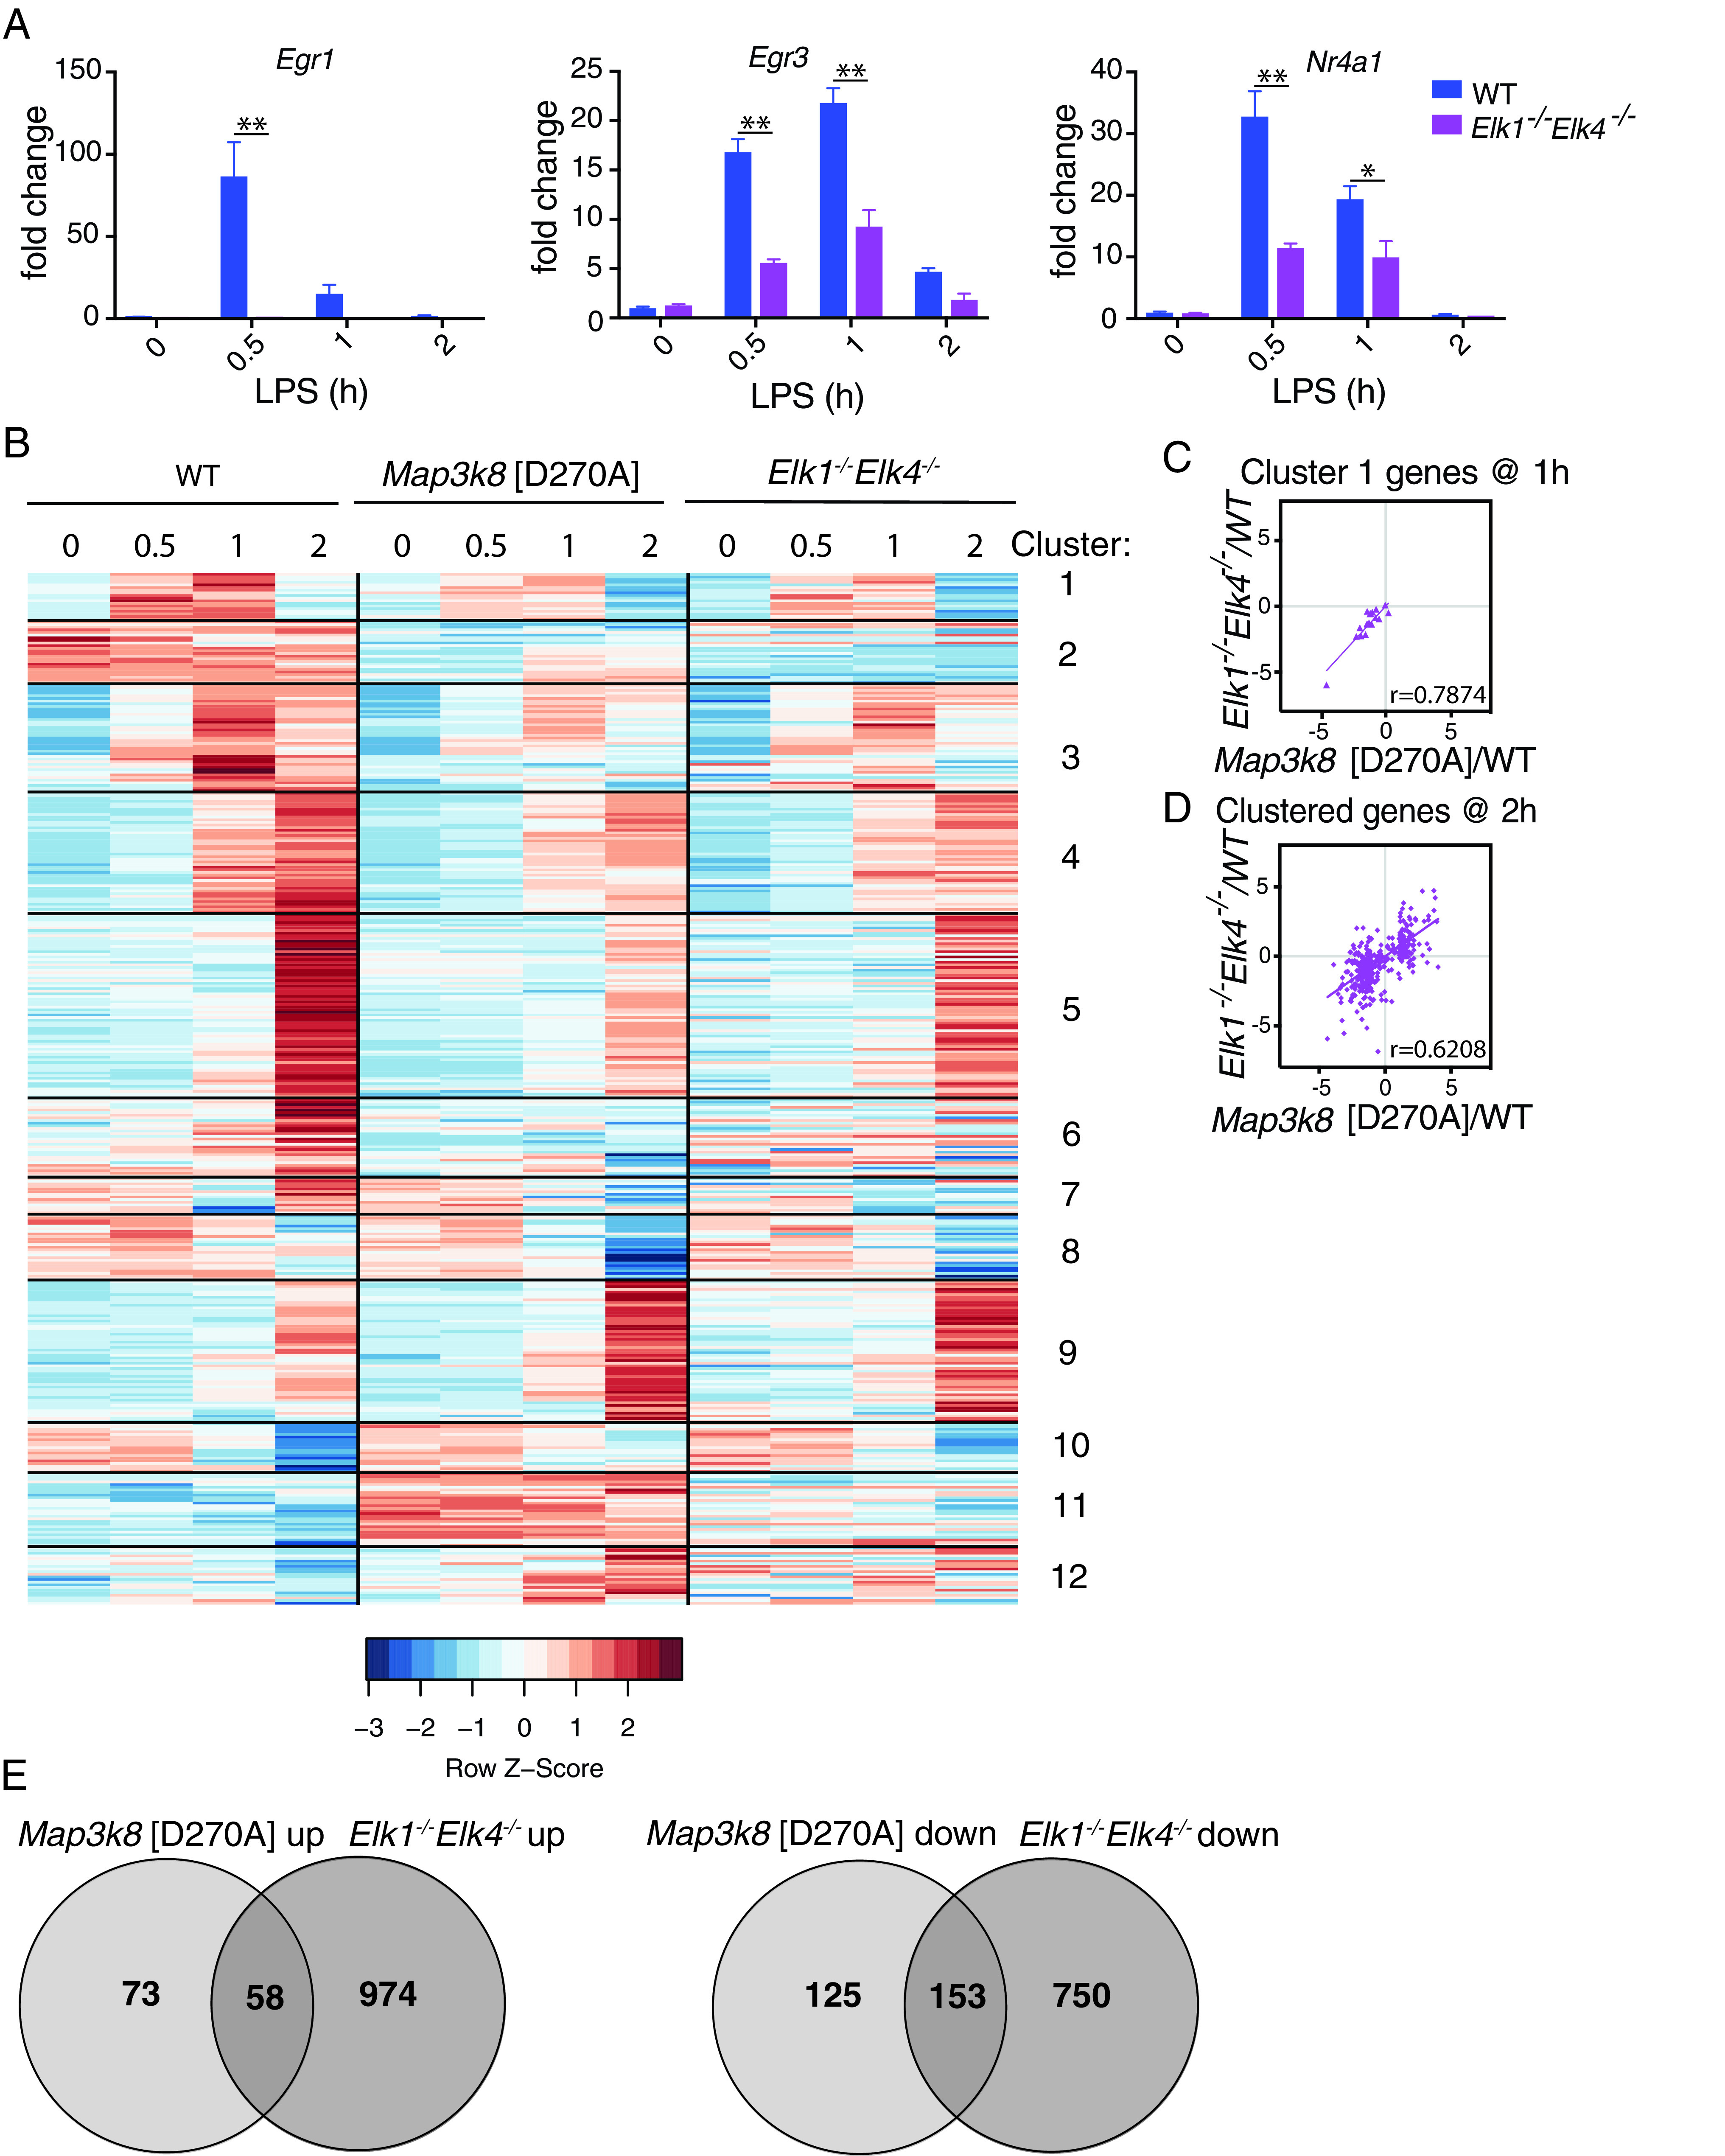
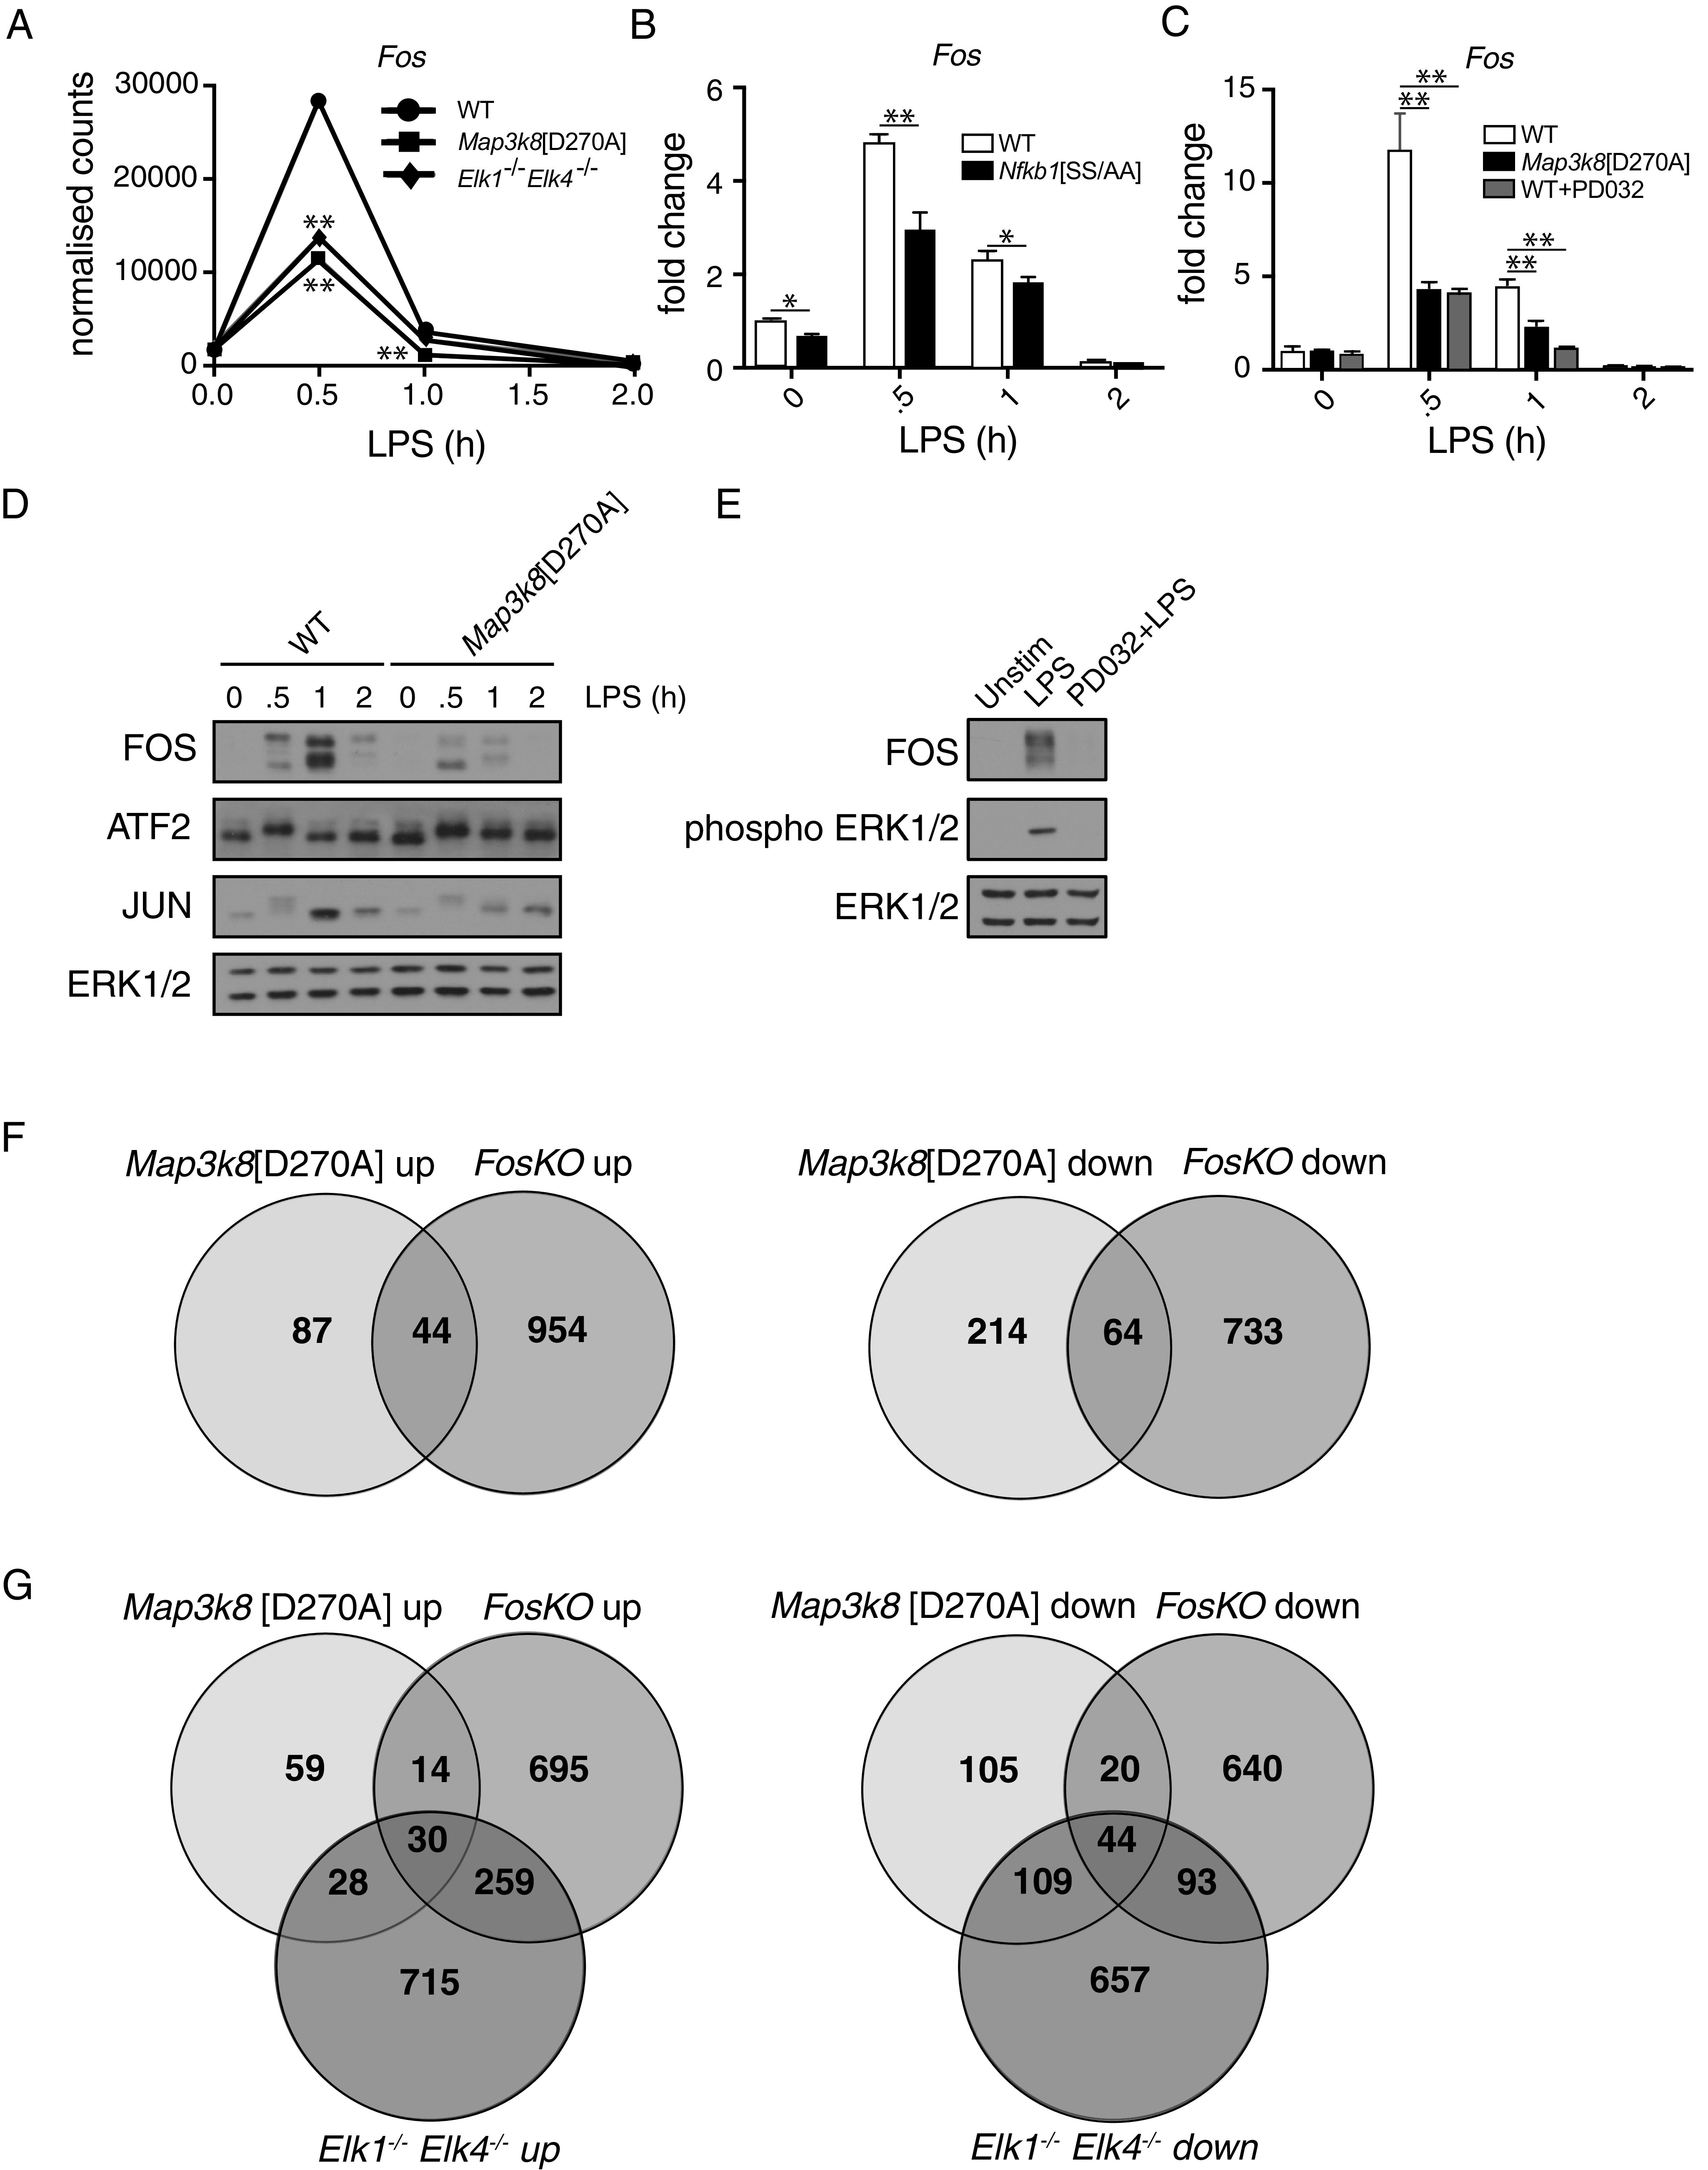
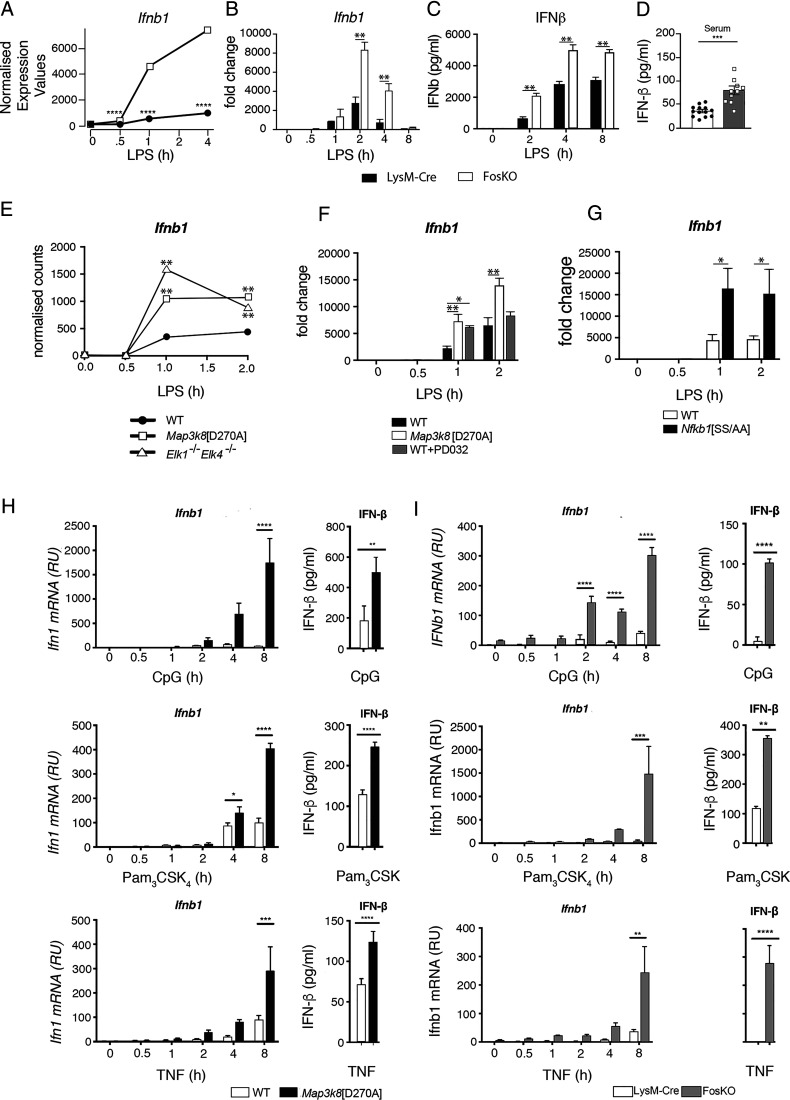
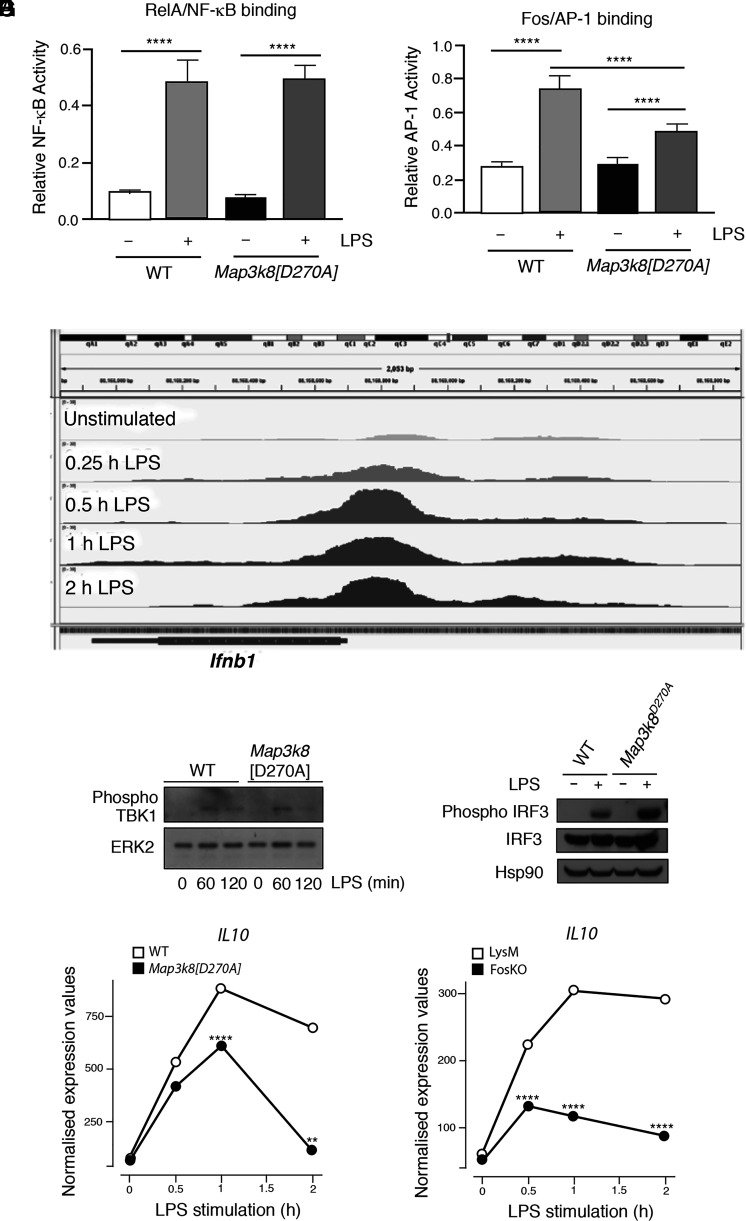
TPL-2 kinase plays an important role in innate immunity, activating ERK1/2 MAPKs in myeloid cells following TLR stimulation. We investigated how TPL-2 controls transcription in TLR4-stimulated mouse macrophages. TPL-2 activation of ERK1/2 regulated expression of genes encoding transcription factors, cytokines, chemokines, and signaling regulators. Bioinformatics analysis of gene clusters most rapidly induced by TPL-2 suggested that their transcription was mediated by the ternary complex factor (TCF) and FOS transcription factor families. Consistently, TPL-2 induced ERK1/2 phosphorylation of the ELK1 TCF and the expression of TCF target genes. Furthermore, transcriptomic analysis of TCF-deficient macrophages demonstrated that TCFs mediate approximately half of the transcriptional output of TPL-2 signaling, partially via induced expression of secondary transcription factors. TPL-2 signaling and TCFs were required for maximal TLR4-induced FOS expression. Comparative analysis of the transcriptome of TLR4-stimulated Fos -/- macrophages indicated that TPL-2 regulated a significant fraction of genes by controlling FOS expression levels. A key function of this ERK1/2-TCF-FOS pathway was to mediate TPL-2 suppression of type I IFN signaling, which is essential for host resistance against intracellular bacterial infection.


Conflict of interest statement

The authors have no financial conflicts of interest.

Figures

FIGURE 1.
FIGURE 1.
TPL-2 kinase activity induces and represses gene expression in LPS-stimulated macrophages. (A) Volcano plots of log2-transformed expression values and statistical significance of RNA-seq analyses of WT and Map3k8[D270A] macrophages stimulated with LPS for the indicated times. Genes significantly upregulated or downregulated (>2-fold change and false discovery rate < 0.05) are indicated by red or blue dots, respectively. (B) Log2-transformed normalized counts for WT and Map3k8[D270A] BMDMs for each cluster identified by k-means analysis. WT, blue; Map3k8[D270A], red. (C) Heatmap showing row-normalized expression for WT, Map3k8[D270A], Nfkb1[SS/AA], WT+PD0325901, and WT+RSKi47 macrophages for genes regulated by TPL-2 across a 1-h time course. Genes are presented in the clusters from the k-means analysis of TPL-2–regulated genes. (D) Log2 fold changes for Map3k8[D270A] compared with WT were taken for each gene in specific clusters and plotted against the equivalent fold changes of Nfkb1[SS/AA], WT+PD0325901, and WT+RSKi47 compared with WT. Each dot indicates a gene, solid lines indicate the linear regression, and r values were calculated using Spearman rank correlation.
FIGURE 2.
FIGURE 2.
TPL-2 regulates ELK1 phosphorylation and TCF target gene expression. (A) Genes in cluster 1 were analyzed for transcription factor enrichment using the MetaCore program. The top 15 enriched transcription factors are shown ranked by the ratio of observed sites to expected sites in the cluster 1 gene promoters. TCF family transcription factors, white; Fos family transcription factors, light gray. (B) WT and Map3k8[D270A] macrophages stimulated with LPS for 15 min. PD0325901 was added to the indicated WT cultures to block ERK1/2 activation. Total cell lysates were immunoblotted for the antigens shown. (C) WT and Nfkb1[SS/AA] macrophages stimulated with LPS for 15 min. Total cell lysates were immunoblotted for the indicated antigens. Experiments in (B) and (C) are representative of three similar experiments. (D) Normalized counts from the RNA-seq analysis of WT and Map3k8[D270A] macrophages unstimulated or stimulated with LPS for the indicated times are shown for Egr1, Egr3, and Nr4a1. (E) WT, Map3k8[D270A], and Nfkb1[SS/AA] macrophages stimulated with LPS during a 2-h time course. Egr1, Egr3, and Nr4a1 mRNA expression levels were analyzed by qRT-PCR. (F) WT, Map3k8[D270A], WT+PD0325901, and WT+RSKi47 macrophages stimulated with LPS during a 2-h time course. Egr1, Egr3, and Nr4a1 mRNA expression analyzed by qRT-PCR. Results in (E) and (F) are representative of three similar experiments. (G) WT and Map3k8[D270A] macrophages were stimulated with LPS for 30 min or left untreated. Chromatin immunoprecipitations (ChIPs) were performed with (G) POLII, (H) ELK1, and (I) SRF Abs. ChIP signals relative to input for TCF binding regions of the Egr1, Egr3, and Nr4a1 promoters are shown. Results from three separate experiments were combined. *p ≤ 0.05, **p ≤ 0.01.
FIGURE 3.
FIGURE 3.
TPL-2 regulates gene transcription via ELK1 and ELK4. (A) WT and Elk1−/−Elk4−/− macrophages were stimulated with LPS for a 2-h time course. Egr1, Egr3, and Nr4a1 mRNA levels were determined by qRT-PCR. Results are representative of three similar experiments. (B) Heatmap showing row-normalized expression for WT, Map3k8[D270A] (as in (Fig. 1A), and Elk1−/−Elk4−/− BMDMs for clustered genes regulated by TPL-2 during a 2-h time course. (C and D) Log2 fold changes for Map3k8[D270A]/WT for each gene in cluster 1 at 1 h (C) or all clustered genes at 2 h (D), plotted against the equivalent fold changes of Elk1−/−Elk4−/−/WT comparison. Each dot indicates a gene, solid lines indicate the linear regression, and r values were calculated using Spearman rank correlation. (E) Venn diagrams show overlaps of genes upregulated or downregulated (>2-fold) by Map3k8[D270A] mutation and ELK1/ELK4 deficiency, calculated from Map3k8[D270A]/WT and Elk1−/−Elk4−/−/WT RNA-seq comparisons. *p ≤ 0.05, **p ≤ 0.01.
FIGURE 4.
FIGURE 4.
TPL-2 controls LPS-induced gene expression via regulation of FOS abundance. (A) Normalized counts for Fos from the RNA-seq analyses of WT, Map3k8[D270A], and Elk1−/−Elk4−/− BMDMs stimulated with LPS for indicated times. *p ≤ 0.01. (B) WT and Nfkb1[SS/AA] BMDMs were stimulated with LPS during a 2-h time course. *p ≤ 0.01, **p ≤ 0.01. (C) WT BMDMs with and without PD0325901 and Map3k8[D270A] BMDMs were stimulated with LPS for the indicated times. In (B) and (C), Fos mRNA expression was analyzed by qRT-PCR. Results are representative of three similar experiments. **p ≤ 0.01. (D) WT and Map3k8[D270A] BMDMs were stimulated with LPS for indicated times. Total cell lysates were immunoblotted for antigens shown. (E) WT BMDMs with and without PD0325901 were stimulated with LPS for 30 min. Total cell lysates were immunoblotted for antigens shown. Results in (D) and (E) are representative of three similar experiments. (F) Venn diagrams to overlaps of genes upregulated or downregulated (>2-fold) by Map3k8[D270A] mutation and FOS deficiency, calculated from Map3k8[D270A]/WT and FosKO/LysM-Cre RNA-seq comparisons. (G) Venn diagram comparison of TPL-2-, TCF-, and FOS-regulated genes identified in RNA-seq experiments. Overlap of genes upregulated or downregulated by Map3k8D270A mutation, TCF deficiency, and FOS deficiency.
FIGURE 5.
FIGURE 5.
FOS represses LPS-induced expression of IFN-β. (A) Normalized counts for Ifnb1 from the RNA-seq analysis of FosKO and LysM-Cre BMDMs stimulated with LPS for the indicated times. ****p ≤ 0.0001. (B and C) FosKO and LysM-Cre BMDMs were stimulated with LPS during an 8-h time course. In (B), Ifnb1 mRNA expression was analyzed by qRT-PCR. In (C), secreted IFN-β in culture supernatants was assayed by ELISA. Results are representative of three similar experiments. **p ≤ 0.01. (D) FosKO and control LysM-Cre mice were injected i.p. with LPS. IFN-β in serum at 4 h was assayed by ELISA. Data are pooled from three independent experiments. Mean ± SEM. ***p < 0.001. One-way ANOVA. (E) Normalized counts for Ifnb1 from the RNA-seq analysis of WT, Map3k8[D270A], and Elk1−/−Elk4−/− BMDMs stimulated with LPS for indicated times. (F) WT BMDMs with and without PD0325901 and Map3k8[D270A] macrophages were stimulated with LPS for a 2-h time course. Ifnb1 expression was analyzed by qRT-PCR. (G) WT and Nfkb1[SS/AA] BMDMs were stimulated with LPS for the indicated times. Ifnb1 expression was analyzed by qRT-PCR. (H) WT and Map3k8[D270A] BMDMs were stimulated for the indicated times with CpG, Pam3CSK4, or TNF. Ifnb1 mRNA levels were determined by qRT-PCR (left graphs). IFN-β in culture supernatants after 24-h cultures was determined by ELISA (right graphs). (I) LysM-Cre control and FosKO BMDMs were stimulated for the indicated times with CpG, Pam3CSK4, or TNF. Ifnb1 mRNA levels were determined by qRT-PCR (left graphs). IFN-β in culture supernatants after 24-h cultures was determined by ELISA (right graphs). Results in (B)–(E) are representative of three similar experiments. For (E)–(I), *p ≤ 0.05, **p ≤ 0.01, ***p ≤ 0.001, ****p ≤ 0.0001.
FIGURE 6.
FIGURE 6.
TPL-2 regulation of Ifnb1 mRNA expression via multiple pathways. (A and B) WT and Map3k8[D270A] BMDMs were stimulated with LPS (30 min). Nuclear extracts were assayed by ELISA for RelA binding to NF-κB and FOS binding to AP-1. Mean of separate cultures from four biological replicates shown ± SEM. ****p < 0.0001. Two-way ANOVA. Representative of three experiments with similar results. (C) ChIP-seq data from Tong et al. (46) of FOS binding to Ifnb1 gene in BMDMs stimulated with LPS during a time course. The figure is an annotated screenshot of the Integrative Genomics Viewer output at the Ifnb1 gene location within the mm10 genome. (D and E) WT and Map3k8[D270A] BMDMs were stimulated with LPS at the indicated times in (D) and for 60 min in (E). Total lysates were immunoblotted for the indicated antigens. (F) Normalized counts from the RNA-seq analysis of WT and Map3k8[D270A] macrophages unstimulated or stimulated with LPS for the indicated times are shown Il10. **p ≤ 0.01, ****p ≤ 0.0001. (G) Normalized counts for Il10 from the RNA-seq analysis of FosKO and LysM-Cre BMDMs stimulated with LPS for the indicated times. ****p ≤ 0.0001.

References

    1. Medzhitov R., Horng T.. 2009. Transcriptional control of the inflammatory response. Nat. Rev. Immunol. 9: 692–703. - PubMed
    1. Kawai T., Akira S.. 2010. The role of pattern-recognition receptors in innate immunity: update on Toll-like receptors. Nat. Immunol. 11: 373–384. - PubMed
    1. Iwasaki A., Medzhitov R.. 2010. Regulation of adaptive immunity by the innate immune system. Science 327: 291–295. - PMC - PubMed
    1. Arthur J. S. C., Ley S. C.. 2013. Mitogen-activated protein kinases in innate immunity. Nat. Rev. Immunol. 13: 679–692. - PubMed
    1. Newton K., Dixit V. M.. 2012. Signaling in innate immunity and inflammation. Cold Spring Harb. Perspect. Biol. 4: a006049. - PMC - PubMed

Publication types

MeSH terms