. 2022 Jan 26;13(1):528.
doi: 10.1038/s41467-022-28172-4.

Neutrophil extracellular traps and their histones promote Th17 cell differentiation directly via TLR2

Affiliations

Neutrophil extracellular traps and their histones promote Th17 cell differentiation directly via TLR2

Alicia S Wilson et al. Nat Commun. .

Abstract

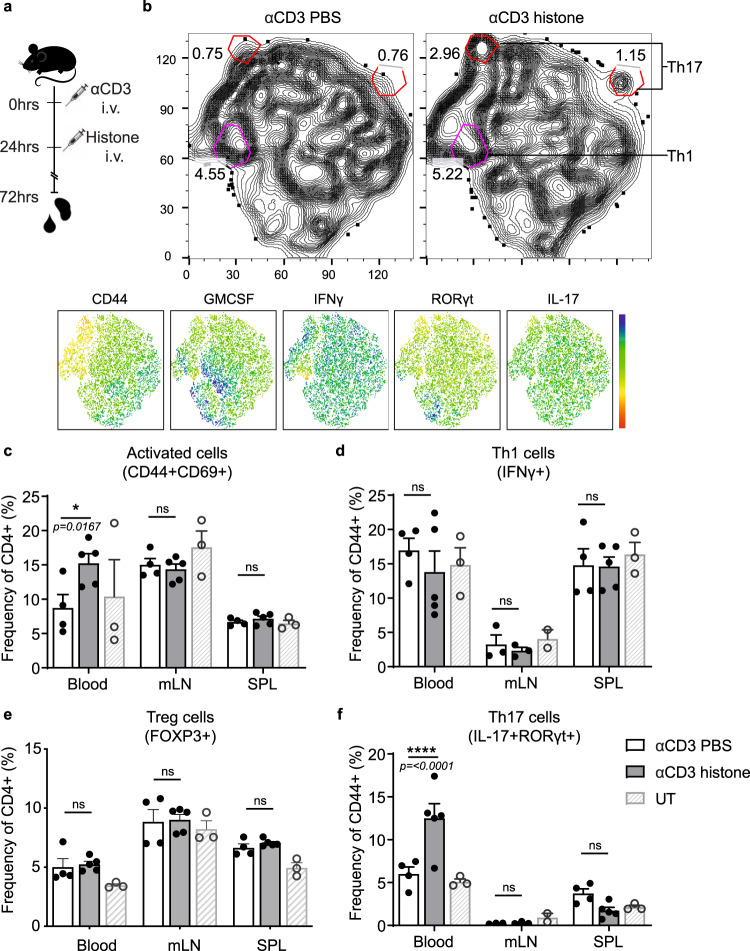
Neutrophils perform critical functions in the innate response to infection, including through the production of neutrophil extracellular traps (NETs) - web-like DNA structures which are extruded from neutrophils upon activation. Elevated levels of NETs have been linked to autoimmunity but this association is poorly understood. By contrast, IL-17 producing Th17 cells are a key player in various autoimmune diseases but are also crucial for immunity against fungal and bacterial infections. Here we show that NETs, through their protein component histones, directly activate T cells and specifically enhance Th17 cell differentiation. This modulatory role of neutrophils, NETs and their histones is mediated downstream of TLR2 in T cells, resulting in phosphorylation of STAT3. The innate stimulation of a specific adaptive immune cell subset provides an additional mechanism demonstrating a direct link between neutrophils, NETs and T cell autoimmunity.


Conflict of interest statement

Sirtex Medical Ltd has been involved in the commercialization of the histone inhibitor, mCBS, developed by CRP and covered by several patents on which CRP is an inventor. The authors declare no further competing interests.

Figures

Fig. 1
Fig. 1. Neutrophil extracellular traps (NETs) promote Th17 cell differentiation through histones.
a, b IL-17 and IFNγ expression by in vitro differentiated Th17 cells measured by flow cytometry after culture in the presence or absence of in vitro generated NETs n = 3. c Normalized IL-17 production by Th17 cells differentiated in the presence of NETs in MCDB media or MCDB media alone with the addition of histone inhibitor mCBS. d, e IL-17 and IFNγ expression by in vitro differentiated Th17 cells cultured with a low concentration of histones (0–20 µg/mL) n = 3. f Normalized IL-17 production of Th17 cells differentiated with histones with the addition of histone inhibitor mCBS n = 3. Data bars show mean ± SEM. “ns” (not significant), p > 0.05; “*”p < 0.05; “**”p < 0.01. b Paired two-tailed t-test, c, f two-way ANOVA with Sidak’s multiple comparisons test, e one-way ANOVA with Tukey’s multiple comparisons test. Data points represent individual mice. All data are representative of a minimum of two independent experiments. Source data are provided as a Source Data file.
Fig. 2
Fig. 2. Histone induction of Th17 cell response is conserved in vivo.
a Histones were injected intravenously 24 h after injection of low dose αCD3 and 48 h later blood and lymphoid organs were analyzed. b TsNE analysis of flow cytometric data of CD4+ T cells with clustering based on the production of cytokines and expression of CD44. Th17 cell populations (top red circles) and Th1 cell populations (bottom pink circle) are highlighted. Quantification of c activated CD4+ T cells, d Th1, e Treg, and f Th17 cells based on conventional gating of flow cytometry data was also performed. Data bars show mean ± SEM. “ns” (not significant), p > 0.05; “*”p < 0.05; “****”p < 0.0001. ce Two-way ANOVA with Dunnett’s multiple comparisons test. Data points represent individual mice. All data are representative of a minimum of two independent experiments. Source data are provided as a Source Data file.
Fig. 3
Fig. 3. Histones induce a Th17 cell-specific response.
a Mean expression levels of T cell activation markers after 16 h co-culture with 0–10 µg/mL histone in the presence or absence (±) of αCD28 measured by flow cytometry n = 5. gMFI of each marker was normalized to the mean of no αCD28, 0 µg/mL condition and heat map created from the mean of the normalized values. b Differentiation of mouse naive T cells into Th1, Th17, and Treg cells in the presence of histones was measured by flow cytometric quantification of the expression of key factors IFNγ, IL-17 and FOXP3 from total live cells. c Graphical representation of b at various concentrations of histones with expression levels normalized to expression levels in the absence of histones; Th17 10 µg/mL histones n = 3, all others n = 4. d, e Frequency of cells expressing RORγt and f relative total RORγt expression at 32 h (calculated from the geometric mean) measured by flow cytometry n = 9. g, h Differentiation of mouse naive T cells into “pathogenic” Th17 cells with the addition of IL-23 in the presence of histones measured by flow cytometric quantification of IL-17 and GM-CSF after 5 days of culture n = 3. i Relative gene expression (fold-change) of histone-treated non-pathogenic (left) and pathogenic Th17 cells ± TGFβ after 3 days of differentiation compared to H2O-treated controls. Hprt expression was used as a housekeeping control n = 3. c, e, f, h Data bars show mean ± SEM. or i range and distribution, p > 0.05; “*”p < 0.05; “**”p < 0.01; “***”p < 0.001; “****”p < 0.0001. Where significance is not indicated, differences were ns. a, c Two-way ANOVA with Tukey’s multiple comparisons test, e, f, h paired student’s two-tailed t-test, i one-sample t-test (performed on ΔΔCt values). Data points represent individual mice. All data are representative of a minimum of two independent experiments. Source data are provided as a Source Data file.
Fig. 4
Fig. 4. Histone-induced promotion of Th17 cell differentiation is conserved in humans.
Differentiation of human a Th17 cells and b Th1 cells under differentiating conditions in the presence or absence of histones for 6 days was measured by IL-17 and IFNγ production by flow cytometry. Key cytokine production of each subset was normalized to the 0 µg/mL histone condition for each donor n(a) = 6, n(b) = 3. c Proliferation of Th17 cell cultures in the presence or absence of histones was measured by dilution of CTV using flow cytometry and d peaks indicating cell divisions quantified n = 3. Data bars show mean ± SEM. “ns” (not significant), p > 0.05; “*”p < 0.05; “**”p < 0.01. a, b Paired two-tailed t-test d two-tailed t-test with Holm–Sidak correction. Data points represent individual donors with data pooled from multiple independent experiments. Source data are provided as a Source Data file.
Fig. 5
Fig. 5. Histone-induced Th17 cell differentiation is dependent on MyD88 and TLR2.
a Flow cytometric analysis and b quantification of relative IL-17 production in response to histone treatment of MyD88−/− and WT T cells from littermate mice n(WT) = 6, n(MyD88−/−) = 5. c Flow cytometry plots and d quantified fold-change in IL-17 expressing cells after addition of histones, TLR2 and TLR4 agonists (PAM3CSK4 and PHAD, respectively) to Th17 cell differentiation cultures of naive T cells from Tlr4−/− and Tlr2−/− mice n(WT) = 6, n(Tlr4−/−) = 3, n(Tlr2−/−) = 5. e Fold-change in IL-17 production of differentiated Th17 cell cells in response to co-incubation with NETs in TLR2 KO mice n(WT) = 8, n(Tlr2−/−) = 4. f Relative IL-17 expression after Th17 cell differentiation in the presence of PAM3CSK4 or histones in the presence or absence of histone inhibitor mCBS. g CD4+ T cells isolated from Tlr2+/+ and Tlr2−/− mice were injected in C57Bl/6 CD45.1 congenic recipient mice 48 h before low dose αCD3 and 72 h before intravenous histone injections. CD45.2 congenic transferred cells were analyzed 48 h after histone injection for CD44 expression n = 3. Data bars show mean ± SEM. “ns” (not significant), p > 0.05; “*”p < 0.05; “**”p < 0.01; “***”p < 0.001; “****”p < 0.0001. Where significance is not indicated, differences were ns. b, e, f, g Two-way ANOVA with Sidak’s correction, d mixed-effects model (REML). Normalized data are shown to allow pooling of experimental data, with all data representative of a minimum of two independent experiments. Data points represent individual mice. Source data are provided as a Source Data file.
Fig. 6
Fig. 6. Histones induce rapid phosphorylation of STAT3 in a MyD88-, TLR2-dependent manner.
a Histogram showing the geometric mean of fluorescence intensity (gMFI) and b quantification of the change in (Δ) the gMFI of tyrosine 705 phosphorylation of STAT3 (pSTAT3) after 5 min incubation with histones (10 µg/mL, gray line) or IL-6 (black line) compared to controls (dashed black line) n = 3. c Relative gMFI of pSTAT3 compared to matched 0 µg/mL control over time, n = 4–6 mice per time point. d Phosphorylation of STAT3 and STAT6 after 5 min of stimulation analyzed by imaging flow cytometry with images shown representative of the mean pSTAT3 fluorescence intensity after stimulation. e Relative gMFI of treated cells from Myd88−/− and Tlr2−/− mice after 5 min n(WT) = 8, n(My88−/−, Tlr2−/−) = 3. Data bars show mean ± SEM. “ns” (not significant), p > 0.05; “*/#p < 0.05; “**”p < 0.01; “###p < 0.001; “####p < 0.0001. Where significance is not indicated, differences were ns. b One-way ANOVA with Dunnett’s multiple comparisons test, c mixed-effects model (REML) (where * denotes differences between 10 and 0 µg/mL controls, # denotes significance between IL-6 and 0 µg controls), e two-way ANOVA with Dunnet’s multiple comparisons test. All data are representative of a minimum of two independent experiments. Source data are provided as a Source Data file.

References

    1. Brinkmann V, et al. Neutrophil extracellular traps kill bacteria. Science. 2004;303:1532–1535. - PubMed
    1. Kaplan MJ, Radic M. Neutrophil extracellular traps: double-edged swords of innate immunity. J. Immunol. 2012;189:2689–2695. - PMC - PubMed
    1. Khandpur R, et al. NETs are a source of citrullinated autoantigens and stimulate inflammatory responses in rheumatoid arthritis. Sci. Transl. Med. 2013;5:178ra40. - PMC - PubMed
    1. Urban CF, et al. Neutrophil extracellular traps contain calprotectin, a cytosolic protein complex involved in host defense against Candida albicans. PLoS Pathog. 2009;5:e1000639. - PMC - PubMed
    1. Marsman G, Zeerleder S, Luken BM. Extracellular histones, cell-free DNA, or nucleosomes: differences in immunostimulation. Cell Death Dis. 2016;7:e2518. - PMC - PubMed

Publication types

LinkOut - more resources