. 2022 Jan 26;13(1):512.
doi: 10.1038/s41467-021-27874-5.

Microskeletal stiffness promotes aortic aneurysm by sustaining pathological vascular smooth muscle cell mechanosensation via Piezo1

Affiliations

Microskeletal stiffness promotes aortic aneurysm by sustaining pathological vascular smooth muscle cell mechanosensation via Piezo1

Weiyi Qian et al. Nat Commun. .

Abstract

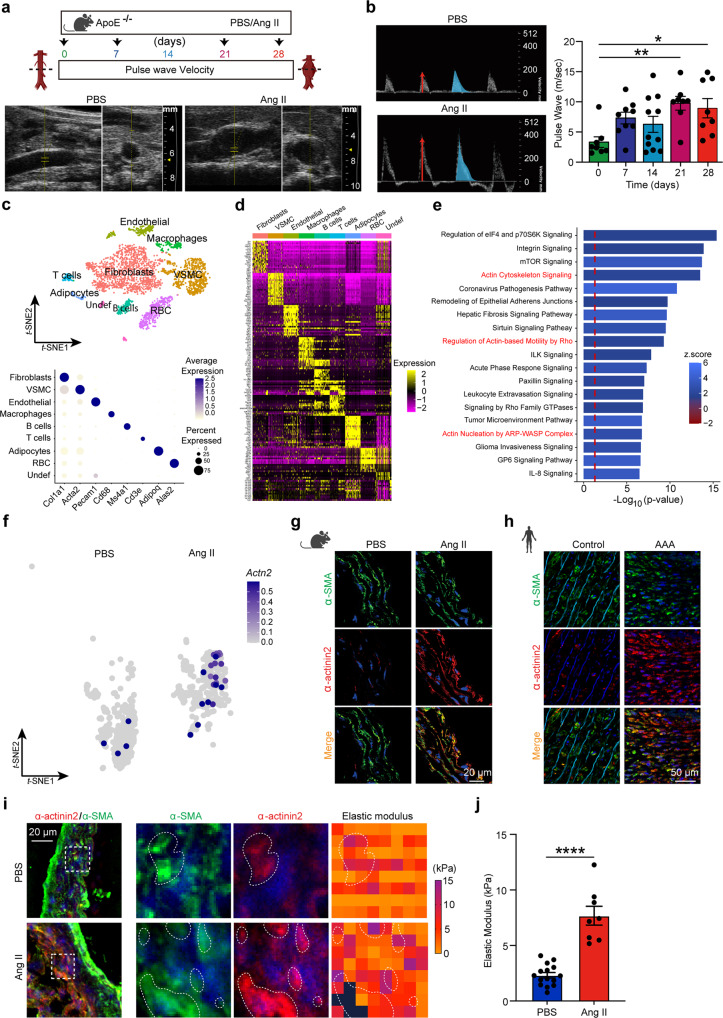
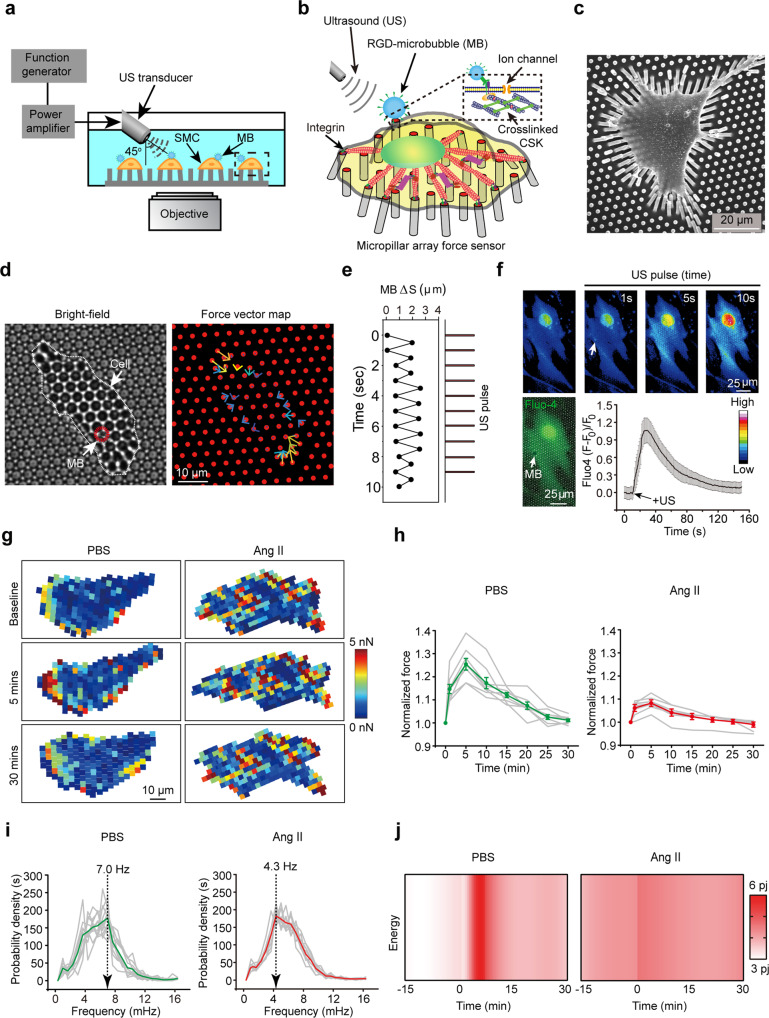
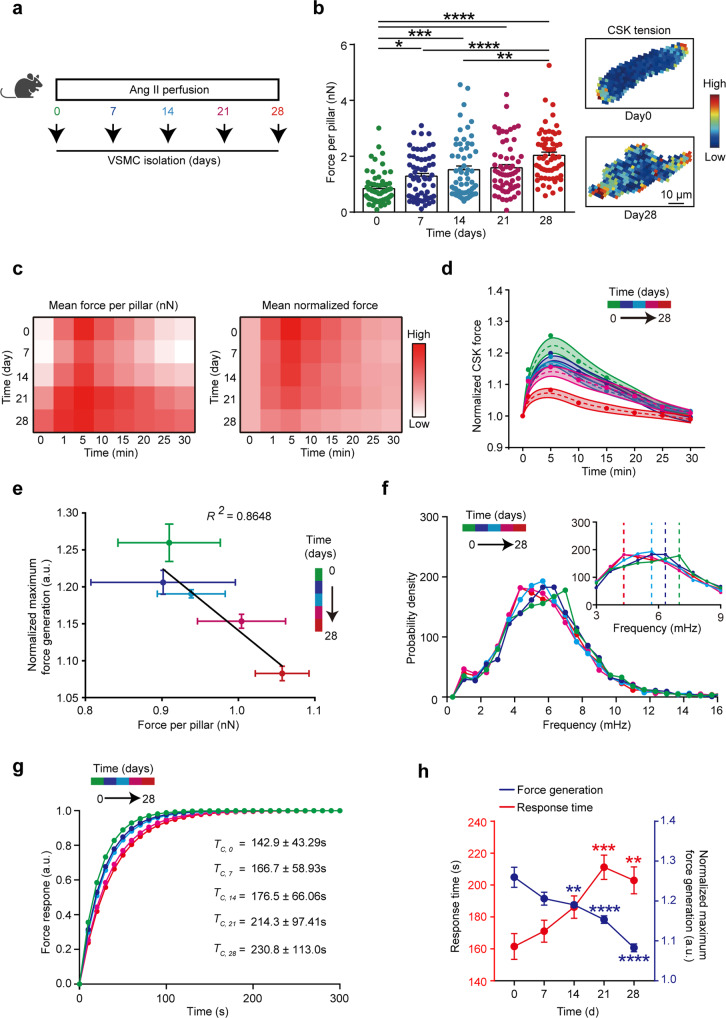
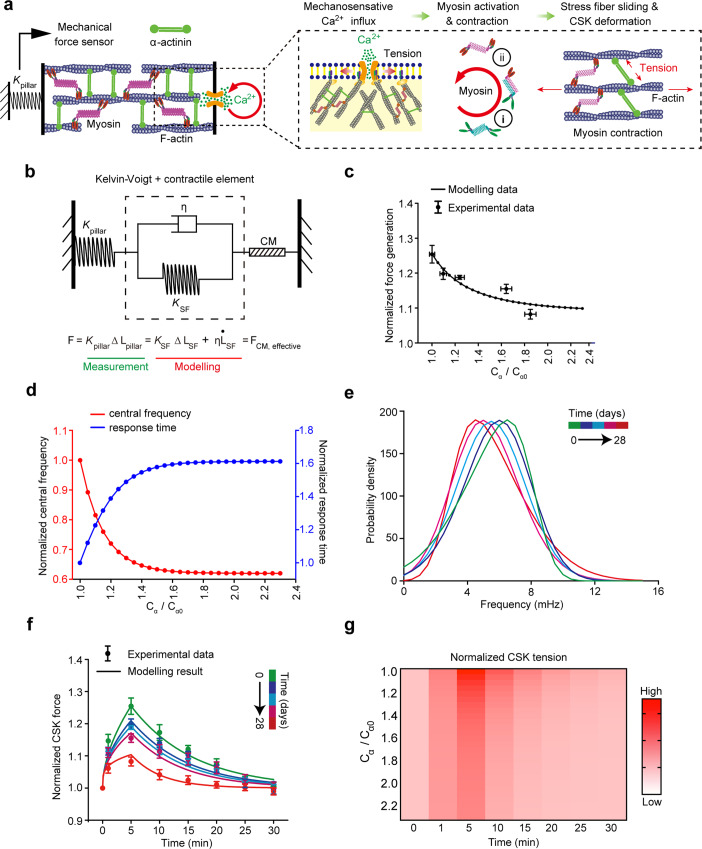
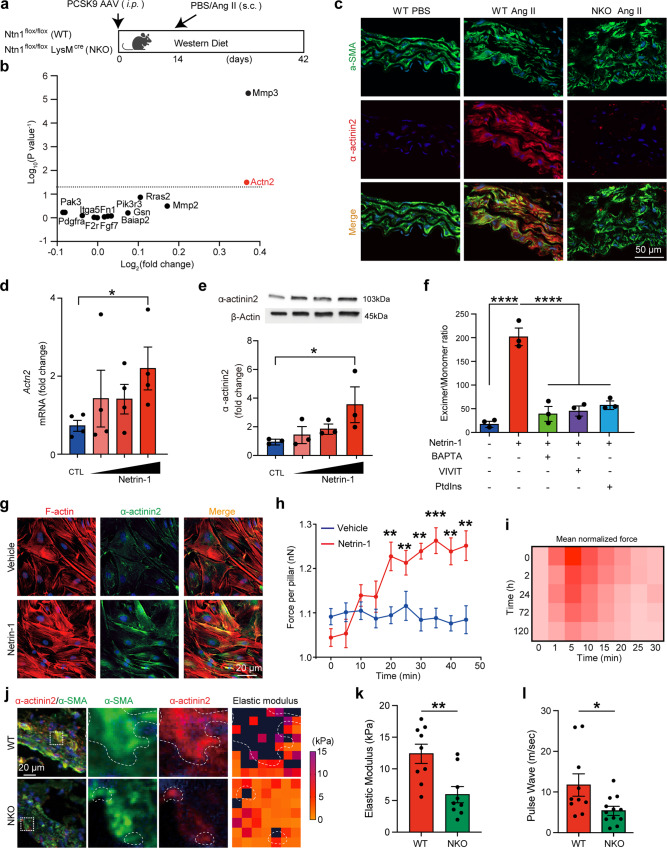
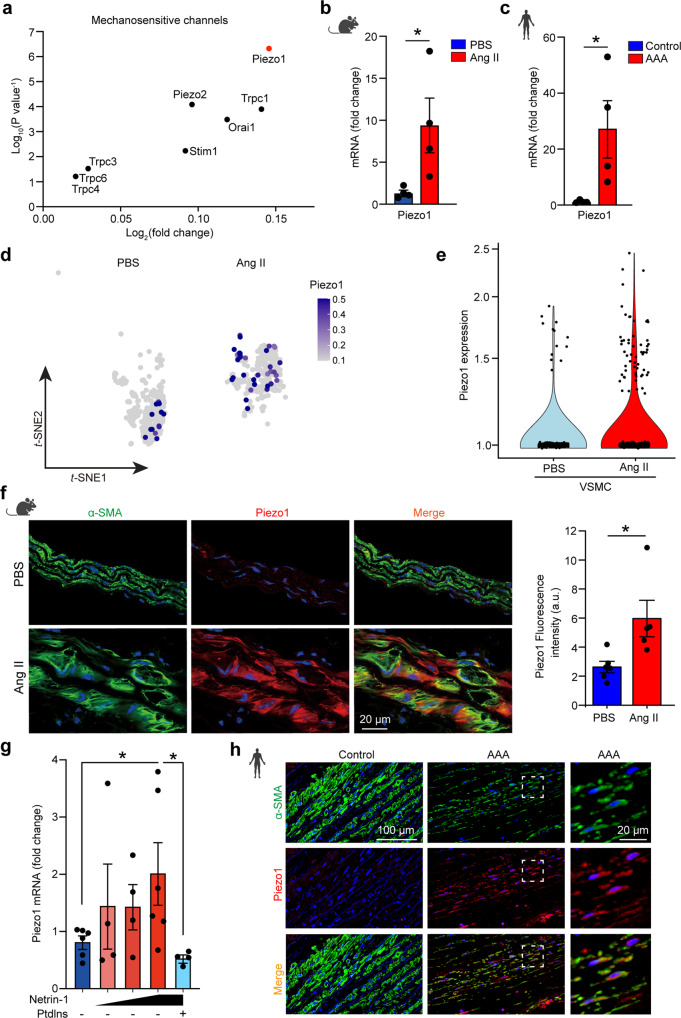
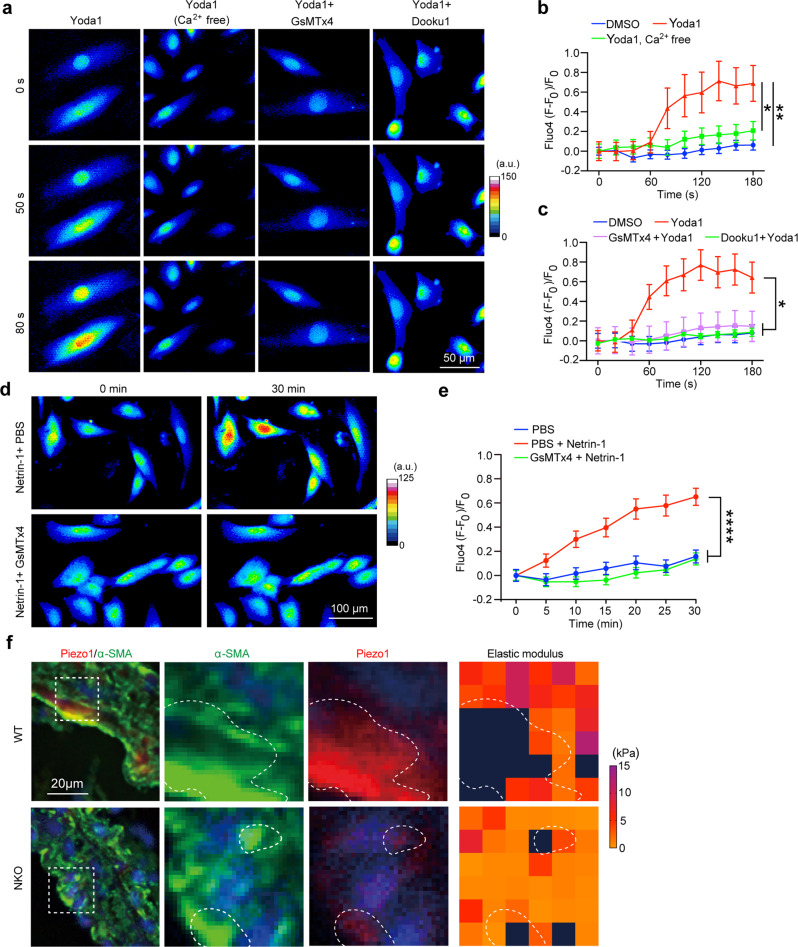
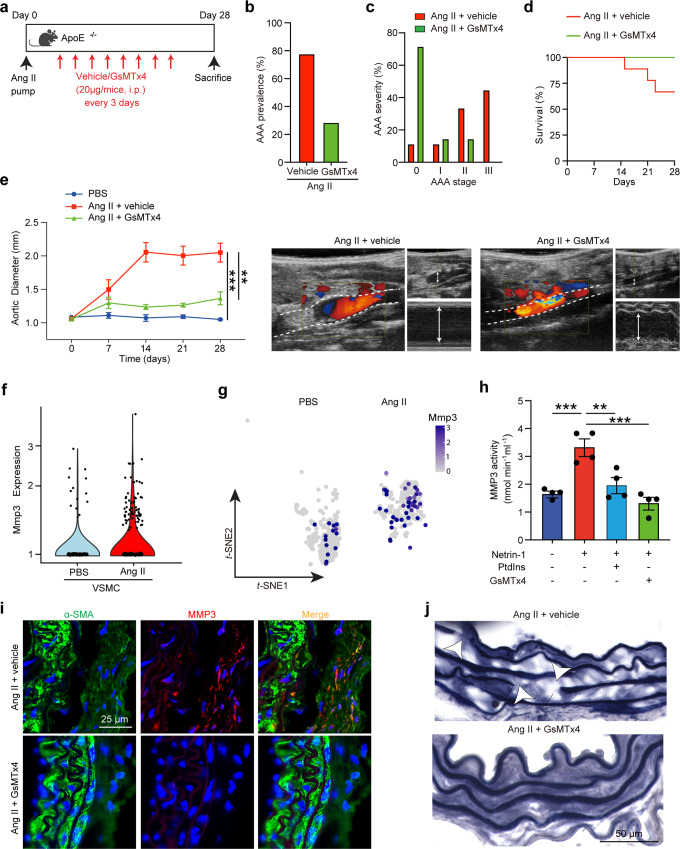
Mechanical overload of the vascular wall is a pathological hallmark of life-threatening abdominal aortic aneurysms (AAA). However, how this mechanical stress resonates at the unicellular level of vascular smooth muscle cells (VSMC) is undefined. Here we show defective mechano-phenotype signatures of VSMC in AAA measured with ultrasound tweezers-based micromechanical system and single-cell RNA sequencing technique. Theoretical modelling predicts that cytoskeleton alterations fuel cell membrane tension of VSMC, thereby modulating their mechanoallostatic responses which are validated by live micromechanical measurements. Mechanistically, VSMC gradually adopt a mechanically solid-like state by upregulating cytoskeleton crosslinker, α-actinin2, in the presence of AAA-promoting signal, Netrin-1, thereby directly powering the activity of mechanosensory ion channel Piezo1. Inhibition of Piezo1 prevents mice from developing AAA by alleviating pathological vascular remodeling. Our findings demonstrate that deviations of mechanosensation behaviors of VSMC is detrimental for AAA and identifies Piezo1 as a novel culprit of mechanically fatigued aorta in AAA.


Conflict of interest statement

The authors declare no competing interests.

Figures

Fig. 1
Fig. 1. Increased CSK crosslinking in VSMC of the stiffened aortic tissue in AAA.
a Schematic representation of experimental protocol of PBS (control) or Angiotensin II (Ang II) in mice with timeline of pulse wave velocity (PWV) measurements. b Representative images of ultrasonography 2D scan images of peak systolic velocity (red arrow), global pulse wave curve (blue curve), and PWV quantification of mice exposed to Ang II for days as indicated. n = 8 mice for day 0, n = 9 for day 7, n = 11 for day 14, n = 8 for day 21, and n = 8 for day 28. One-way ANOVA followed by Dunnett’s multiple comparisons test. *P = 0.0136 and **P = 0.0041. Data are presented as mean values ± SEM. c t-distributed stochastic neighbor embedding (t-SNE) plot of single-cell RNA-sequencing of mice aortas (n = 4–5 per group). Cell clusters are annotated, top panel. Dot plot representation showing average expression and percentage of expression in the cluster of the markers used for cluster identification, lower panel. VSMC vascular smooth muscle cells, RBC red blood cells. d Heatmap of top differentially expressed transcripts of each cell clusters. e Pathway analysis of differentially expressed genes in AngII vs PBS VSMC. f t-SNE distribution of Actn2 mRNA (log2 expression) within the VSMC cluster and across conditions, as indicated. g, h Immunofluorescence (IF) staining of α-actinin2 (red) and α-SMA (green) in murine (g) and human (h). i Representative IF merged image of α-SMA (green) and α-actinin2 (red) in aortic section of mice (left panel, dashed box shows area of atomic force microscopy (AFM) measurement) and heatmap representation of elastic modulus captured by AFM (right panel, dotted lines demark regions enriched in α-actinin2 with maximum force). Nuclei are stained with DAPI (blue) in all IF images. j Quantification of the elastic modulus of aortic sections as indicated. n = 15 square regions in at least three aortic sections for PBS and n = 8 square regions in at least three aortic sections for Ang II. Two-sided unpaired t-test. ****P < 0.0001. Data are presented as mean values ± SEM. Tissue sections in g, h, and i were transversal sections. Mouse, human, and aorta icons in a, g, and h are created with BioRender.com. Source data are provided as a Source Data file.
Fig. 2
Fig. 2. Defective mechanosensation of VSMC in AAA.
a A schematic showing the integrated micromechanical system by using ultrasound (US) excitation of microbubbles (MB) attached via RGD-integrin binding to the membrane of VSMC seeded on the PDMS micropillar array. b Diagram illustrating micropillar-based mechanical force sensor and ultrasound tweezer system in single cell. c Representative scanning electron microscopy (SEM) image of single VSMC seeded on PDMS micropillars. d Representative microscopy images of bright field (left panel) and red channel showing micropillars (right panel). VSMC is delineated by white dotted line, microbubble (MB) is delineated by red dotted circle blue and yellow arrows represent force vector. e Relative microbubble movement in response to 10-s, 1 Hz transient ultrasound stimulation. f Representative microscopy images of green channel showing Fluo-4 Ca2+ probe and quantification of Ca2+ influx in response to US stimulation. n= 13 cells. Data are presented as mean ± SEM. g Representative heatmap representation of baseline micropillar traction force or in response to US stimulation (5 and 30 min) of single VSMC isolated from PBS or Ang II treated mice. h, i Normalized global traction force (h) and mean frequency (i) of VSMC response to ultrasound stimulation. The frequency responses in i represent VSMC force dynamics from 0 to 5 min. In h, data are presented as mean ± SEM (green and red curves), individual values are shown in gray. n = 8 cells per group. In i, data are presented as mean (green and red curves) and individual values are shown in gray. n = 12 cells for PBS and n = 9 cells for Ang II. P value was calculated using Kolmogorov–Smirnov (KS) test. P = 0.010364. j Representative temporal heatmap of consumed energy in VSMC isolated from PBS or Ang II treated mice in response to ultrasound stimulation. Source data are provided as a Source Data file.
Fig. 3
Fig. 3. Temporal evolution of VSMC mechanosensation during AAA.
a Schematic of experimental protocol for VSMC isolation. b Quantification and representative heatmaps (day 0 and 28) of mean basal tension per pillar in VSMC extracted from aorta at timepoint indicated. n = 63 cells for day 0, n = 63 for day 7, n = 62 for day 14, n = 61 for day 21, and n = 61 for day 28. Kruskal–Wallis test followed by Dunn’s multiple comparisons test. *P = 0.0151, **P = 0.0043, ***P = 0.0002, ****P < 0.0001. Data are presented as mean values ± SEM. c Heat maps of temporal evolution of mean force per pillar (left) and mean normalized tension (right) of VSMC over time during instantaneous mechanosensation. d Temporal profiles for each time point (color coded as in a) of normalized CSK tension per pillar of VSMC in response to 10-s mechanical stress. n = 8 cell per group, data are presented as mean value ± SEM. e Correlation analysis of VSMC progressive basal CSK tension in AAA and maximum force generation in instantaneous mechanosensation. n = 8 cells per group. Data are presented as mean values ± SEM. f, g Instantaneous frequency distribution (f) and characteristic curves for deriving response time (g) of VSMC instantaneous mechanosensation. In f and g, each curve represents the mean value. Kolmogorov–Smirnov (KS) test was performed to determine the significant decrease of frequency distribution and force response between VSMC extracted from control aorta and aorta exposed to Ang II for 28 days, P = 0.010364. h Force generation ability (blue) and response time (red) of VSMC extracted from aorta exposed to Ang II at time points as indicated by color code. For force generation, n = 8 cells per group. One-way ANOVA followed by Dunnett’s multiple comparisons test. **P = 0.0086, ****P < 0.0001; For response time, n = 12 cells for day 0, n = 6 for day 7, n = 8 for day 14, n = 10 for day 21, and n = 9 for day 28. Kruskal–Wallis test followed by Dunn’s multiple comparisons test. **P = 0.0049, ***P = 0.0004. Data are presented as mean values ± SEM. a.u., arbitrary unit. Mouse icon in a is created with BioRender.com. Source data are provided as a Source Data file.
Fig. 4
Fig. 4. Theoretical modeling of VSMC defective mechanosensation in AAA.
a Illustration of the theoretical modeling of VSMC mechanosensation involving three key mechanisms: mechanosensitive Ca2+ flux, two-step myosin motor activation and contraction, and stress fiber sliding and CSK deformation. b Schematic of VSMC mechanosenstion modeled by Kelvin-Voigt element, with a viscoelastic material consisting of elastic stress fiber (SF) with an elastic modulus of KSF and a viscous component with viscosity of η, connected in series to the contractile myosin element (CM). c Force generation ability for VSMC with different expression of α-actinin2 (Cα/Cα0) in response to ultrasound tweezer stimulus. Experimental data of maximum force generation in c is adapted from Fig. 3h. Experimental data of (Cα/Cα0) in c is adapted from Supplementary Fig. 5a. d Predicted response time (d, blue) and normalized instantaneous central frequency (d, red) of VMSC mechanosensation with the increase of α-actinin2 (Cα/Cα0). e Theoretical prediction of instantaneous frequency distributions of VSMC instataneous mechanosensation. f Alignment of theoretical prediction (solid curves) and experimental measurements (dots with error bar) of force generation dynamics of VSMC instantaneous mechanosensation. Experimental data of force generation in f is adapted from Fig. 3d. g Summary heat map of the predicted force generation dynamics of VSMC with different expressions of α-actinin2. Source data are provided as a Source Data file.
Fig. 5
Fig. 5. Netrin-1 regulates VSMC CSK crosslinking and mechanosensation via α-actinin2.
a Schematic representation of AAA in vivo protocol. b Dot plot representation of differentially expressed mRNAs associated with CSK regulation in control (WT) or conditional deficiency of Netrin-1 (NKO) aorta. n = 4 per group. c Immunofluorescence (IF) staining of α-actinin2 (red) and α-SMA (green) in aortic sections of WT and NKO mice treated as indicated. d Quantitative- RT-PCR (qPCR) analysis of Actn2 mRNA. n = 4 independent experiments per group. One-way ANOVA followed by uncorrected Fisher’s LSD test. *P = 0.034. Data are represented as mean values ± SEM. e Immunoblot of α-actinin2 and β-actin expression in VSMC stimulated with recombinant Netrin-1 (0.625, 1.25, or 2.5 µg/ml) and quantification of bands. n = 3 independent experiments per gruop. One-way ANOVA followed by Dunnett’s multiple comparisons test. *P = 0.0383. Data are represented as mean values ± SEM. f Membrane fluidity of VSMC treated with Netrin-1 in conditions as indicated. n = 3 independent experiments per group. One-way ANOVA followed by Turkey’s multiple comparisons test. ****P < 0.0001. Data are represented as mean values ± SEM. g Representative IF images of α-actinin2 (green) and F-actin (red) in VSMC stimulated with Netrin-1 for 24 h. n = 10 per group. h Force per pillar measurements at indicated time of VSMC stimulated with Netrin-1 or with PBS. n = 9 cells for PBS and n = 7 for Netrin-1 from three independent experiments. One-way ANOVA followed by Turkey’s multiple comparisons test. **P = 0.0027 and 0.0033 for t = 20 and 25 mins respectively; ***P = 0.0006, 0.0007, and 0.0002 for t = 30, 40, and 45 mins, respectively; ****P < 0.0001 for t = 35 mins. Data are represented as mean values ± SEM. i Heatmap profiles of force generation in instantaneous mechanosensation of VSMC stimulated with Netrin-1 for the indicated time. j IF staining of α-SMA (green) and α-actinin2 (red) of aortic sections from WT or NKO mice treated with Ang II. Dashed boxes show magnified areas of staining and of AFM depicted by heatmap of elastic modulus magnitudes (dotted lines show regions of enriched staining and force). k Quantification of elastic modulus of WT and NKO aortas isolated from mice perfused with Ang II. n = 9 square regions in at least 3 aortic sections for both WT and NKO. Two-sided unpaired t-test. **P = 0.0038. Data are represented as mean values ± SEM. l Aortic pulse wave velocity quantification of WT or NKO mice perfused with Ang II. n = 10 mice for WT and n = 12 for NKO. Two-sided Mann–Whitney test. *P = 0.03. Data are represented as mean values ± SEM. Nuclei are stained with DAPI (blue) in all IF images. Tissue sections in c and j were transversal sections. Mouse icon in a is created with BioRender.com. Source data are provided as a Source Data file.
Fig. 6
Fig. 6. Mechanosensitive ion channel Piezo1 is increased in VSMC in AAA.
a Dotplot representation showing differential expression (log2) and P value of mechanosensitive channel transcripts in AAA. Quantitative-RT-PCR (qPCR) analysis of Piezo1 mRNA levels in mice (b) or human aortic specimens (c). n = 4 mice for b and n = 4 human aortic specimens for c. Two-sided Mann–Whitney test. *P = 0.0286 for both b and c. Data are represented as mean values ± SEM. d Piezo1 mRNA expression in VSMC cluster in scRNAseq dataset and violin plot representation of Piezo1 expression (e); n = 4 per group. f Representative IF microscopy image of Piezo1 (red) and α-SMA (green) staining in aorta of mice and quantification. a.u., arbitrary unit. n = 6 mice aortic specimens for PBS and 5 for Ang II. Two-sided Mann–Whitney test. **P = 0.0087. Data are represented as mean values ± SEM. g qPCR analysis of Piezo1 mRNA in VSMC stimulated with Netrin-1 (0.3, 0.625, or 1.25 µg/ml) or vehicle with or without PtdIns-(3,4,5)-P3 (25 µM) as indicated. n = 6, 4, 4, 6, 4 independent experiments, respectively. One-way ANOVA followed by uncorrected Fisher’s LSD test. *P = 0.0393 and 0.024, respectively. Data are represented as mean values ± SEM. h Representative IF microscopy images of Piezo1 (red) and α-SMA (green) in control and AAA aorta of human origin. Enlarged images of the boxed area with dashed lines in AAA aortic sections are shown in the right panel. n = 3 human aortic specimans per group. Nuclei are stained with DAPI (blue) in all IF images. Tissue sections in f and h were transversal sections. Mouse and human icons in b, c, f, and h are created with BioRender.com. Source data are provided as a Source Data file.
Fig. 7
Fig. 7. Netrin-1 regulates intracellular Ca2+ influx via Piezo1 in VSMC.
a Representative images of intracellular Ca2+ signal in VSMC treated with reagents and time period as indicated. The signal intensity scale is indicated on the right. a.u., arbitrary unit. b, c Time course quantification of Ca2+ flux in VSMC treated as indicated. For b, n = 5, 8, and 5 independent measurements for DMSO, Yoda1 Ca2+ free, and Yoda1, respectively. One-way ANOVA followed by uncorrected Fisher’s LSD test. *P = 0.025 and **P = 0.0082. For c, n = 5, 5, 8, and 11 independent measurements for DMSO, Yoda1, GsMTx4 +Yoda1, and Dooku1 + Yoda1, respectively. One-way ANOVA followed by Turkey’s multiple comparisons test. *P = 0.0191 (DMSO vs Yoda1), *P = 0.0230 (Yoda1 vs GsMTx4 +Yoda1), and *P = 0.0321 (Yoda1 vs Dooku1 +Yoda1). Data are represented as mean values ± SEM and multiple comparisions tests are performed at t = 180 s for both b and c. d, e Representative images (d) and quantification (e) of Ca2+ levels in VSMC were treated as indicated. The signal intensity scale is indicated on the right of d. a.u., arbitrary unit. For e, n = 33, 24, and 26 cells for PBS, PBS + Netrin-1, and GsMTx4 + Netrin-1, respectively. One-way ANOVA followed by Turkey’s multiple comparisons test. ****P < 0.0001. Data are represented as mean values ± SEM. f IF staining of α-SMA (green) and Piezo1 (red) in aortic sections of WT or NKO mice. The dashed box indicates the magnified area of AFM and immunostaining. Piezo1 and α-SMA expression and elastic modulus in areas of interest are outlined. Nuclei are stained with DAPI (blue). Tissue sections in f were transversal sections. Source data are provided as a Source Data file.
Fig. 8
Fig. 8. Antagonizing Piezo1 activation prevents AAA development.
a Schematic representation of GsMTx4 treatment during AAA induction. i.p., intraperitoneal. AAA prevalence (b), AAA severity score (c), and survival rates (d) in mice treated as indicated. e Measurements of maximum aortic diameter over time (left) and representative color Doppler ultrasound images (right) of aortic flow as indicated. The dotted line delimitates the aortic wall. Arrows show maximum diameter. n = 3, 6, and 7 mice for PBS, Ang II + vehicle, and Ang II + GsMTx4, respectively. One-way ANOVA followed by Turkey’s multiple comparisons test. **P = 0.0017 and ***P = 0.0005. Data are represented as mean values ± SEM. f Violin plot of Mmp3 mRNA expression in VSMC and g its t-SNE distribution in single-cell RNA seq dataset. h Mmp3 activity assay in VSMC stimulated with Netrin-1 with or without GsMTx4. n = 4 per group. i Immunofluorescence staining of Mmp3 (green) and α-SMA (red) in aortas of mice exposed to Ang II, vehicle or GsMTx4. n ≥ 3 per group. One-way ANOVA followed by Turkey’s multiple comparisons test. **P = 0.0037 and ***P = 0.0007 (Control vs Netrin-1) and 0.0001 (Netrin-1 vs Netrin-1 + GsMTx4). Data are represented as mean values ± SEM. Nuclei are stained with DAPI (blue). j Verhoeff-Van Gieson elastin staining in aortic sections of indicated mice. Arrows indicate elastin breaks. n = 3 independent experiments per group. Tissue sections in i and j were transversal sections. Mouse icon in a is created with BioRender.com. Source data are provided as a Source Data file.

References

    1. Kent KC. Abdominal Aortic Aneurysms. New Engl. J. Med. 2014;371:2101–2108. - PubMed
    1. Sampson UK, et al. Estimation of global and regional incidence and prevalence of abdominal aortic aneurysms 1990 to 2010. Glob. Heart. 2014;9:159–170. - PubMed
    1. Raffort J, et al. Monocytes and macrophages in abdominal aortic aneurysm. Nat. Rev. Cardiol. 2017;14:457–471. - PubMed
    1. Hellenthal FAMVI, Buurman WA, Wodzig WKWH, Schurink GWH. Biomarkers of AAA progression. Part 1: extracellular matrix degeneration. Nat. Rev. Cardiol. 2009;6:464–474. - PubMed
    1. Milewicz DM, et al. Altered smooth muscle cell force generation as a driver of thoracic aortic aneurysms and dissections. Arterioscler Thromb. Vasc. Biol. 2017;37:26–34. - PMC - PubMed

Publication types

MeSH terms