. 2022 Jan 26;13(1):521.
doi: 10.1038/s41467-022-28130-0.

Low CCR5 expression protects HIV-specific CD4+ T cells of elite controllers from viral entry

Affiliations

Low CCR5 expression protects HIV-specific CD4+ T cells of elite controllers from viral entry

Mathieu Claireaux et al. Nat Commun. .

Abstract

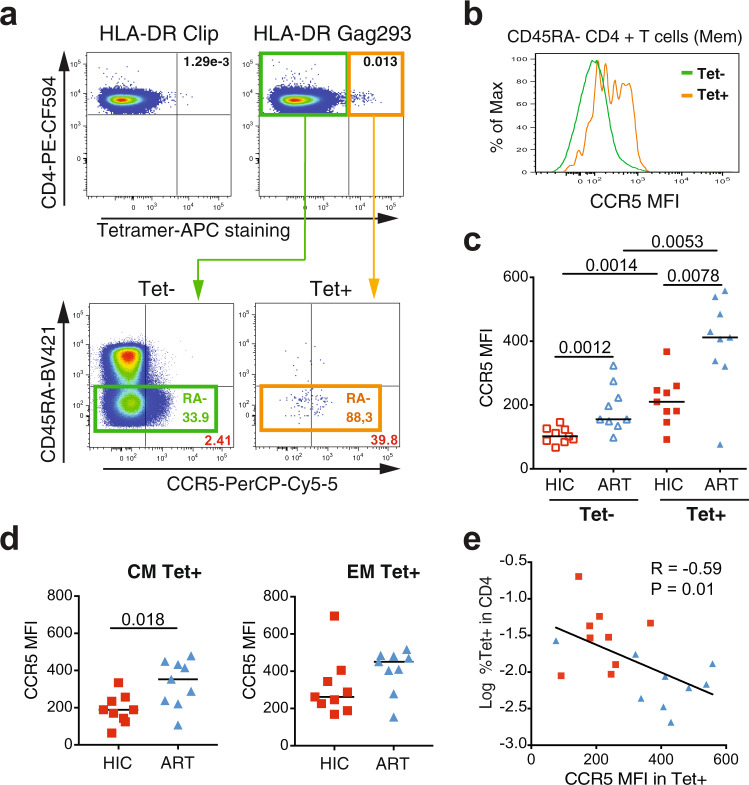
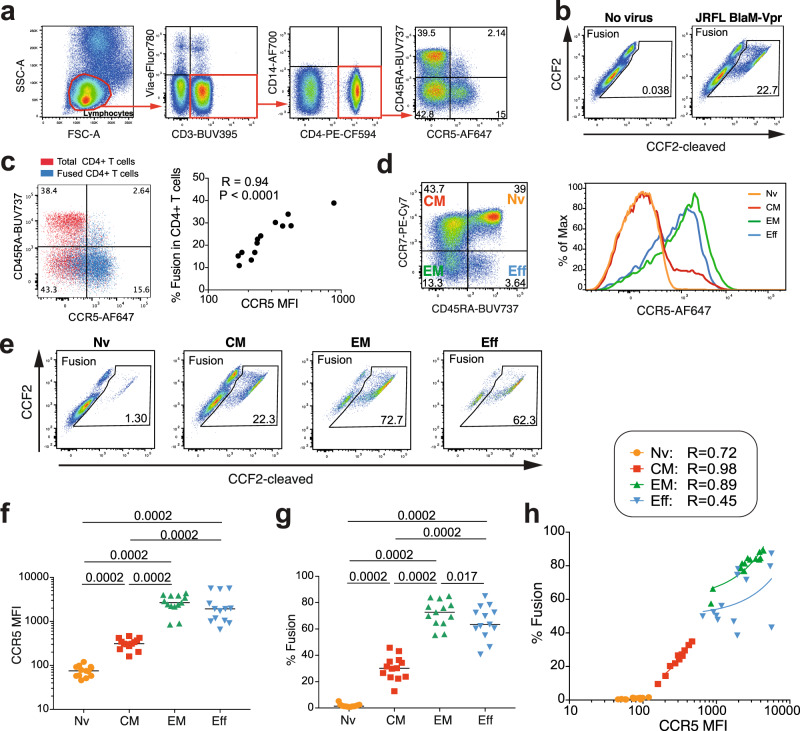
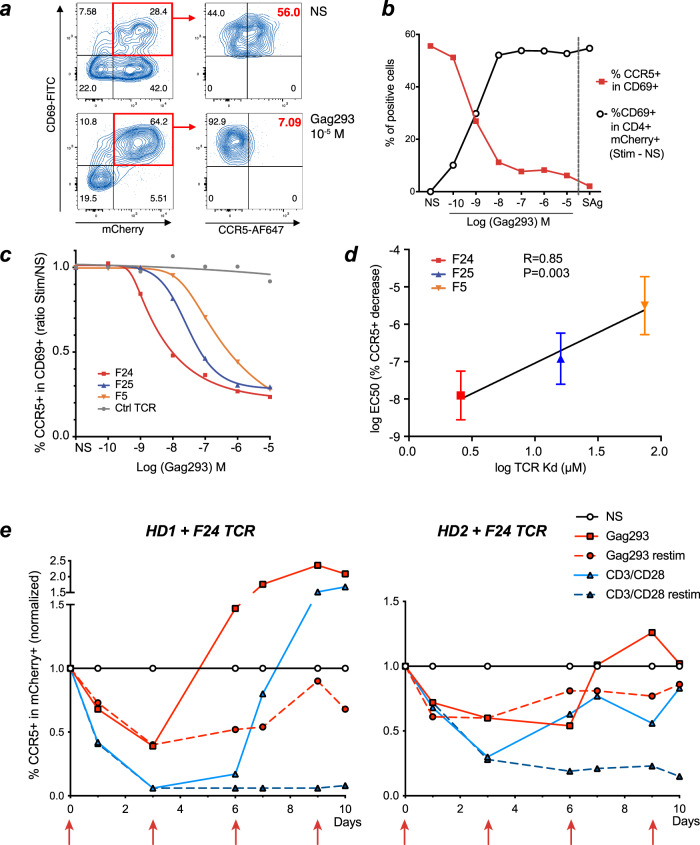
HIV elite controllers maintain a population of CD4 + T cells endowed with high avidity for Gag antigens and potent effector functions. How these HIV-specific cells avoid infection and depletion upon encounter with the virus remains incompletely understood. Ex vivo characterization of single Gag-specific CD4 + T cells reveals an advanced Th1 differentiation pattern in controllers, except for the CCR5 marker, which is downregulated compared to specific cells of treated patients. Accordingly, controller specific CD4 + T cells show decreased susceptibility to CCR5-dependent HIV entry. Two controllers carried biallelic mutations impairing CCR5 surface expression, indicating that in rare cases CCR5 downregulation can have a direct genetic cause. Increased expression of β-chemokine ligands upon high-avidity antigen/TCR interactions contributes to autocrine CCR5 downregulation in controllers without CCR5 mutations. These findings suggest that genetic and functional regulation of the primary HIV coreceptor CCR5 play a key role in promoting natural HIV control.


Conflict of interest statement

The authors declare no competing interests.

Figures

Fig. 1
Fig. 1. Dominant Th1 differentiation pattern in Gag293-specific cells of controllers.
a Example of MHC II tetramer labeling in controller CD4 + T cells, with a Gag293-loaded tetramer (top left) compared to a CLIP-loaded control tetramer (bottom left). The frequency of CD45RA− memory cells is increased in the tetramer-positive (Tet+) population (right). b Percentage of Gag293-specific cells in CD4 + T cells of controllers (HIC, n = 12) and treated patients (ART, n = 15). Medians were compared with the Mann-Whitney test. c Distribution of n = 700 single CD4 + T cells by linear discriminant analysis (LDA). d, e List of variables that are most significantly correlated with the LD1 (d) or LD2 (e) discriminant directions defined in the LDA, with a threshold P-value < 104. P values were computed for the Pearson correlations, without corrections for multiple comparisons. Genes are reported in plain text while mean fluorescence intensities (MFI) of proteins are reported in bold. Variables are color-coded according to their implication in T cell differentiation pathways (e.g., Th1 variables in blue). The bar for IL7R is hatched because this marker decreases upon activation. Source data are provided as a Source Data file.
Fig. 2
Fig. 2. Gag293-specific cells of controllers are characterized by high CCL5 but low CCR5 expression.
a, b Distribution of gene expression values (a) and protein MFI (b) for selected variables in the 4 single cell groups (HIC Tet+ n = 188, HIC Tet− n = 160, ART Tet+ n = 170, ART Tet− n = 182). Significant P values measured by a Mann-Whitney test between the HIC Tet+ and ART Tet+ groups are indicated by stars (**P < 0.01, ****P < 0.0001).
Fig. 3
Fig. 3. Low CCR5 expression correlates with the persistence of Gag293-specific CD4 + T cells.
a Example of CCR5 staining in Gag293-specific (Tet+) and non-specific (Tet−) controller CD4 + T cells. b Comparison of the CCR5 MFI in the Tet+ and Tet− populations shown in a, after gating in the CD45RA− memory (Mem) population. c Comparison of CCR5 MFI in the Tet+ and Tet− populations of controller (HIC) and treated patient (ART) Mem CD4 + T cells. d Comparison of CCR5 expression in the central memory (CM) and effector memory (EM) subsets of Tet+ cells. Significant differences between medians computed with the Mann-Whitney test are reported in cd. e Inverse correlation between the frequency of Gag293-specific Tet+ cells in CD4 + T cells and CCR5 expression in Mem Tet+ cells. The Spearman linear correlation coefficient R and the associated P-value are reported. HIC Tet+ red squares; ART Tet+ blue triangles.
Fig. 4
Fig. 4. R5 HIV entry is strongly dependent on CCR5 expression.
Fusion with the R5 HIV-1 reporter virus JR-FL BlaM-Vpr was analyzed in unstimulated primary CD4 + T cells from healthy donors (HD, n = 13). a Gating strategy for the analysis of HIV-1 fusion in CD4 + T cells. b Example of HIV-1 fusion in HD CD4 + T cells, as measured by the cleavage of the fluorescent FRET substrate CCF2. c Overlay plot illustrating that HIV-1 JR-FL fusion occurs predominantly in CCR5 + cells (left) and association between CCR5 expression (MFI) and fusion in HD CD4 + T cells (right). The Pearson correlation coefficient R is reported. d CCR5 expression in CD4 + T cell subsets from one HD. Naive (Nv), central memory (CM), effector memory (EM), and effector (Eff) subsets defined by CD45RA and CCR7 expression (left) show different CCR5 expression levels (right). e Example of HIV-1 JR-FL fusion in the 4 CD4 + T cell subsets. f, g Quantitation of CCR5 expression (f) and HIV-1 JR-FL fusion (g) in the 4 CD4 + T cell subsets. Significant differences between medians were computed with the Mann-Whitney test. h Correlations between CCR5 expression and HIV-1 JR-FL fusion in the 4 CD4 + T cell subsets. Pearson linear correlation coefficients are reported. Nv Orange circles, CM Red squares, EM Upward green triangles, Eff Downward blue triangles.
Fig. 5
Fig. 5. Low susceptibility of controller Gag293-specific CD4 + T cells to R5 HIV entry.
HIV-1 JR-FL fusion was analyzed in Gag293-specific (Tet+) and non-specific (Tet−) memory CD4 + T cells from controllers (HIC) and treated patients (ART). a Example showing increased HIV fusion in Tet+ compared with Tet− cells from one controller. b Comparison of HIV fusion in Tet+ and Tet− cells from the HIC and ART groups. c Comparison of HIV fusion in central memory (CM, left) and effector memory (EM, right) Tet+ populations between the HIC and ART groups. b, c Differences between medians were computed with the Mann-Whitney test. d Positive correlation between CCR5 expression and fusion in the Tet+ population. e Positive correlation between CCR5 expression and fusion in the Mem (CD45RA− CD4 +) population. f Inverse correlation between Tet+ cells in CD4 + T cells and CCR5 expression in Mem cells. df Spearman correlation coefficients and associated P values are reported in plots. HIC Tet+ Filled red squares, ART Tet+ Filled blue triangles, HIC Mem Open red squares, ART Mem Open blue triangles.
Fig. 6
Fig. 6. Biallelic mutations limit CCR5 surface expression in controller patient HIC11.
a Schematic representation of CCR5 mutations Δ32 and Q280P found in patient HIC11. Modified amino acids are represented in red. ECL Extracellular loop. ICL Intracellular loop. bf Effect of CCR5 mutations in primary CD4 + T cells: CCR5-T2A-mCherry wild-type (WT) or mutant plasmids were nucleofected in PBMC, and CCR5 expression was measured in the naive CD45RA + CCR7 + population. b Gating strategy for the combined analysis of CCR5 expression and HIV-1 JR-FL fusion. Nucleofection is measured by the % mCherry+ cells in naive CD4 + T cells. Fusion is measured by the % CCF2-cleaved+ cells in mCherry+ naive cells. c, d Quantification of CCR5 expression and (e, f) of HIV-1 JR-FL fusion, after single nucleofection (c, e) or co-nucleofection (d, f) of CCR5 plasmids. Means ± SD for n = 3 experiments are reported, with P values computed by Student’s t-test. g HIV-1 JR-FL fusion (red) is analyzed in total CD4 + T cells of one HD and of patient HIC11, either untreated (CTRL) or nucleoporated with CCR5 WT plasmid (n = 1 experiment).
Fig. 7
Fig. 7. Downregulation of CCR5 via β-chemokine production upon antigenic stimulation.
a, b Analysis of CCR5 expression in patient memory CD4 + T cells stimulated with Gag peptides or superantigens. a Example shown for one controller: CCR5 and CD69 expression were measured in CD45RA− CD4 + T cells after a 3-day stimulation of CD8-depleted PBMC with Gag293, a Gag peptide pool, or superantigens, in the absence (top) or presence (bottom) of β-chemokine blocking antibodies. b Quantitation of CCR5 expression in memory CD4 + T cells of HIC (top) and ART (bottom) without stimulation (NS) or post-stimulation, in the absence or presence (+Block.) of blocking β-chemokine antibodies. Variations in % CCR5 + cells were analyzed with the Wilcoxon matched-pairs signed-rank test: *P < 0.05; **P < 0.01.
Fig. 8
Fig. 8. Strong TCR signals induce CCR5 downregulation.
ad Analysis of CCR5 downregulation in HD PBMC transduced with Gag293-specific TCRs and activated with Gag293-loaded APC. a Gating strategy: TCR-dependent activation was measured by CD69 induction in TCR-transduced (mCherry+) CD4 + T cells (left). CCR5 downregulation was measured in activated mCherry+ CD69 + CD4 + T cells (right). NS Non-stimulated. b Example of quantitation of T cell activation (%CD69 + in Stim - NS Black curve) and of CCR5 down-regulation (%CCR5+ in CD69+) in TCR F24-transduced PBMC, in function of Gag293 concentration. Superantigens (SAg) were used as positive control. c Analysis of CCR5 downregulation as in B, for PBMC transduced with 3 Gag293-specific TCRs of increasing affinity (F5 < F24 < F24) or with a control flu-specific TCR (Ctrl) in an HLA-DR15 context. One representative experiment out of n = 3 is shown. The % CCR5 + cells in CD69 + mCherry+ CD4 + T cells is normalized to that measured in the unstimulated condition (NS). d Correlation between TCR affinity (Kd) for the Gag293/HLA-DR15 complex and the Gag293 EC50 concentration for CCR5 downregulation (as determined in c). Means ±SD are shown for n = 3 experiments. The linear regression coefficient R and associated P-value for the slope being significantly ≠ 0 are reported. e Kinetics of CCR5 downregulation in TCR transduced CD4 + T cells upon antigenic stimulation. TCR-transduced CD4 + T cells (mCherry+ CD4 +) were monitored for CCR5 expression after stimulation at day 0 with either the cognate peptide (Gag293; solid red lines) or anti-CD3/anti-CD28 coated beads (CD3/CD28; solid blue lines). Kinetics are shown in transduced cells of n = 2 healthy donors, HD1 (left), and HD2 (right). The proportion of CCR5 + cells as compared to the unstimulated condition (NS) is reported. In the “restim” conditions (dashed lines), cultures were restimulated at days 3, 6, and 9, as indicated by red vertical arrows.

References

    1. Saez-Cirion A, Manel N. Immune Responses to Retroviruses. Annu. Rev. Immunol. 2018;36:193–220. - PubMed
    1. Goulder P, Deeks SG. HIV control: Is getting there the same as staying there? PLoS. Pathog. 2018;14:e1007222. - PMC - PubMed
    1. Lambotte O, et al. HIV controllers: a homogeneous group of HIV-1-infected patients with spontaneous control of viral replication. Clin. Infect. Dis. 2005;41:1053–1056. - PubMed
    1. Blankson JN, et al. Isolation and characterization of replication-competent human immunodeficiency virus type 1 from a subset of elite suppressors. J. Virol. 2007;81:2508–2518. - PMC - PubMed
    1. Walker BD, Yu XG. Unravelling the mechanisms of durable control of HIV-1. Nat. Rev. Immunol. 2013;13:487–498. - PubMed

Publication types