. 2022 Jan 26;12(1):1393.
doi: 10.1038/s41598-022-05148-4.

Mitochondrial-nuclear epistasis underlying phenotypic variation in breast cancer pathology

Affiliations

Mitochondrial-nuclear epistasis underlying phenotypic variation in breast cancer pathology

Pierre R Bushel et al. Sci Rep. .

Abstract

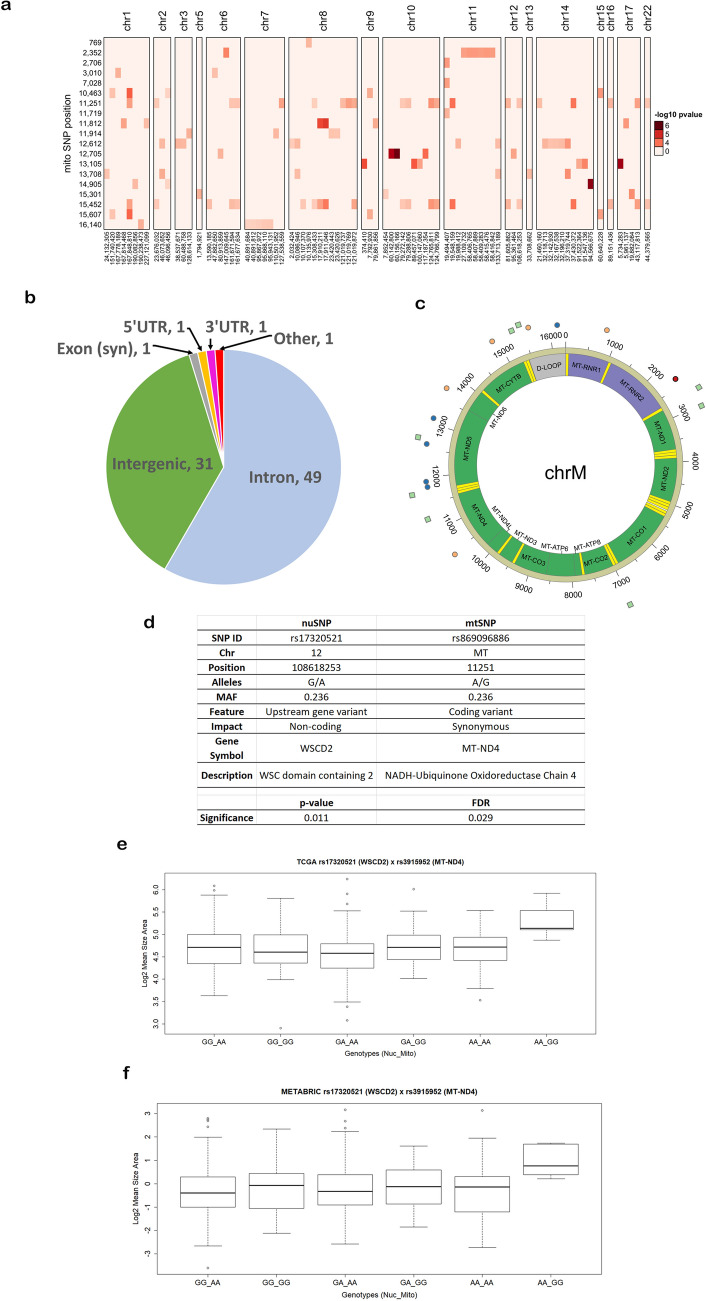
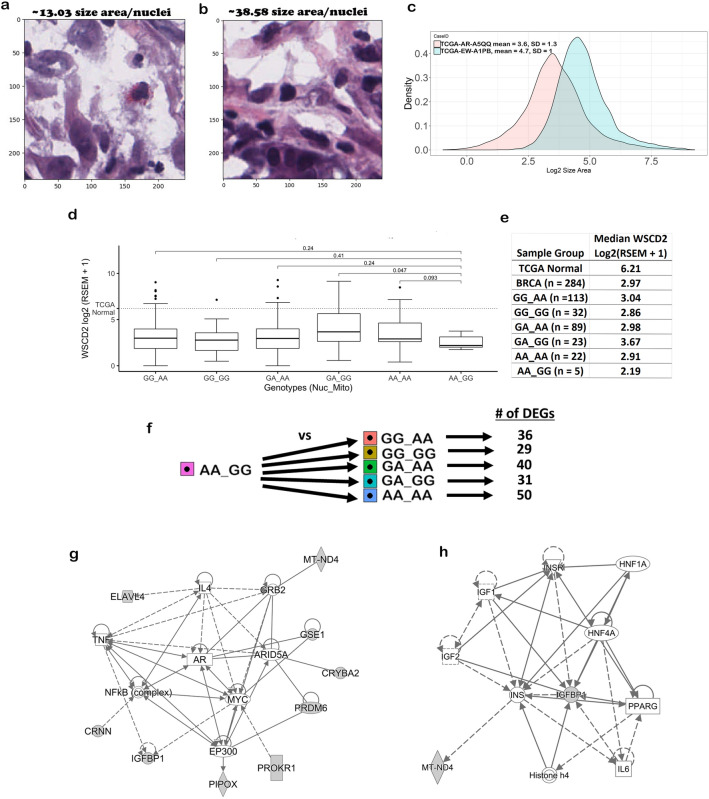
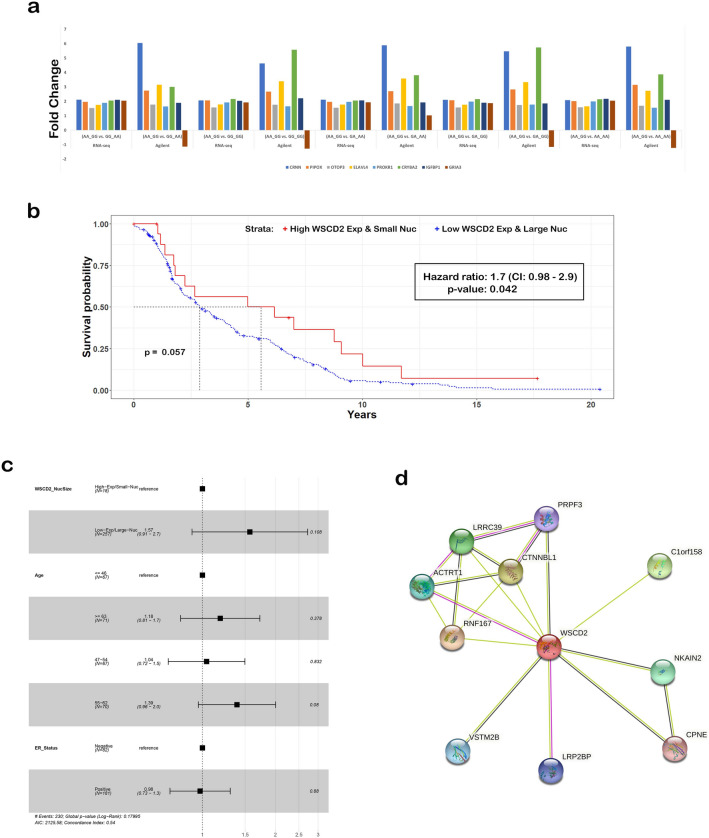
The interplay between genes harboring single nucleotide polymorphisms (SNPs) is vital to better understand underlying contributions to the etiology of breast cancer. Much attention has been paid to epistasis between nuclear genes or mutations in the mitochondrial genome. However, there is limited understanding about the epistatic effects of genetic variants in the nuclear and mitochondrial genomes jointly on breast cancer. We tested the interaction of germline SNPs in the mitochondrial (mtSNPs) and nuclear (nuSNPs) genomes of female breast cancer patients in The Cancer Genome Atlas (TCGA) for association with morphological features extracted from hematoxylin and eosin (H&E)-stained pathology images. We identified 115 significant (q-value < 0.05) mito-nuclear interactions that increased nuclei size by as much as 12%. One interaction between nuSNP rs17320521 in an intron of the WSC Domain Containing 2 (WSCD2) gene and mtSNP rs869096886, a synonymous variant mapped to the mitochondrially-encoded NADH dehydrogenase 4 (MT-ND4) gene, was confirmed in an independent breast cancer data set from the Molecular Taxonomy of Breast Cancer International Consortium (METABRIC). None of the 10 mito-nuclear interactions identified from non-diseased female breast tissues from the Genotype-Expression (GTEx) project resulted in an increase in nuclei size. Comparisons of gene expression data from the TCGA breast cancer patients with the genotype homozygous for the minor alleles of the SNPs in WSCD2 and MT-ND4 versus the other genotypes revealed core transcriptional regulator interactions and an association with insulin. Finally, a Cox proportional hazards ratio = 1.7 (C.I. 0.98-2.9, p-value = 0.042) and Kaplan-Meier plot suggest that the TCGA female breast cancer patients with low gene expression of WSCD2 coupled with large nuclei have an increased risk of mortality. The intergenomic dependency between the two variants may constitute an inherent susceptibility of a more severe form of breast cancer and points to genetic targets for further investigation of additional determinants of the disease.


Conflict of interest statement

The authors declare no competing interests.

Figures

Figure 1
Figure 1
Significant mito-nuclear interactions. (a) Shown is a heat map of -log10 p-values ordered by mitochondrial genome position on the y-axis and nuclear genome position (chromosome, position) on the x-axis. All p-values shown meet the FDR q-value threshold for statistical significance of < 0.05 and Bonferroni p-value < 0.05. The Heatmap was produced in R using ComplexHeatmap. (b) Genomic targets of nuSNPs. Syn: synonymous substitution, UTR: untranslated region. (c) Circos plot of the mitochondrial genome (chrM) with genes color coded and labeled and tRNAs denoted as yellow bands. Points outside of the genome represent the variant allele frequency (VAF) of the mtSNPs. Red circle: VAF < 0.1, Blue circle: 0.1 ≥ VAF < 0.2, Orange circle: 0.2 ≥ VAF < 0.3, Green square: VAF ≥ 0.3. (d) Genomic information for the interacting SNPs significant in TCGA and METABRIC cohorts. The p-value and false discovery rate (FDR) q-value are from the TCGA data analysis. (e) Boxplot of TCGA log2 mean size area normalized by number of nuclei (y-axis) for the nuSNP rs17320521 (WSCD2) by mtSNP rs869096886 (MT-ND4) interaction. The x-axis is the genotypes for the nuSNP by mtSNP allele pairs. (f) Same as (e) except for METABRIC data.
Figure 2
Figure 2
Biological impact of the significant mito-nuclear interaction. (a) Hematoxylin stain channel of image tile #28943 at 40X magnification from subject TCGA-AR-A5QQ with genotype: GG_AA for rs17320521 by rs869096886. (b) Hematoxylin stain channel of image tile #6545 at 40X magnification from subject TCGA-EW-A1PB with genotype: AA_GG for rs17320521 by rs869096886. (c) Histograms of log2 size area of the nuclei in the images from subject TCGA-AR-A5QQ with genotype: GG_AA for rs17320521 by rs869096886 and subject TCGA-EW-A1PB with genotype: AA_GG for rs17320521 by rs869096886. The x-axis is log2 size area and the y-axis is the density of the data. (d) Same as Fig. 1e except for TCGA WSCD2 gene log2 (RSEM + 1) on the y-axis and 284 of the 286 patients. p-values for the comparisons are from Mann–Whitney tests with the hypothesis that the median WSCD2 gene expression of the patients with genotype homozygous for the minor alleles is the same as the other genotypes and the alternative is that the median is less. The dotted line is the median expression of WSCD2 in TCGA normal patients. (e) Table with median values of WSCD2 gene log2 (RSEM + 1) for sample groups. (f) t-test comparisons of RNA-Seq FPKM gene expression data between TCGA patients with genotype homozygous for the minor alleles for of rs17320521 by rs869096886 versus all other genotypes. For each comparison, the number of differentially expressed genes (DEGs) is shown based on a false discovery rate < 0.05 and fold change >|1.5|. (g) Interaction networks derived from the 16 genes from the overlap of the DEGs in (f), WSCD2 and MT-ND4 using the Ingenuity Pathway Analysis Knowledge Base content version 62,089,861. These focus genes are shaded gray. Square: cytokine, diamond: enzyme, triangle: kinase, horizontal oval: transcription regulator, horizontal rectangle: ligand-dependent nuclear receptor, double circle: complex, single circle: other. (h) Same as (g). except the interaction networks derived from the 9 of the 16 genes from the overlap of the DEGs in (f), WSCD2 and MT-ND4. Vertical rectangle: G-protein coupled receptor, vertical oval: transmembrane receptor, hexagon: translation regulator.
Figure 3
Figure 3
Gene expression validation, survival analysis and proteins interacting with WSCD2. (a) Validation of 8 of the 16 RNA-Seq DEGs using Agilent gene expression data (log2 lowess normalized (cy5/cy3) collapsed by gene symbol) from 130 of the 286 TCGA patients that were available in the U.S. National Institutes of Health National Cancer Institute Genomic Data Commons legacy archive. The y-axis is fold change and the x-axis is the gene colored according to the legend as well as grouped by the comparison using either data from RNA-Seq or Agilent microarray. (b) Kaplan–Meier plot of time-to-event survival from 277 of the 286 TCGA breast cancer female patients on their bulk RNA-Seq RSEM expression of WSCD2 and nucleus mean Size Area data. The x-axis is years and the y-axis is survival probability. The red curve is the data for patients with high WSCD2 gene expression (> the 75th percentile) and small nuclei (< the 25th percentile) and the blue curve is the data from the other patients (low WSCD2 gene expression and large nuclei). The dashed black lines are the medians of survival for each strata and p is the log-rank p-value from testing the null hypothesis that each strata has the same survival probability. The hazard ratio value and statistical inferences for the parameter is shown in the inset. (c) Forest plot for Cox proportional hazards model. N is the number of patients, the hazard ratio is represented by the square, its confidence interval in parentheses and is represented by the horizontal lines, the vertical line represents 1.0 and the p-value for each predictor variable is to the right of the plot. (d) Search Tool for the Retrieval of Interacting Genes/Proteins (STRING) database network of proteins that interact with the WSCD2 protein. Nodes are filled to denote that the 3D structure of the protein is known or predicted. Pink interactions are experimentally derived whereas lime or black colored interactions are derived by text mining literature or by gene co-expression analysis respectively.

References

    1. Bodily WR, et al. Effects of germline and somatic events in candidate BRCA-like genes on breast-tumor signatures. PLoS ONE. 2020;15:e0239197. doi: 10.1371/journal.pone.0239197. - DOI - PMC - PubMed
    1. Li Y, et al. Association between mitochondrial genetic variation and breast cancer risk: The Multiethnic Cohort. PLoS ONE. 2019;14:e0222284. doi: 10.1371/journal.pone.0222284. - DOI - PMC - PubMed
    1. Cancer Genome Atlas Research, N. et al. The Cancer Genome Atlas Pan-Cancer analysis project. Nat. Genet.45, 1113–1120. 10.1038/ng.2764 (2013). - PMC - PubMed
    1. Consortium. G. T The Genotype-Tissue Expression (GTEx) project. Nat Genet. 2013;45:580–585. doi: 10.1038/ng.2653. - DOI - PMC - PubMed
    1. Curtis C, et al. The genomic and transcriptomic architecture of 2,000 breast tumours reveals novel subgroups. Nature. 2012;486:346–352. doi: 10.1038/nature10983. - DOI - PMC - PubMed

Publication types

MeSH terms