. 2022 Feb;602(7895):129-134.
doi: 10.1038/s41586-021-04336-y. Epub 2022 Jan 26.

Brahma safeguards canalization of cardiac mesoderm differentiation

Affiliations

Brahma safeguards canalization of cardiac mesoderm differentiation

Swetansu K Hota et al. Nature. 2022 Feb.

Abstract

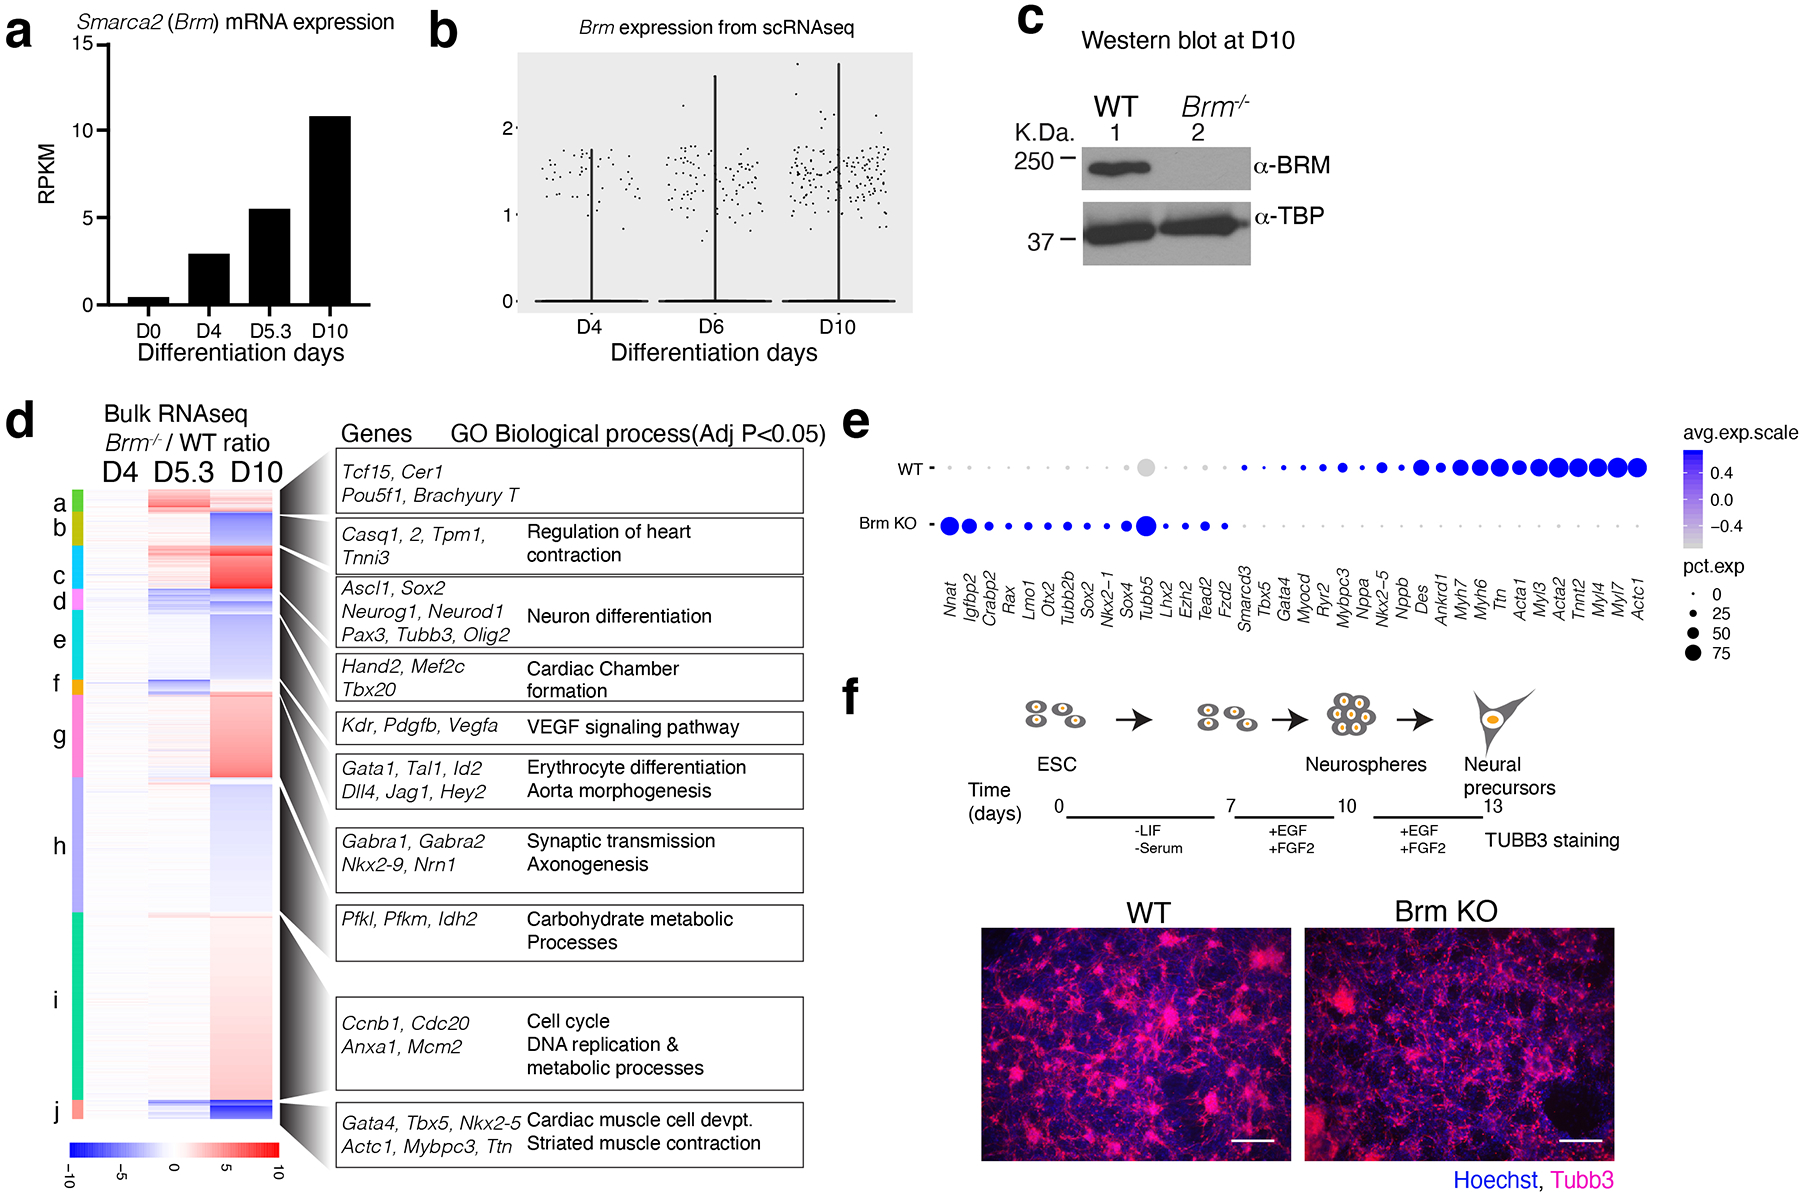
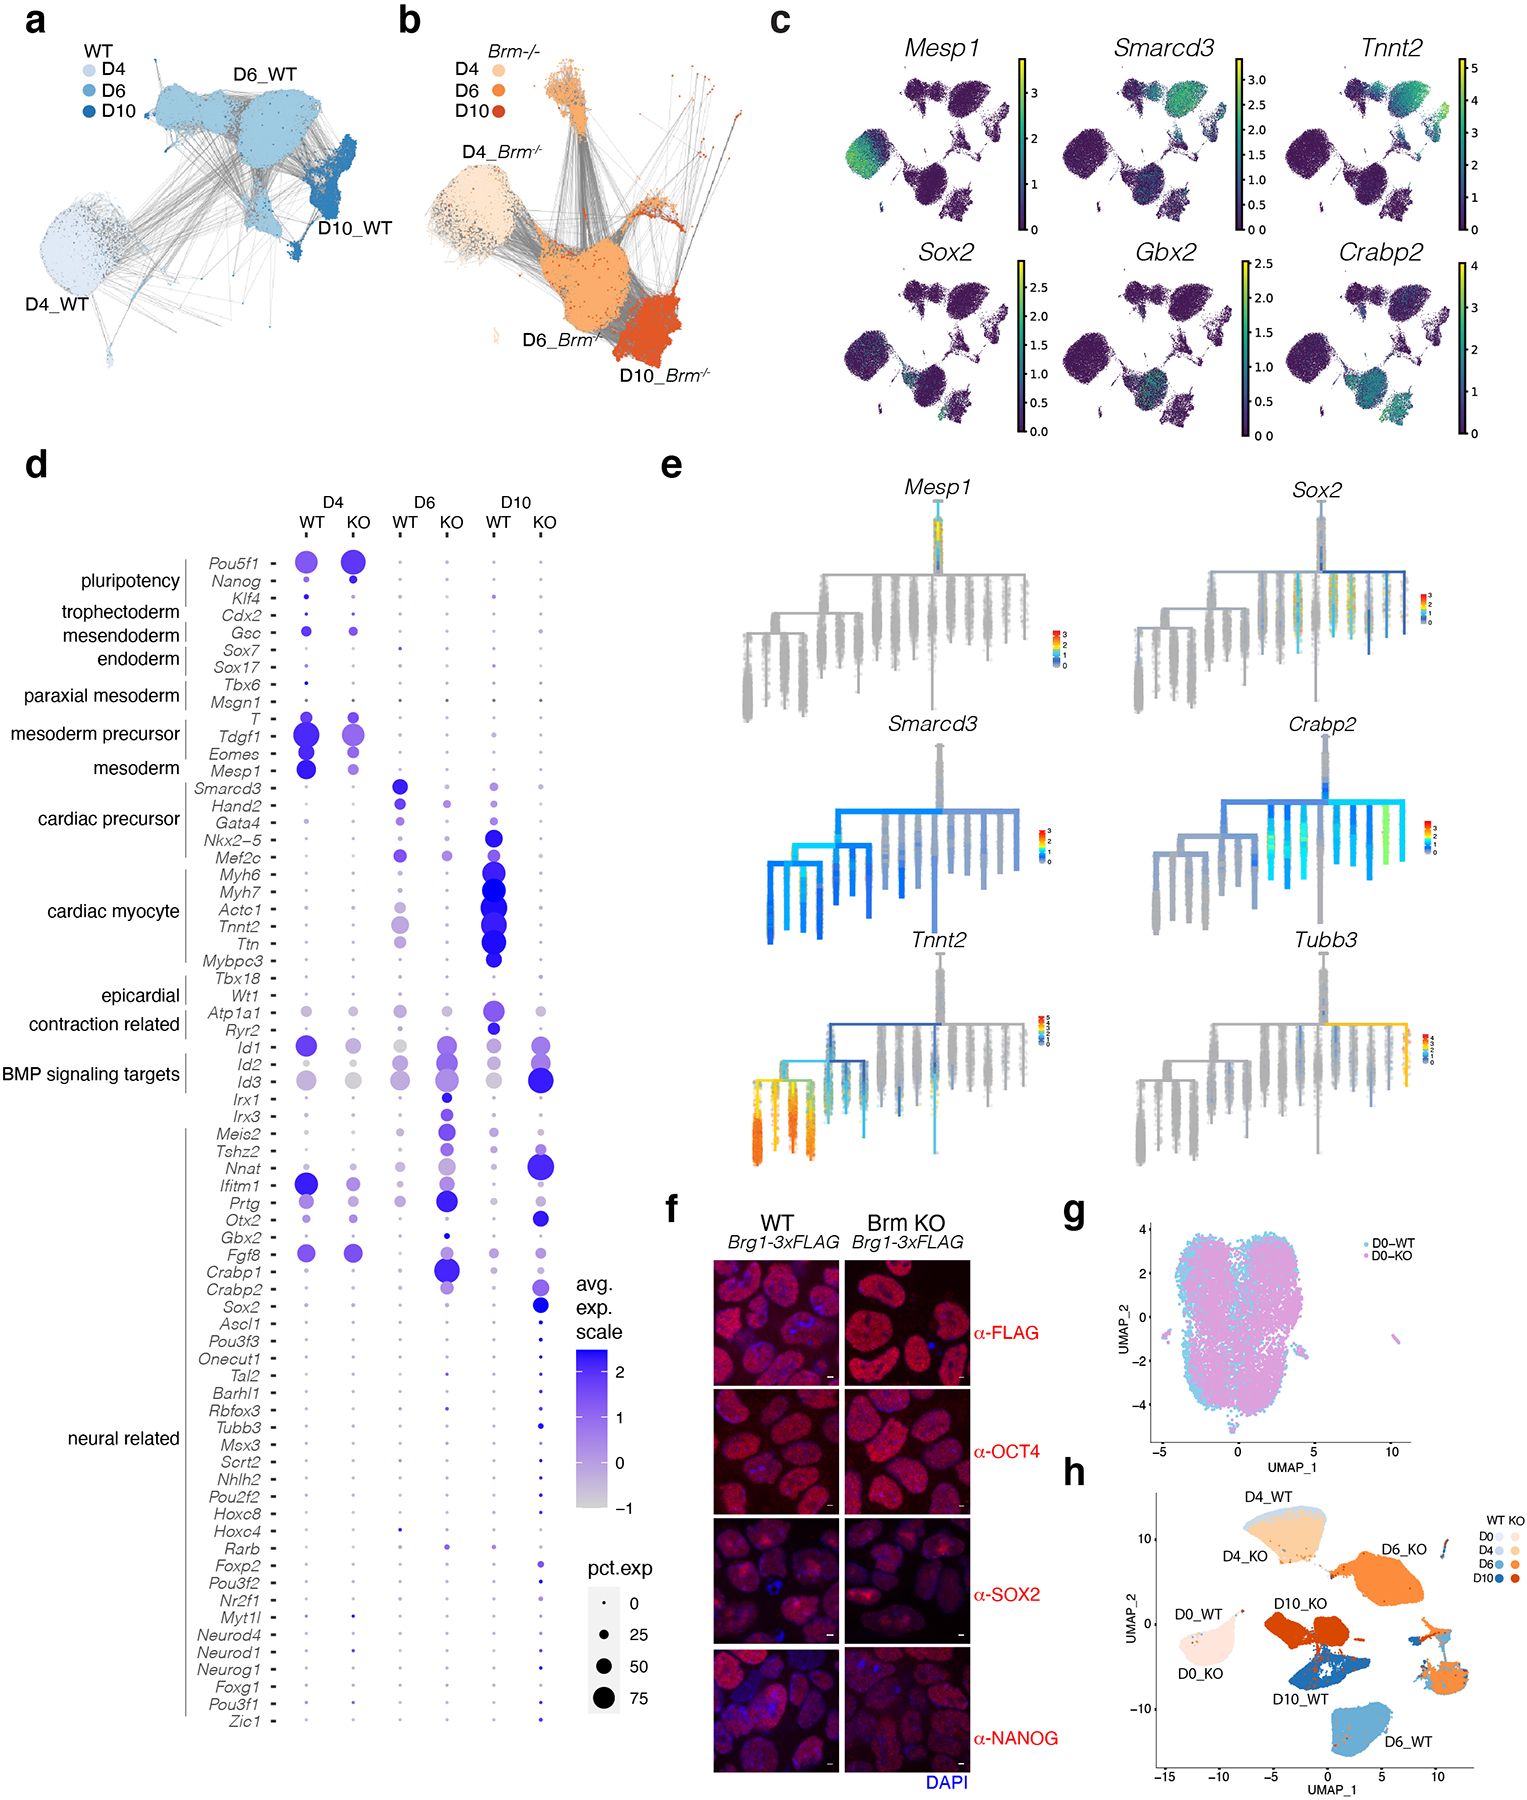
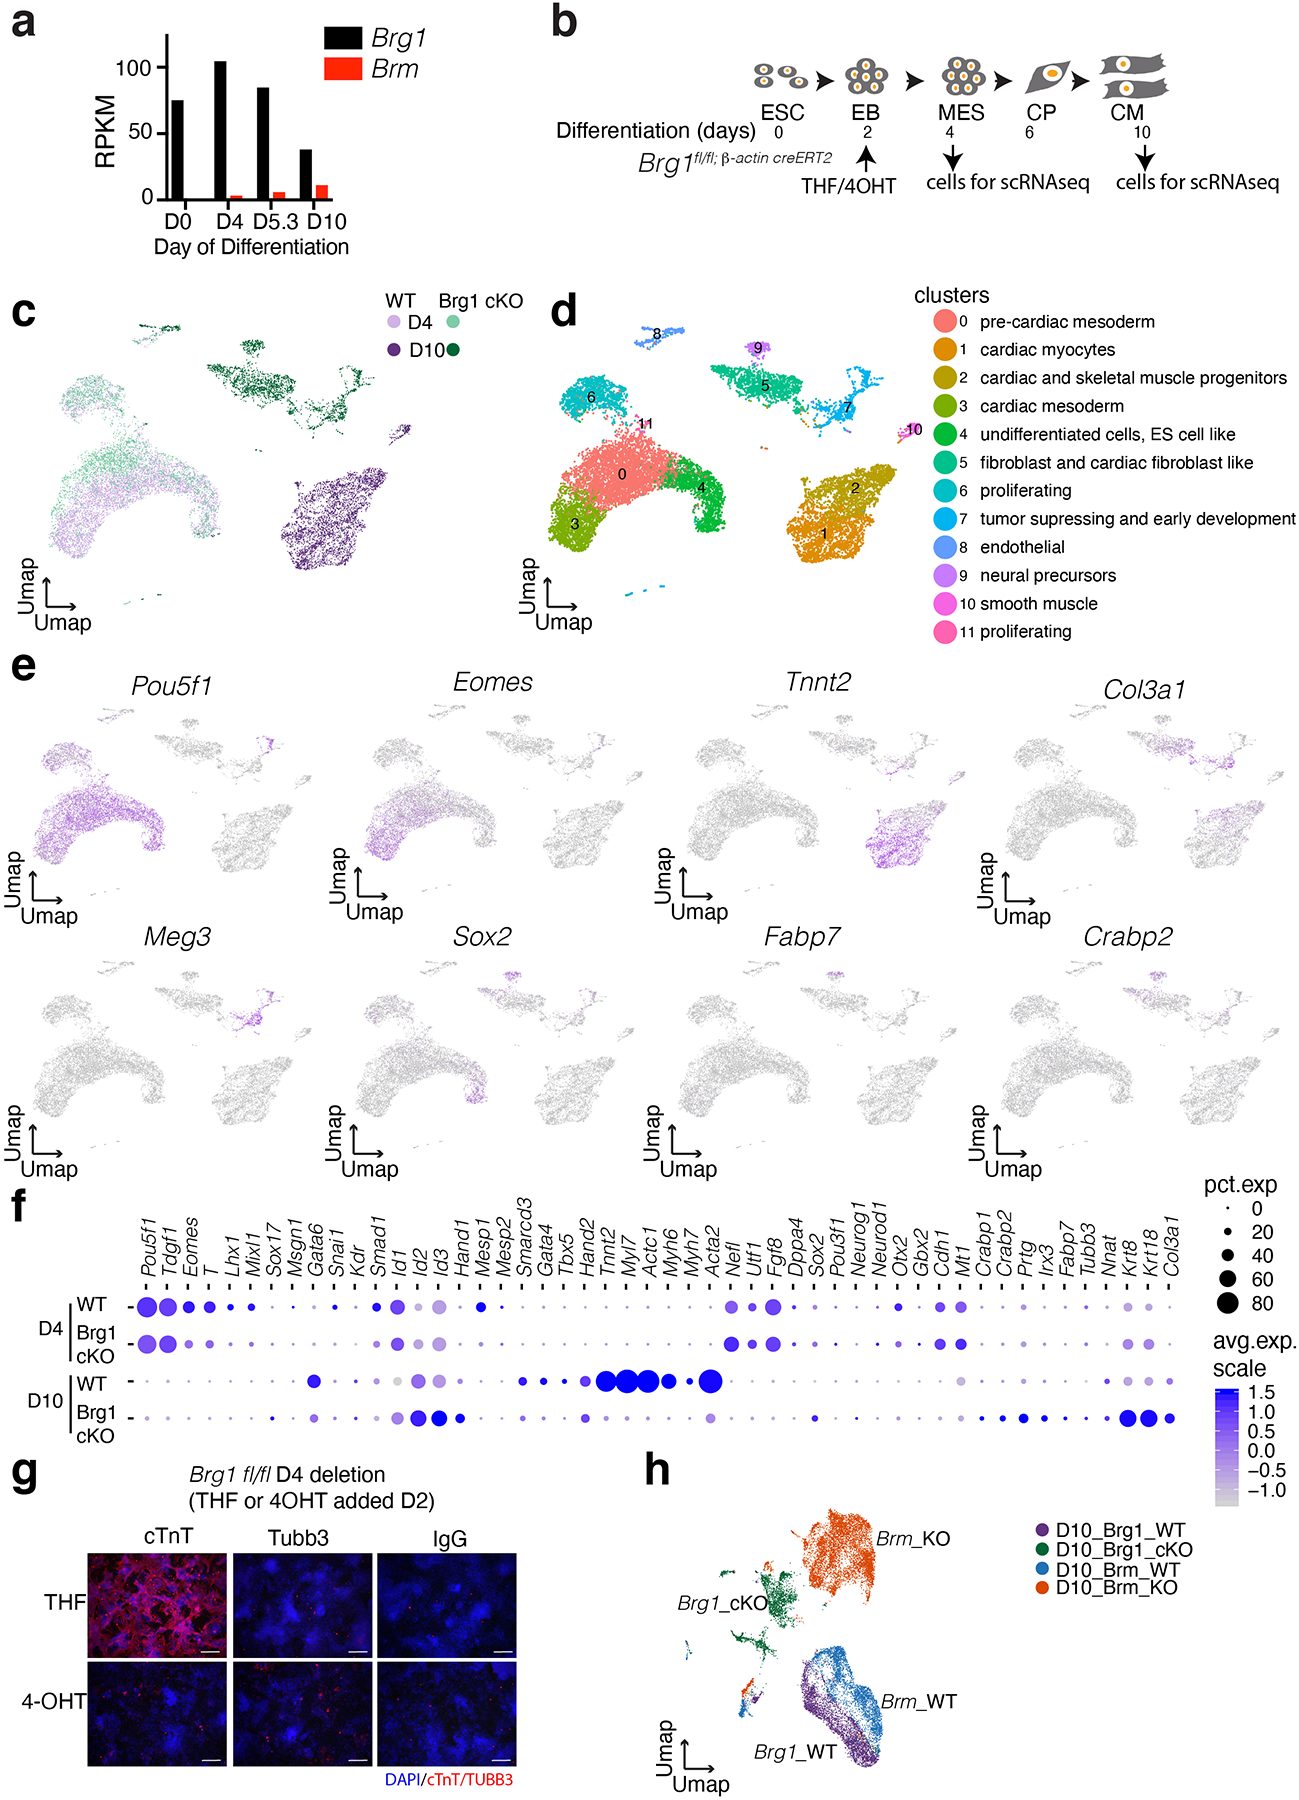
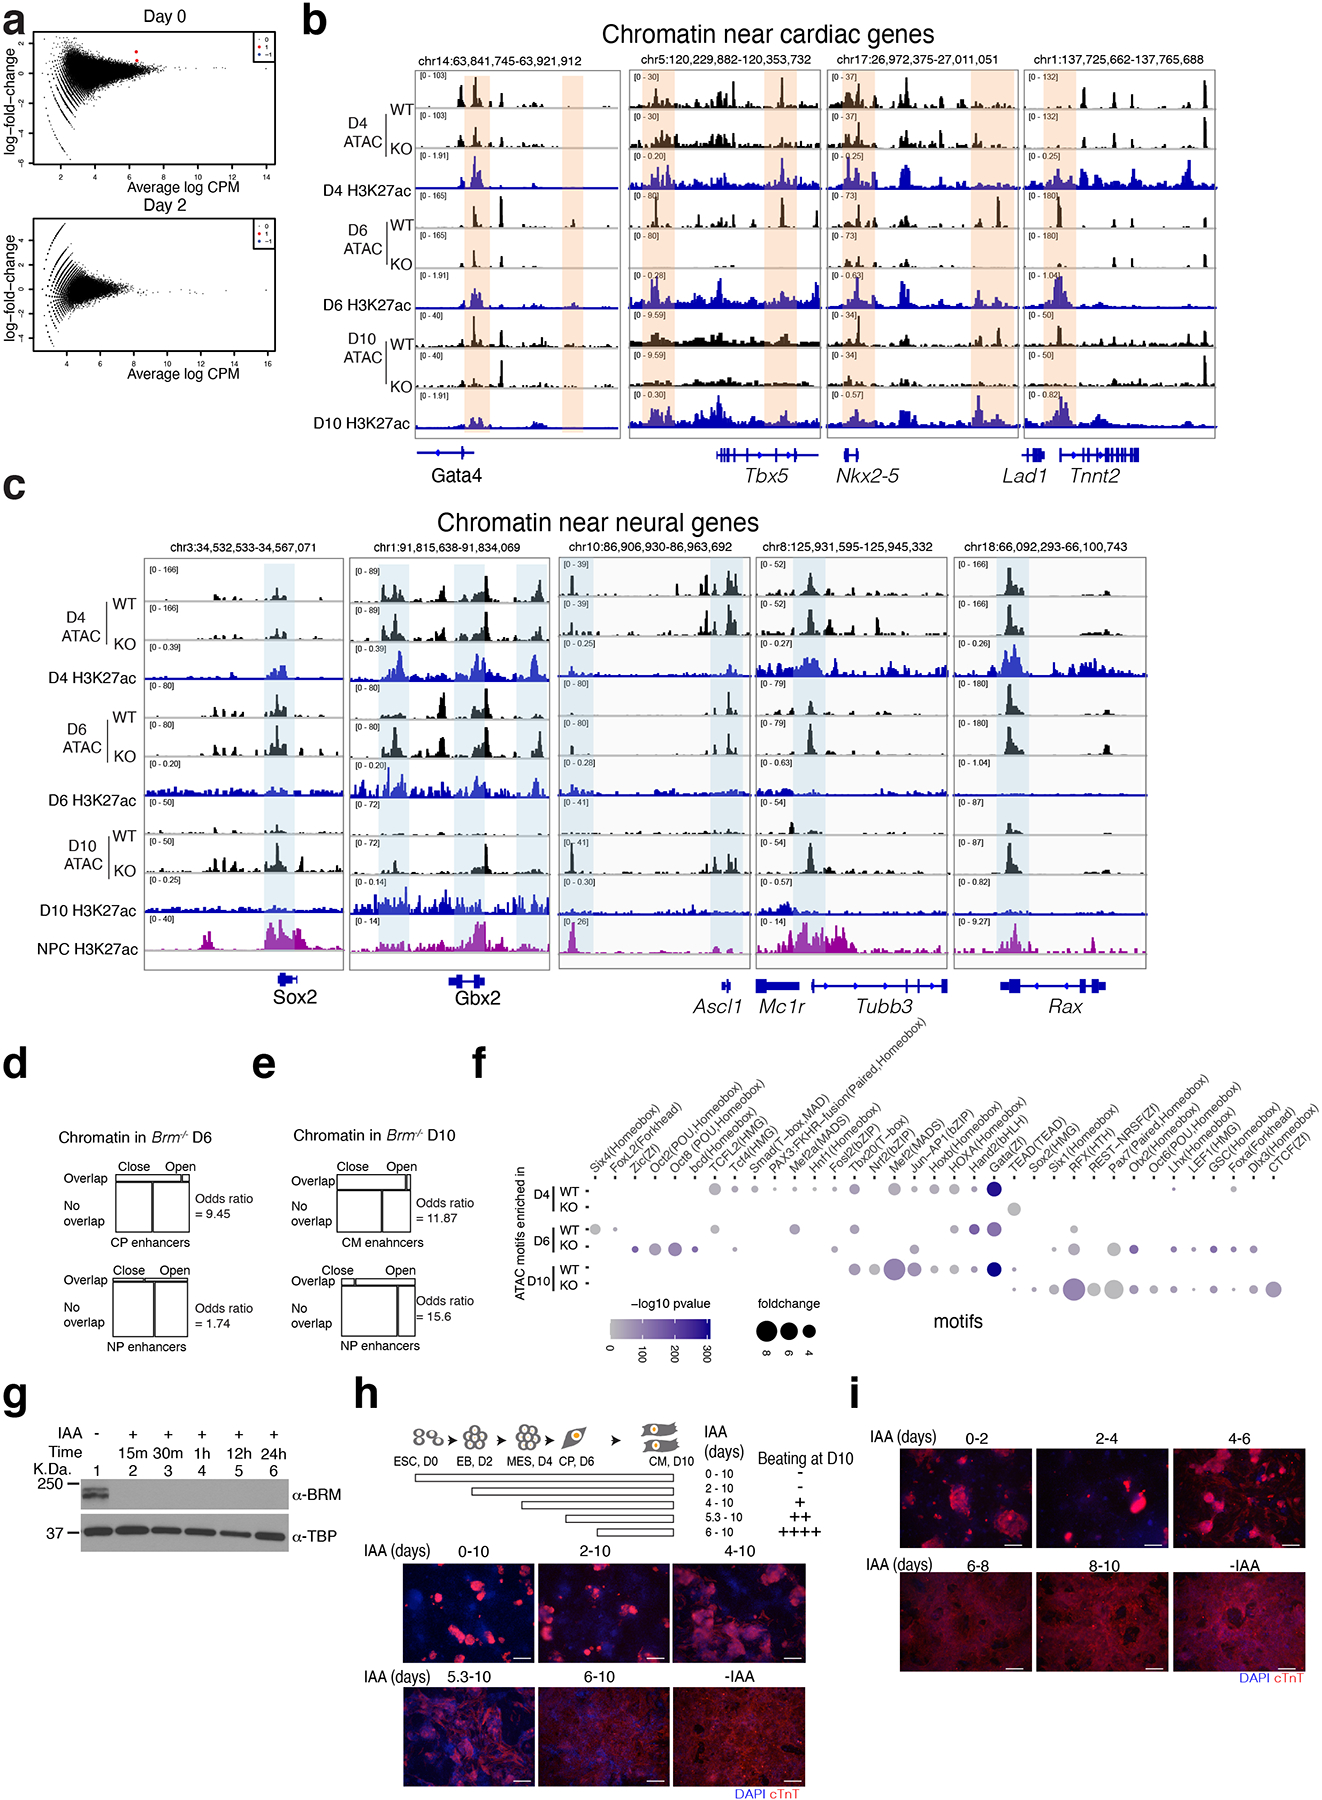
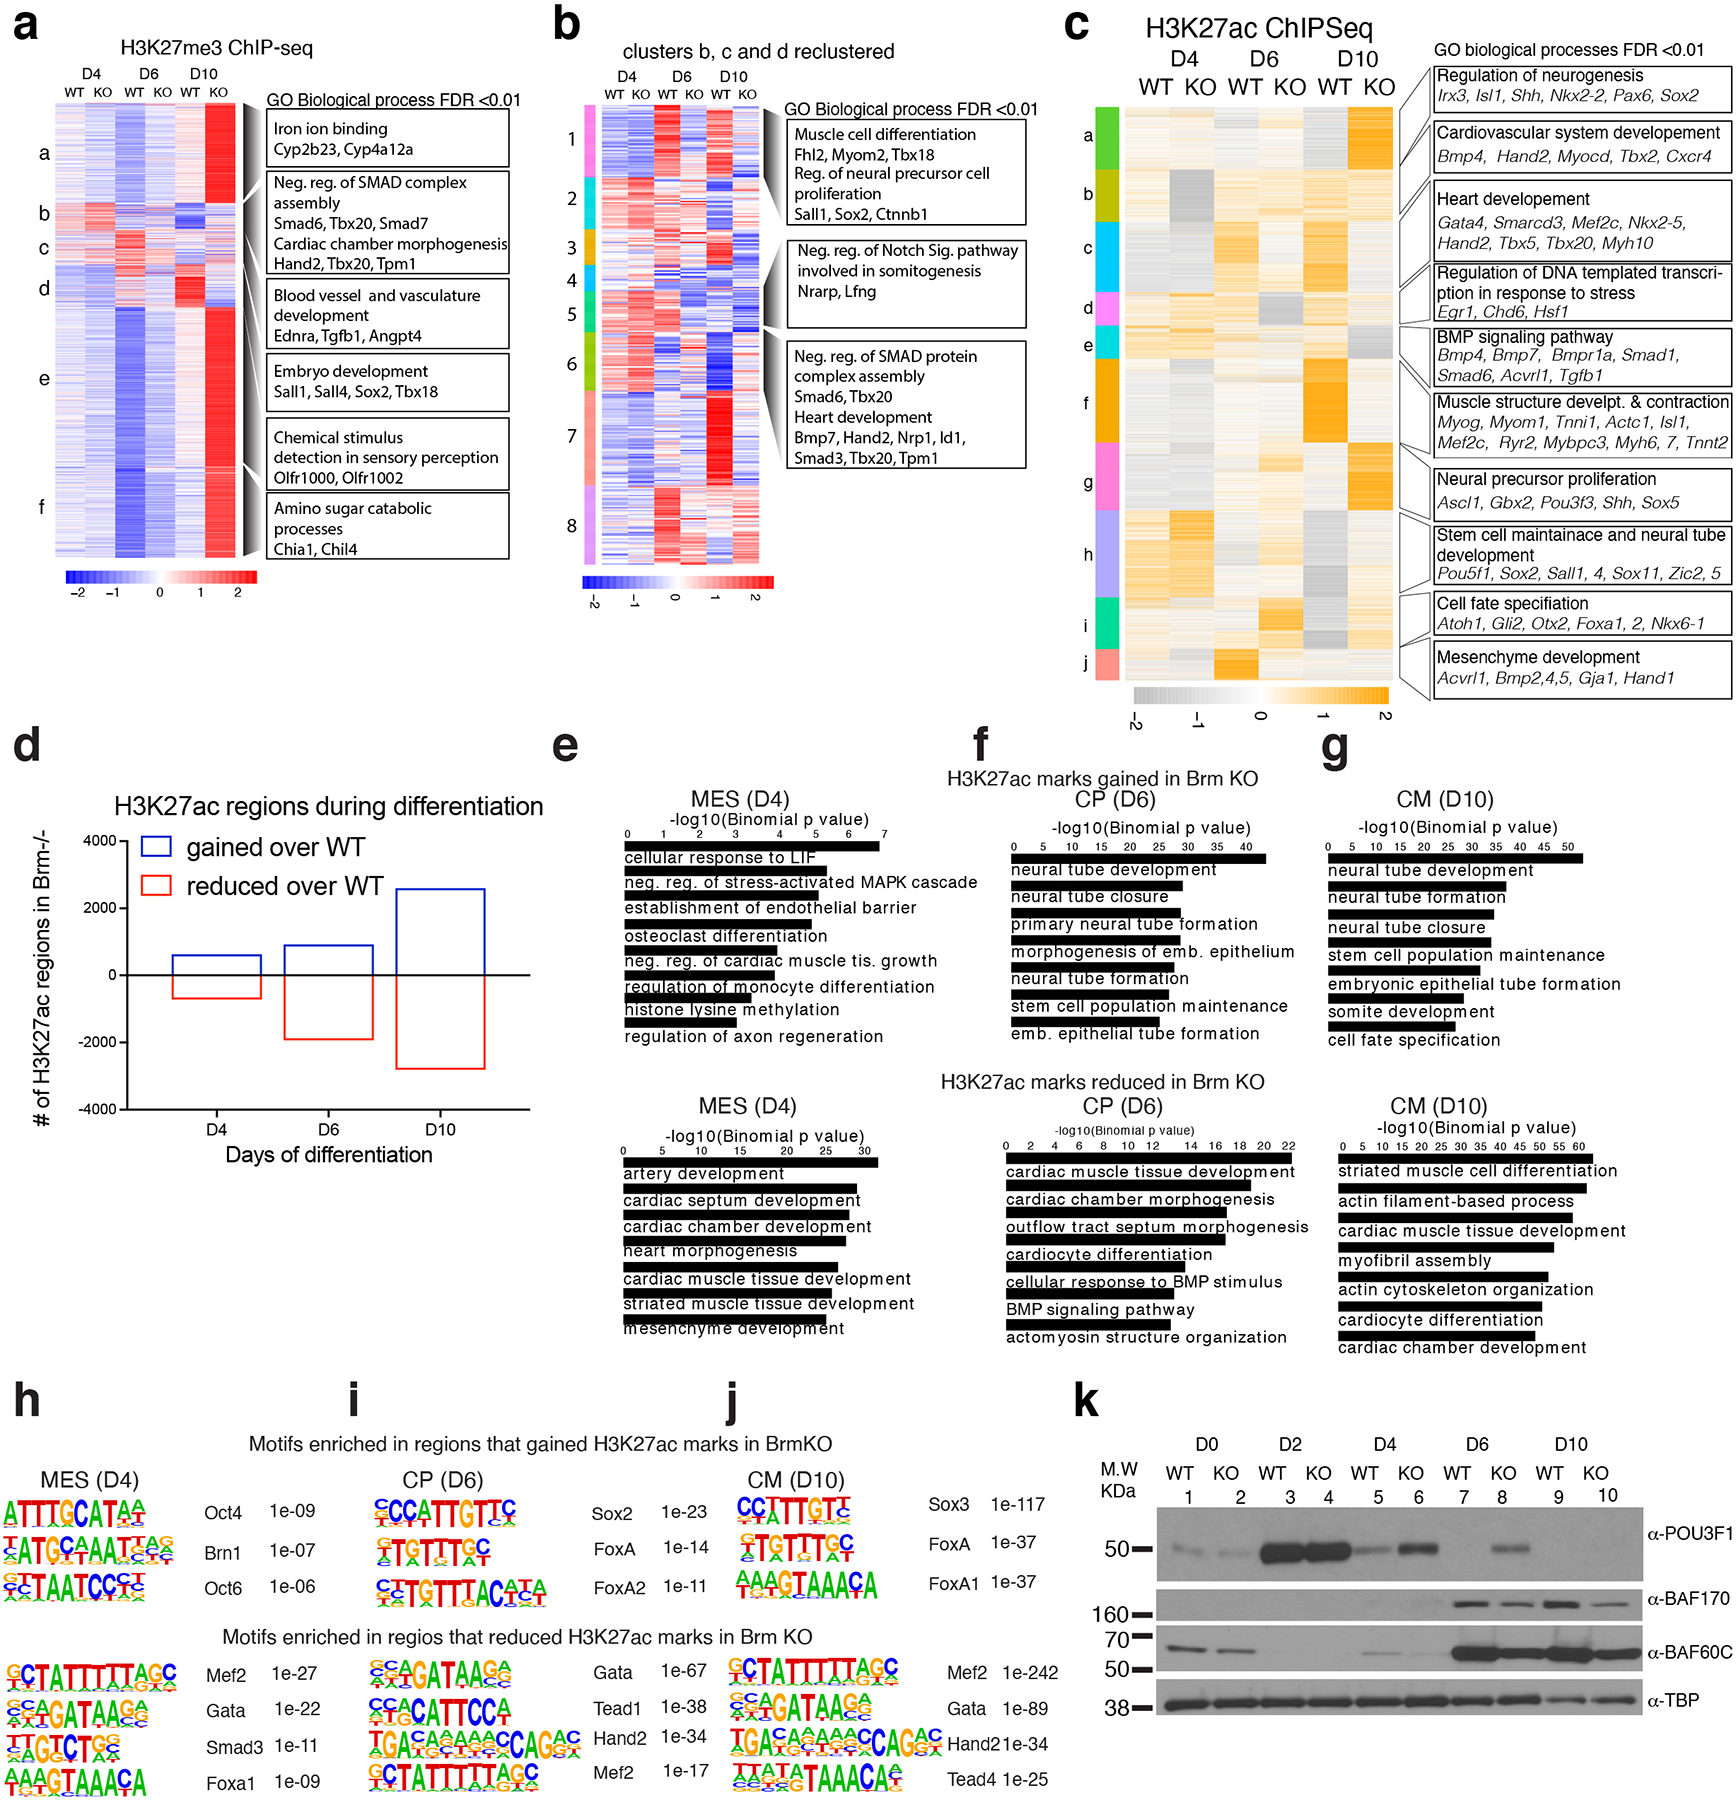
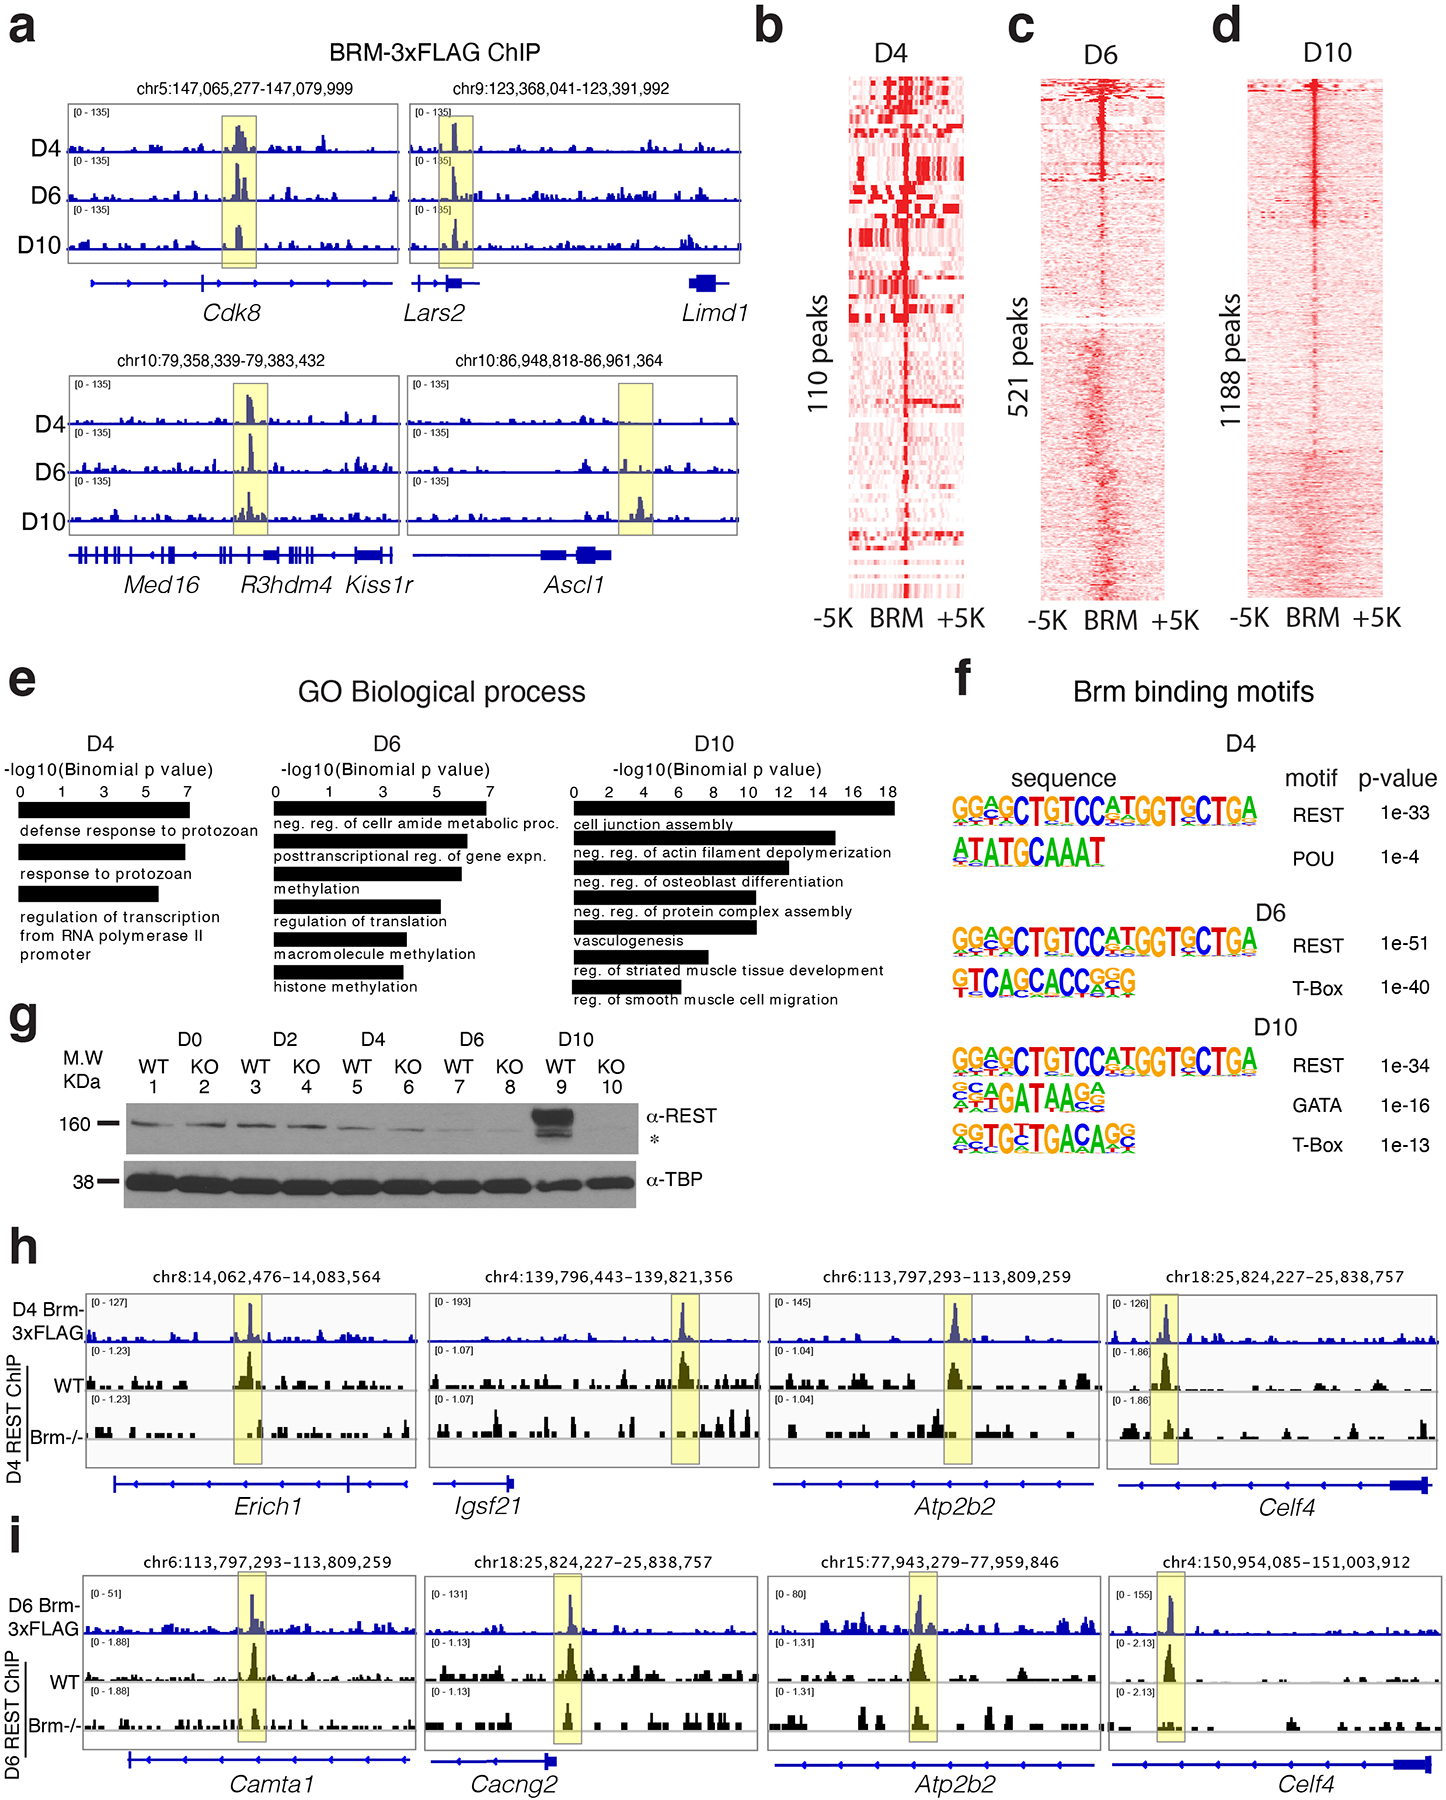
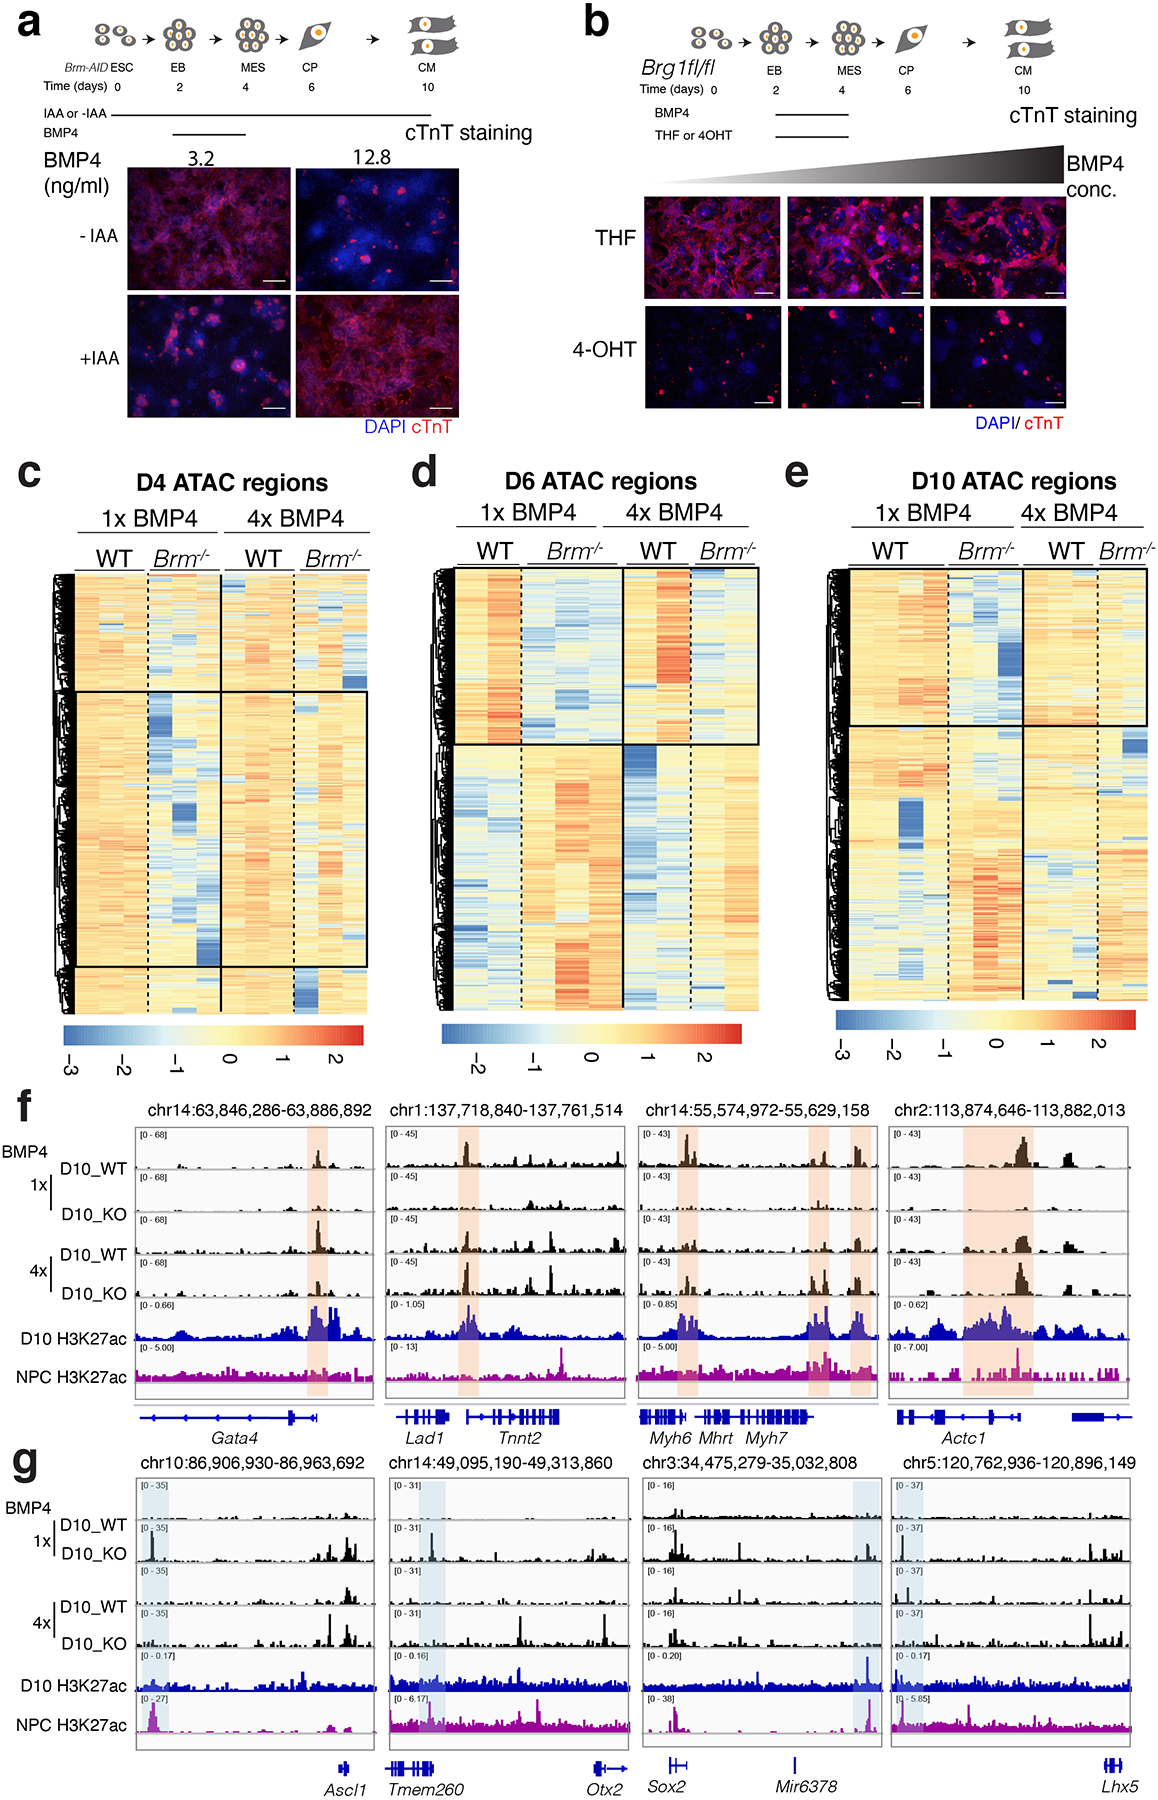
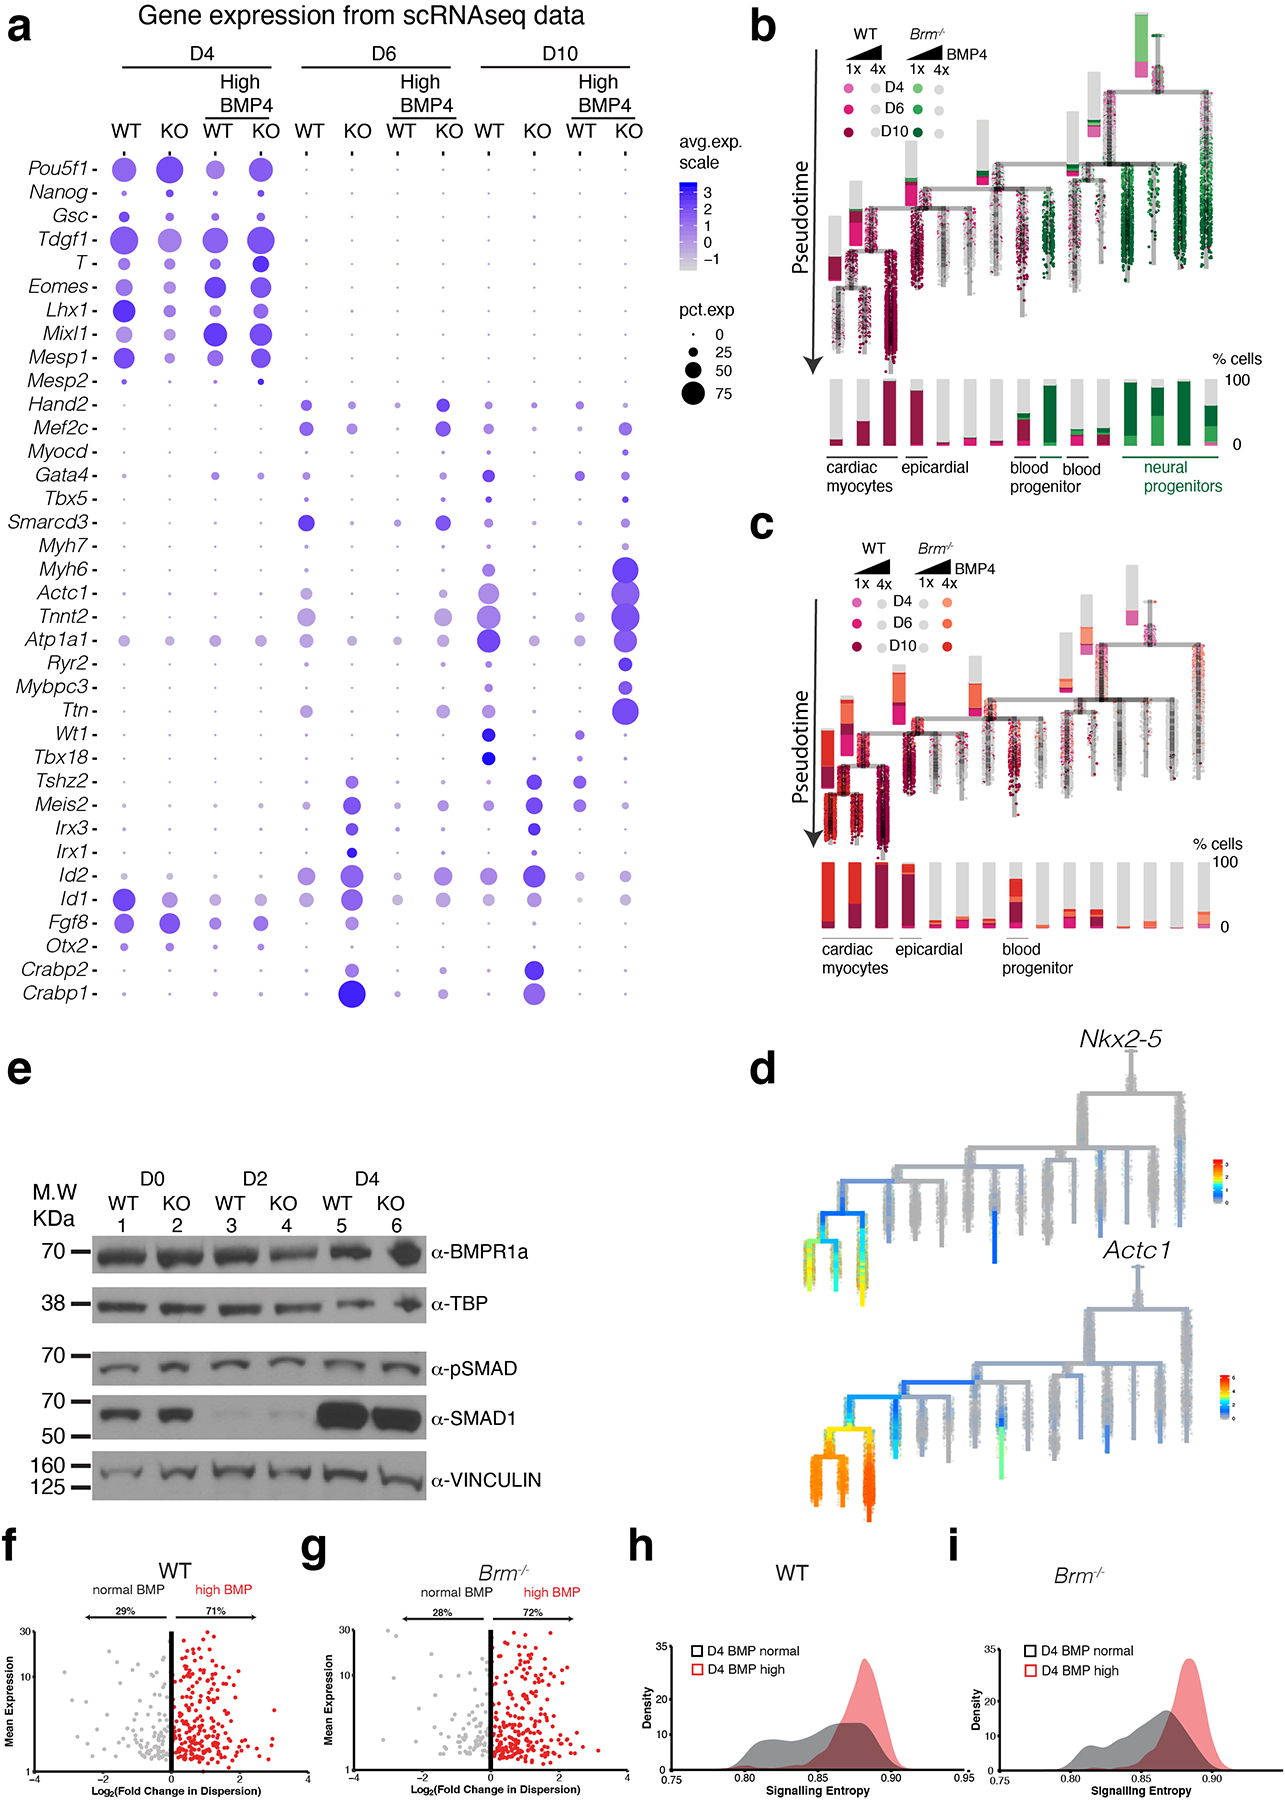
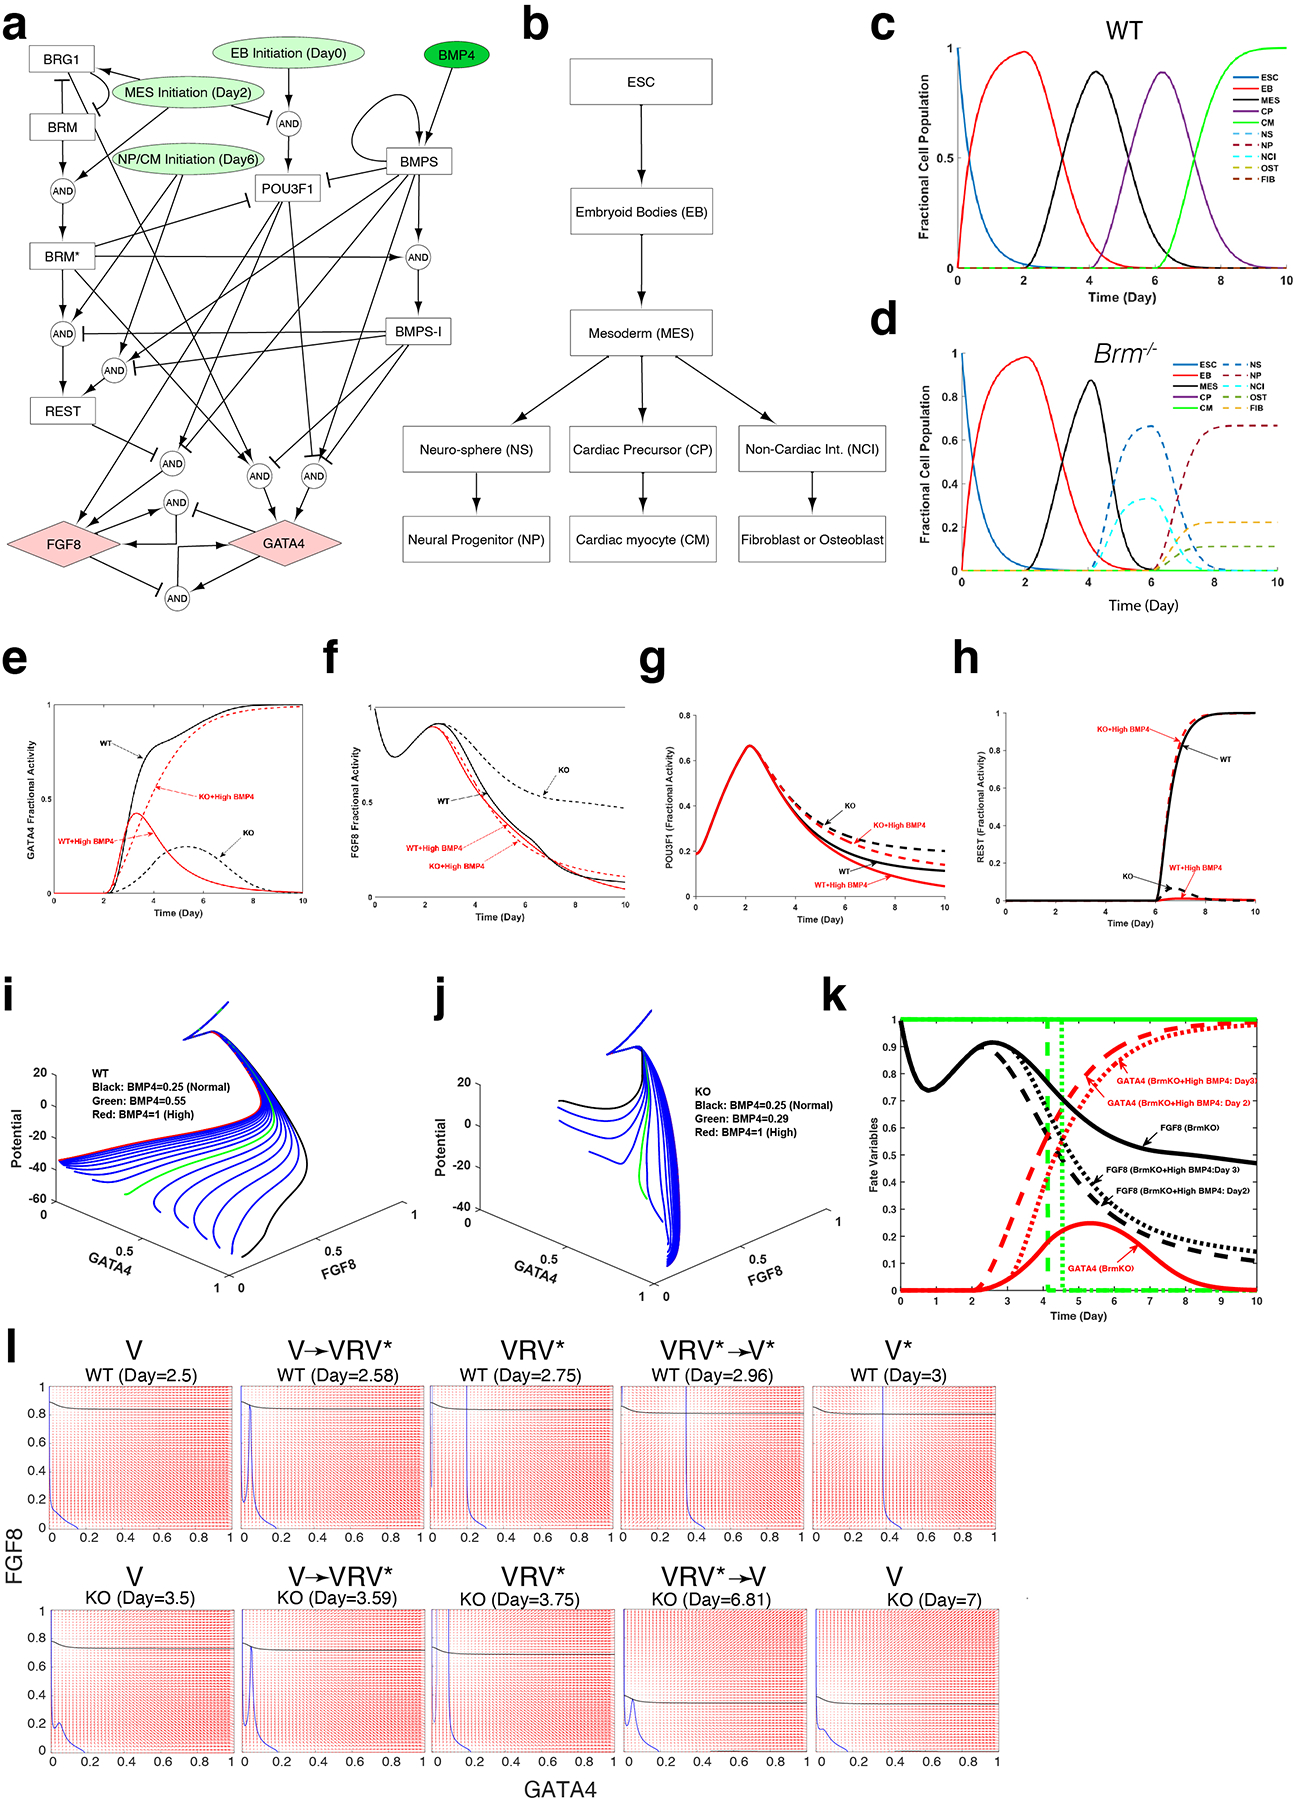
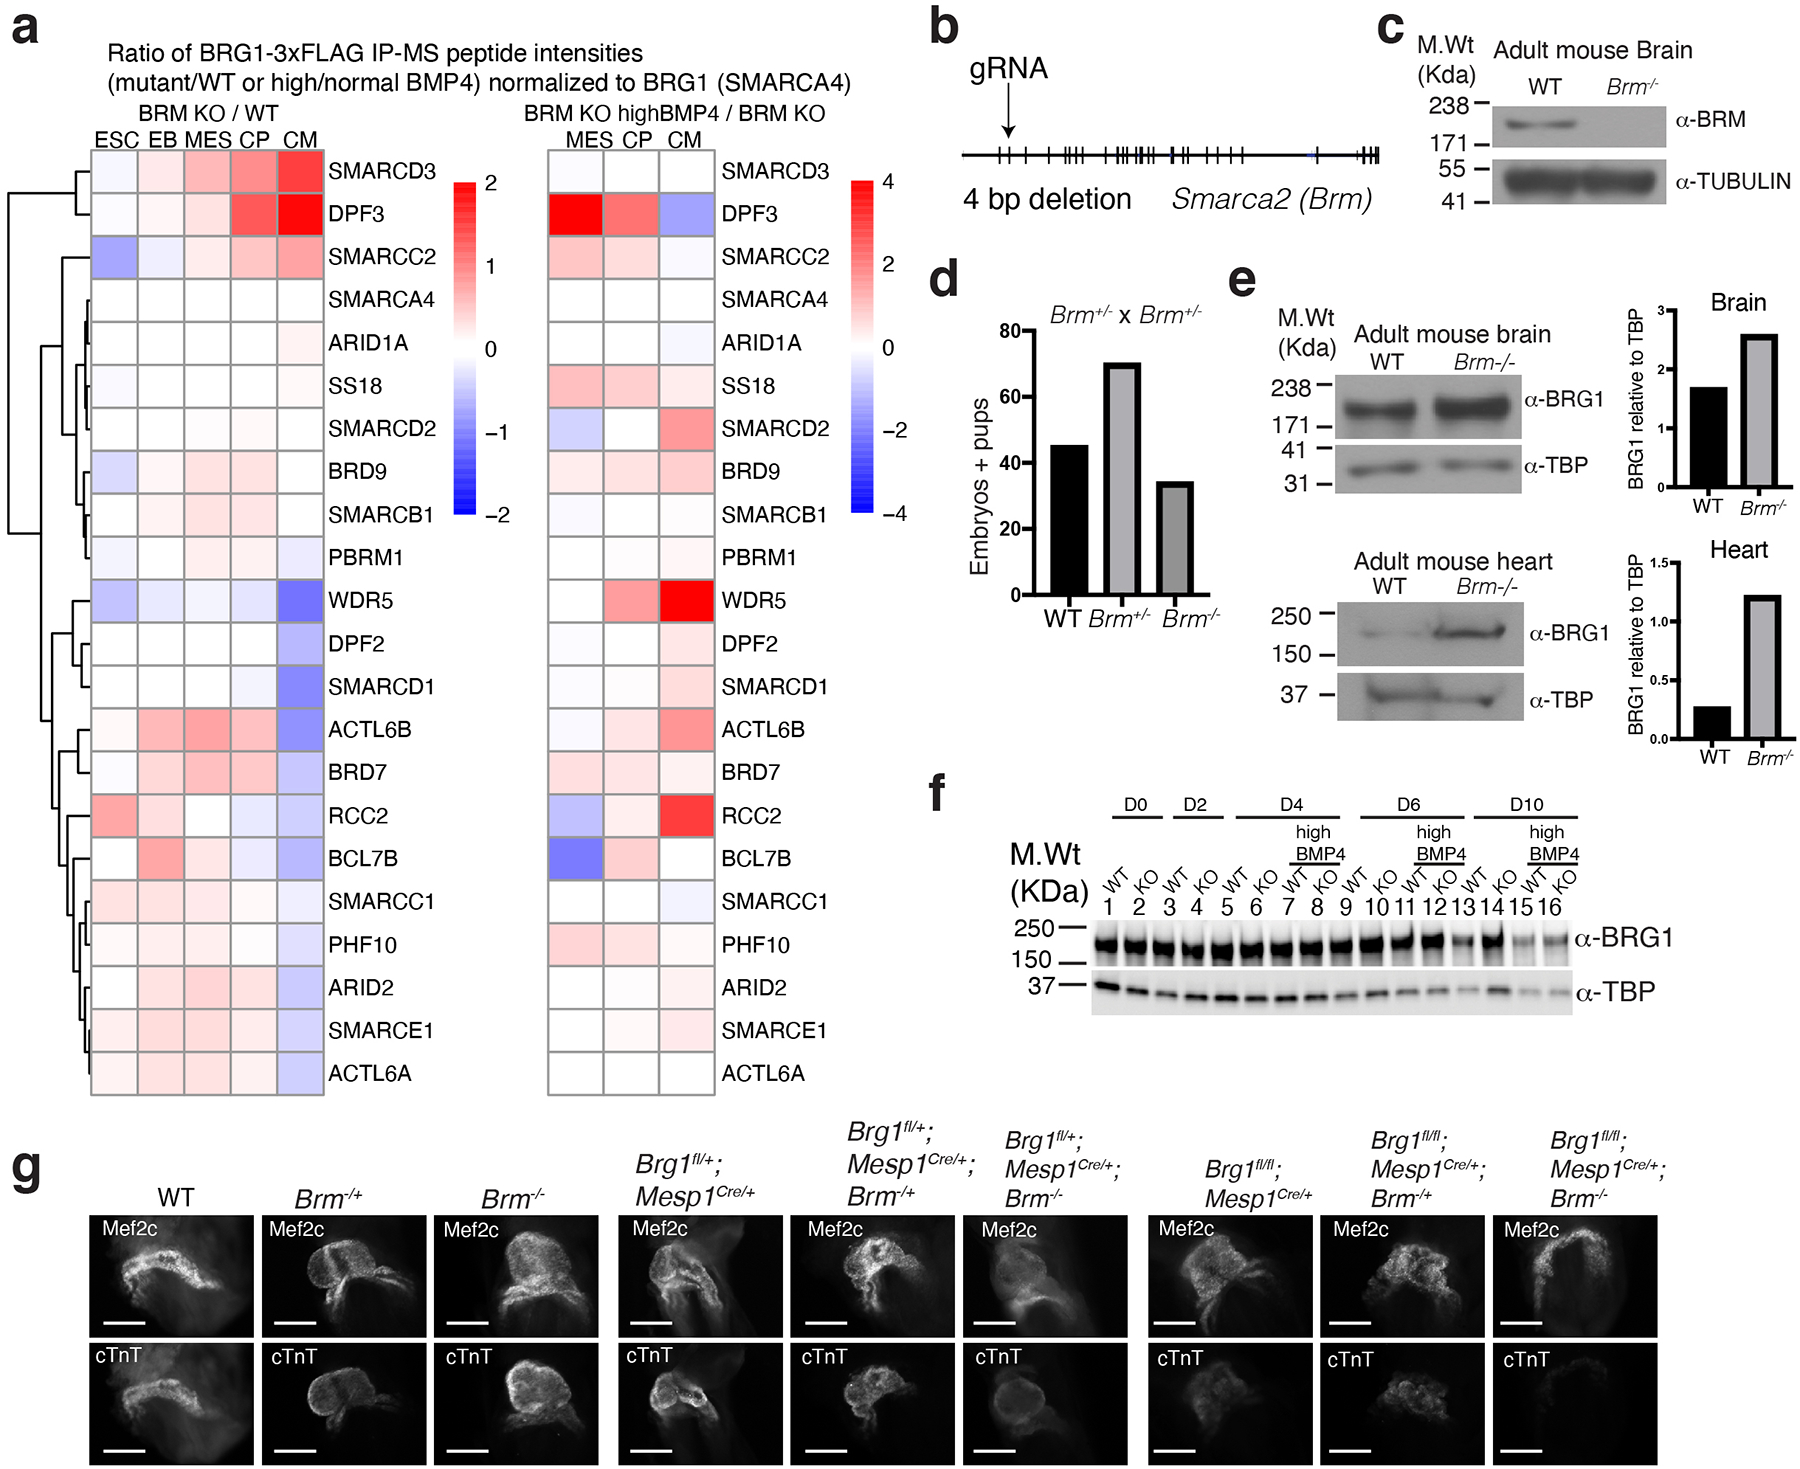
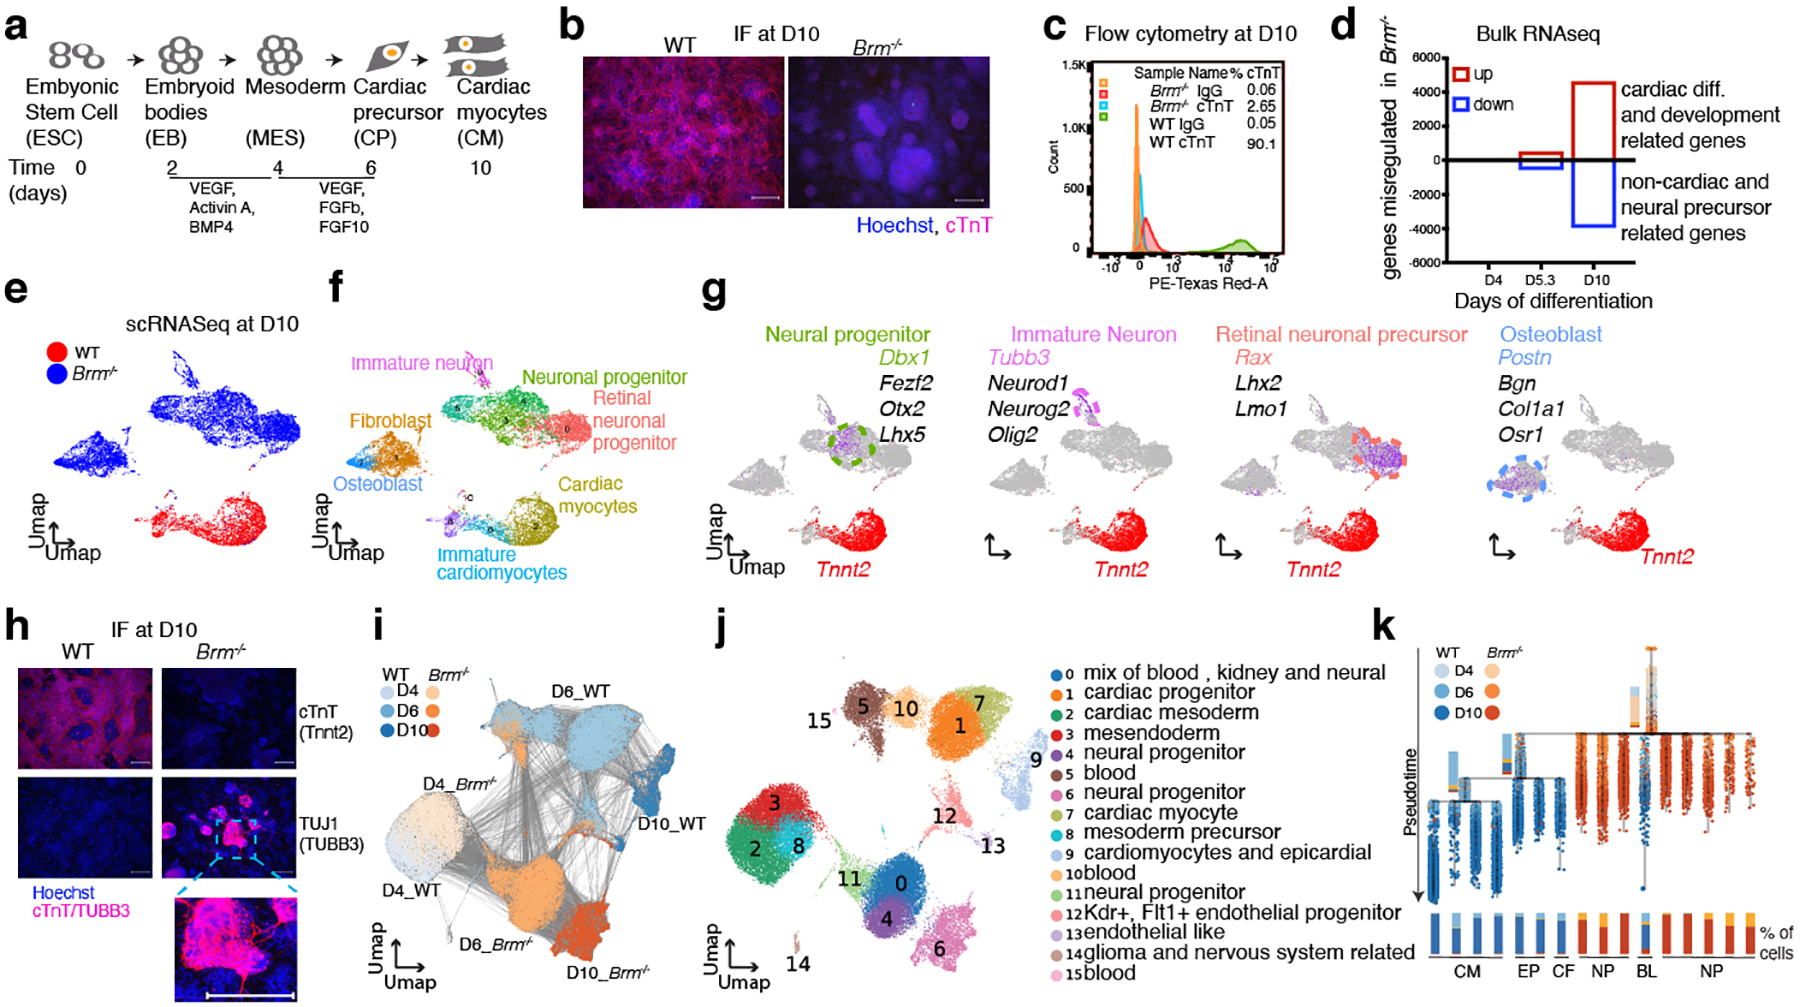
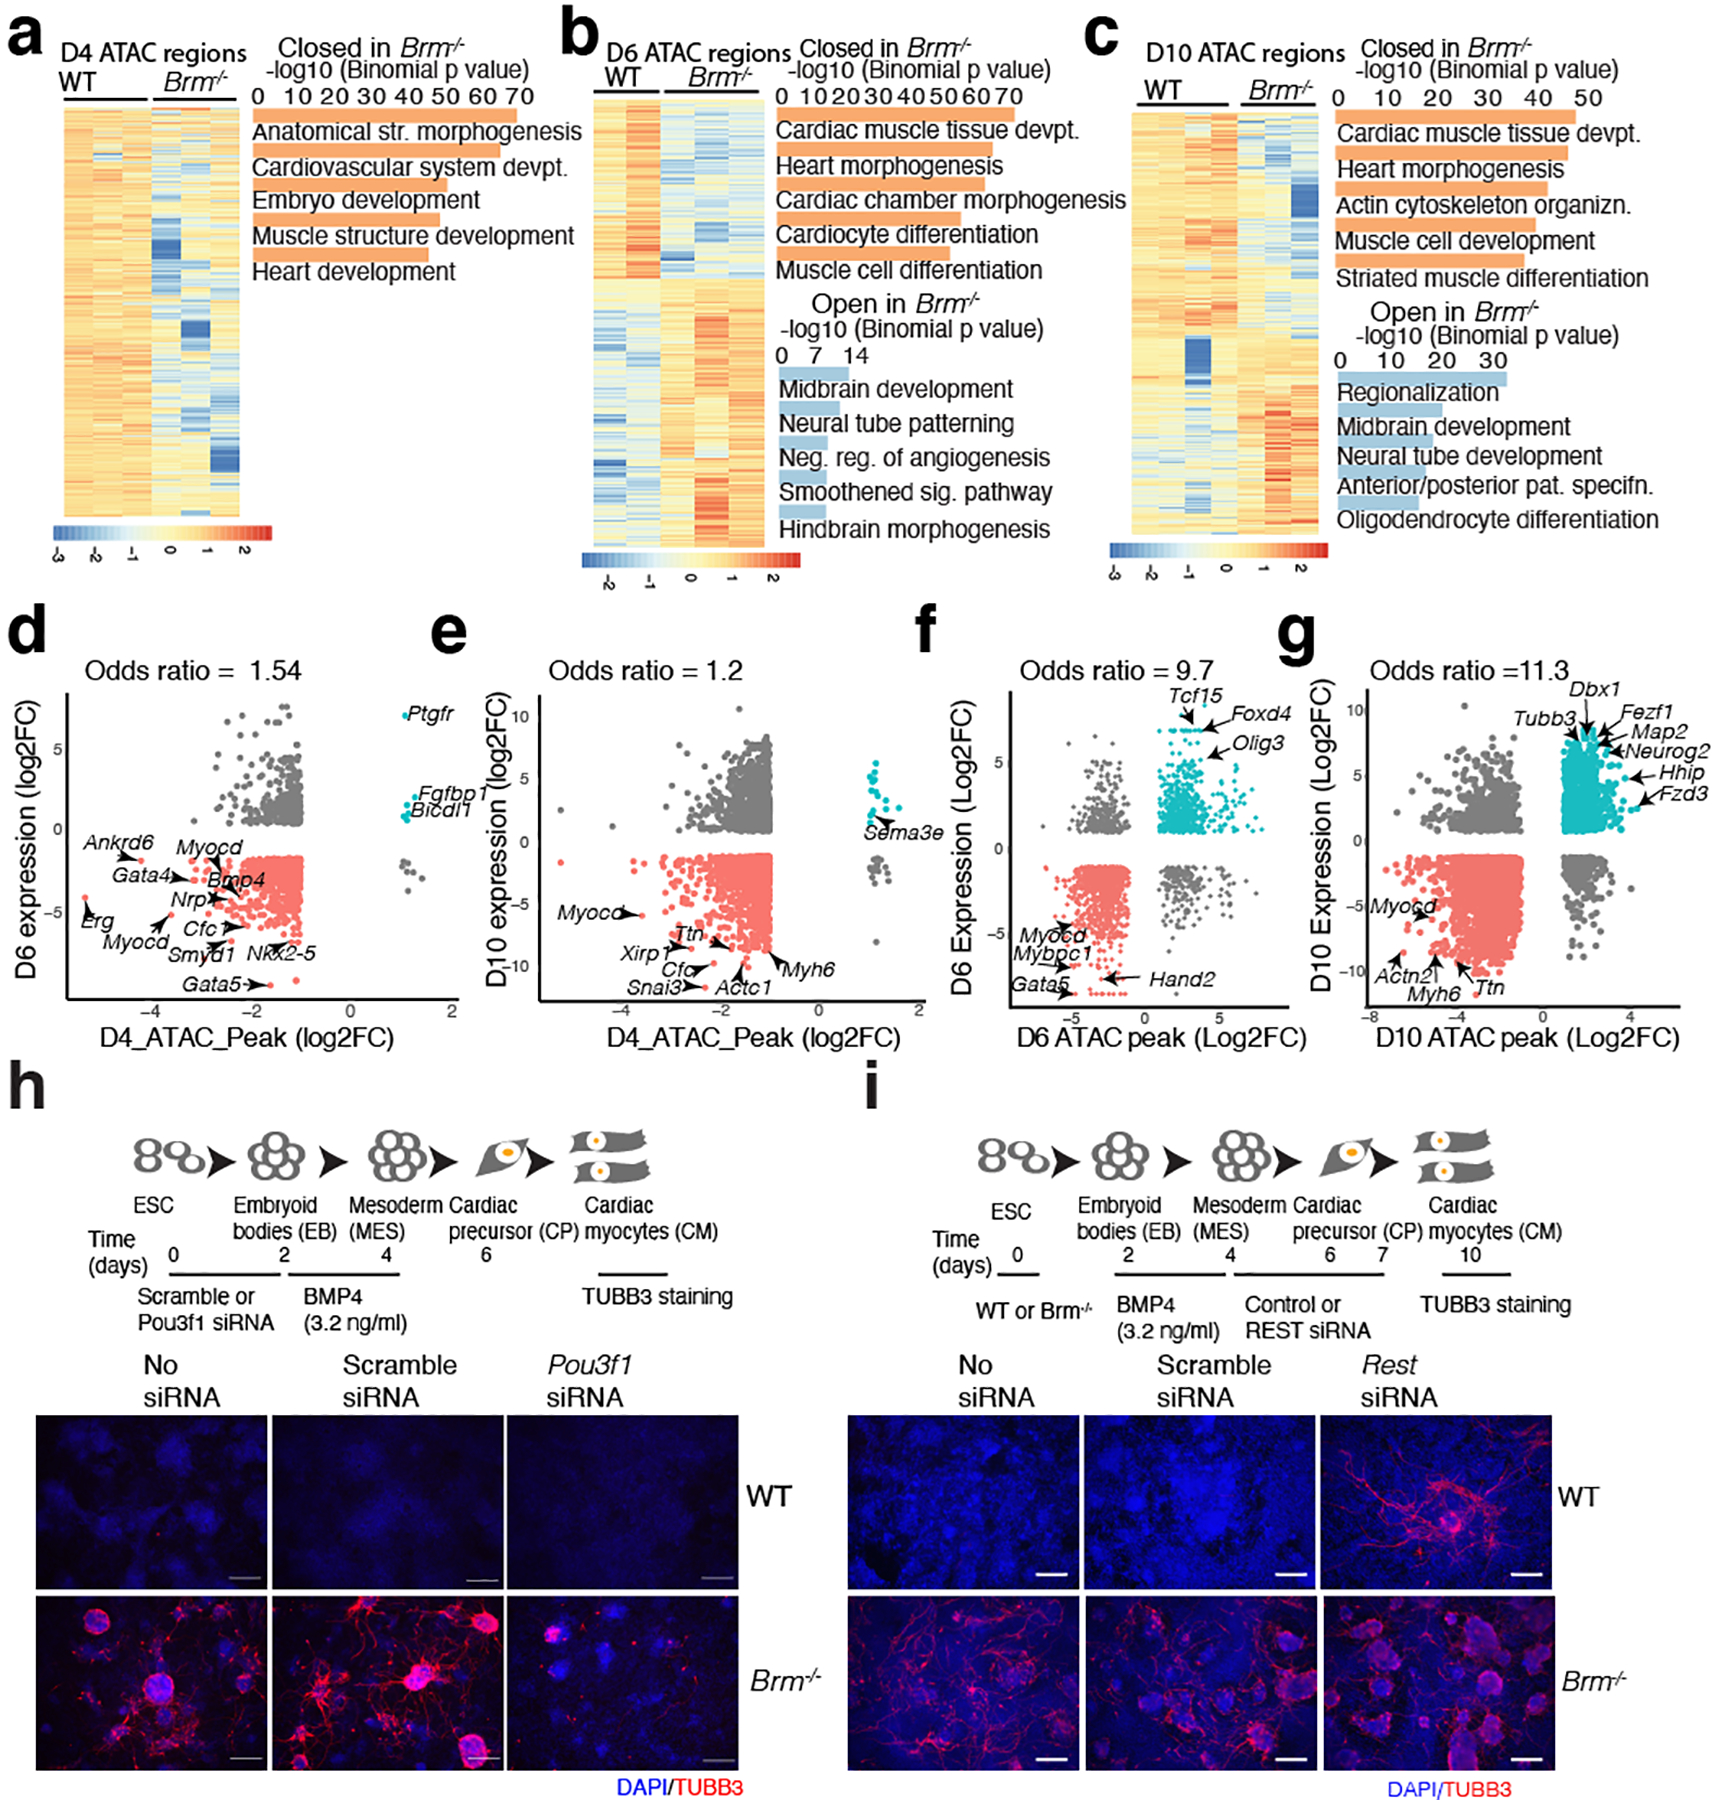
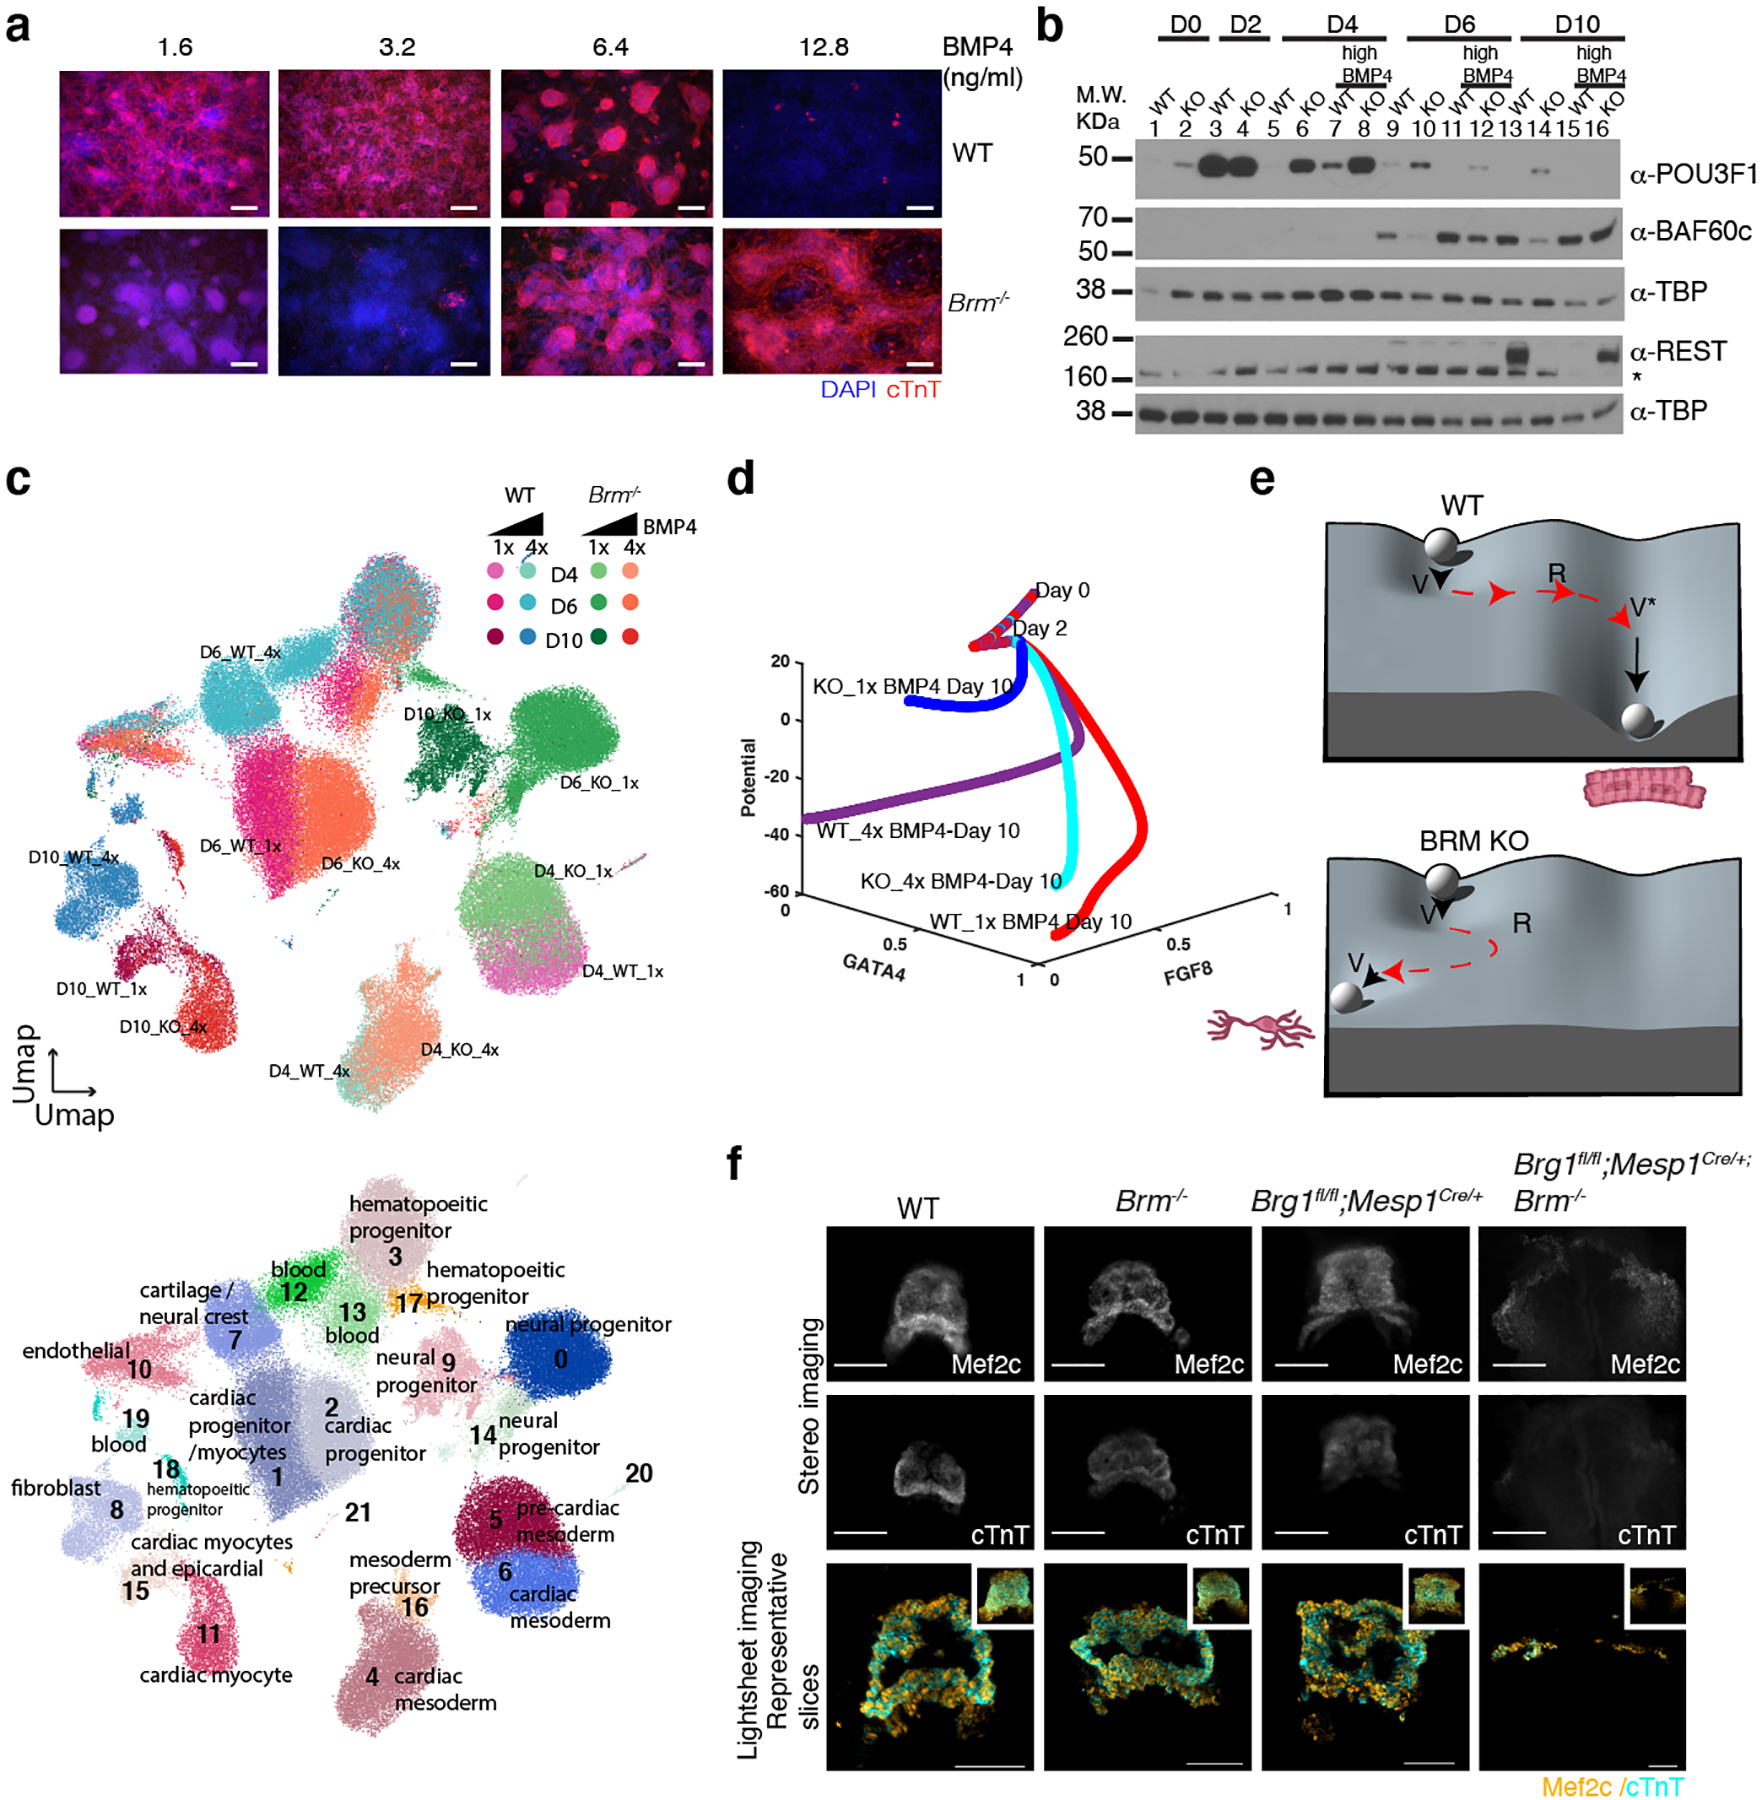
Differentiation proceeds along a continuum of increasingly fate-restricted intermediates, referred to as canalization1,2. Canalization is essential for stabilizing cell fate, but the mechanisms that underlie robust canalization are unclear. Here we show that the BRG1/BRM-associated factor (BAF) chromatin-remodelling complex ATPase gene Brm safeguards cell identity during directed cardiogenesis of mouse embryonic stem cells. Despite the establishment of a well-differentiated precardiac mesoderm, Brm-/- cells predominantly became neural precursors, violating germ layer assignment. Trajectory inference showed a sudden acquisition of a non-mesodermal identity in Brm-/- cells. Mechanistically, the loss of Brm prevented de novo accessibility of primed cardiac enhancers while increasing the expression of neurogenic factor POU3F1, preventing the binding of the neural suppressor REST and shifting the composition of BRG1 complexes. The identity switch caused by the Brm mutation was overcome by increasing BMP4 levels during mesoderm induction. Mathematical modelling supports these observations and demonstrates that Brm deletion affects cell fate trajectory by modifying saddle-node bifurcations2. In the mouse embryo, Brm deletion exacerbated mesoderm-deleted Brg1-mutant phenotypes, severely compromising cardiogenesis, and reveals an in vivo role for Brm. Our results show that Brm is a compensable safeguard of the fidelity of mesoderm chromatin states, and support a model in which developmental canalization is not a rigid irreversible path, but a highly plastic trajectory.


Figures

Extended Data Fig. 1.
Extended Data Fig. 1.. Loss of BRM leads to expression of neural genes in cardiac differentiation and has minimal effect in neural differentiation
a, Brm mRNA expression during cardiac differentiation from Wamstad et al.. b, Violin plots of Brm expression of single cell data from this study. c, Western blot of WT and BRM KO cells at D10 of cardiac differentiation. d, Bulk RNAseq analysis of WT and BRM KO cells at D4, D5.3 and D10 stages of differentiation. Counts per million (CPM) average of three biological replicates were plotted as a ratio of KO over WT. Gene Ontology (GO) biological process enrichment was determined by GOElite. e, Dots plots showing expression of indicated genes from D10 WT and Brm–/– single cell RNA-seq data. f, Scheme of neural precursor differentiation from ES cells and TUBB3 immunostaining of WT and Brm−/− cells differentiated to neural precursor (D13) cells. Scale bars are 200μm.
Extended Data Fig. 2.
Extended Data Fig. 2.. BRM prevents acquisition of neural fate after pre-cardiac mesoderm formation
a-d, Single cell RNAseq data from D4, D6 and D10 of cardiac differentiation projected on UMAP space showing PAGA connectivity lines projected for WT (a) or Brm−/− (b), gene expression feature plots (c) and dot plots of quantitative bulk changes in gene expression between WT and Brm−/− cells at D4, D6 and D10 stages of differentiation for early developmental, cardiac mesoderm, cardiac precursors, cardiac myocytes, genes enriched in Brm−/− cells, and a select set of genes involved in neuroectoderm development (d). e, Feature plots of developmental trajectory analysis using URD for selected cardiac and neural genes. f-g, Pluripotency is unaffected in BRM KO cells. f, Immunostaining of WT and Brm−/− ES cells with indicated pluripotency markers. Scale bars are 2μM, magnification 63x. g, Single cell RNAseq of WT and Brm−/− cells in ESCs cluster together. h, Integration of single cell RNAseq data from D0 ESCs with D4, D6 and D10 scRNAseq datasets.
Extended Data Fig. 3.
Extended Data Fig. 3.. Loss of BRG1 early in differentiation leads to formation of non-cardiac cell types
a, Comparison of Brg1 and Brm expression during cardiac differentiation. b, Scheme of cardiac differentiation showing timing of induction with 4-hydroxy tamoxifen (4-OHT) or the control tetrahydrofuran (THF) and scRNA-seq. THF or 4-OHT was treated for 2 days to achieve complete Brg1 deletion. c-e, UMAPs of single cell RNA-seq data at D4 and D10 of differentiation of WT and conditional BRG1 KO genotypes (c), clusters with inferred cell types (d) and feature plots of expression of indicated genes (e). f, Dot plots comparing gene expression quantification of WT and conditional BRG1 KO at D4 and D10 of differentiation. g, Cardiac troponin T (cTnT) and TUBB3 immunostaining at D10 for WT and BRG1 cKO cells deleted at D4 of differentiation. Scale bars are 200μm. h, Integration of scRNAseq data of Brg1 cKO and Brm KO at D10 stage of differentiation.
Extended Data Fig. 4.
Extended Data Fig. 4.. BRM is required during cardiac mesoderm formation
a, Mean difference plots of ATAC-seq data plotting average log fold change between WT and Brm−/− cells and average log CPM (3 biological replicates each) at D0 and D2 of differentiation. Statistically significant (FDR <0.05) peaks showing log2 fold change >1, unchanged, and <1 are shown in red, black and blue respectively. b-c, ATAC-seq browser tracks showing WT and BRM KO chromatin accessibility at D4, D6 and D10 of cardiac differentiation along with H3K27ac active enhancer marks near cardiac genes (b) and indicated neural gene loci, along with neural precursor H3K27ac marks (c). d-e, BRM-mediated open and closed chromatin regions compared with cardiac and neural progenitor enhancers. Closed and open chromatin in Brm−/− at D6 (d) and at D10 (e) are compared with respective cardiac and neural progenitor enhancers. f, Motifs enriched at the open chromatin regions in WT and BRM KO cells at D4, D6, D10 differentiation stages. BRM activity is essential before D4 of differentiation. g, Auxin inducible degron mouse ES strain of BRM (Brm-AID) differentiated to cardiomyocytes at D10 and treated without (lane 1) or with auxin analog indole acetic acid (IAA) for indicated length of time shows rapid BRM degradation by western blot. h-i, Schematic of cardiac differentiation showing time of IAA treatment and beating at D10. Cells treated with IAA for indicated length of time (h) or a period of two days at a time (i) were analyzed by immunostaining of cardiac troponin T at D10. Scale bars are 200μm.
Extended Data Fig. 5
Extended Data Fig. 5. BRM loss leads to reduced H3K27ac marks near cardiac genes and increased H3K27ac marks near neural genes
a, Differential enrichment of H3K27me3 marks in WT and Brm−/− cells during cardiac differentiation displayed in the form of a heat map. b, Clusters b, c, and d were re-clustered and shown in a separate heat map (right). GREAT analysis of significant (Benjamini-Hochberg adjusted p-value (FDR) <0.01) GO biological processes (within 1Mb) enrichment for the clusters are on the right with representative genes shown. c, Heat map of significantly affected (FDR<0.05, fold change 2) H3K27ac peaks due to loss of BRM at D4, D6 and D10 of differentiation. GREAT GO biological processes enriched (within 1mb) are shown to the right of the clusters. d, Number of regions significantly affected in Brm−/− cells at D4, D6 and D10 of differentiation are plotted over WT. e-g, GO biological processes enriched for genes (within 1mb) near sites that gained (upper panels) or reduced (lower panels) H3K27ac marks in Brm−/− cells at D4 (e), D6 (f) and D10 (g) of differentiation. h-j, Motifs enriched at the differentially enriched sites in Brm−/− cells are shown at D4 (h), D6 (i) and D10 (j) stages of cardiac differentiation respectively. k, Western blot of indicated proteins in WT or BRM KO cells during D0, D2, D4, D6 and D10 of cardiac differentiation
Extended Data Fig. 6.
Extended Data Fig. 6.. BRM regulates REST binding during cardiac differentiation
a-d, Genome browser (IGV) tracks showing BRM-3xFLAG ChIP-seq over indicated loci (a) and heat maps of BRM-3xFLAG ChIP-seq over identified BRM binding sites at D4 (b), D6 (c) and D10 (d) of differentiation. e-f, GO biological processes enriched (within 100kb) (e) and motifs enriched (f) in BRM binding sites at the indicated differentiation stages. g, Western blot of REST expression in WT or BRM KO cells during D0, D2, D4, D6 and D10 of cardiac differentiation h-i, Genome browser (IGV) tracks of Brm-3x FLAG ChIP seq near neural related genes over indicated genomic loci and REST ChIPseq in WT and Brm−/− cells at D4 (h) and D6 (i) of cardiac differentiation.
Extended Data Fig. 7.
Extended Data Fig. 7.. BMP4 restores WT-like chromatin accessibility in Brm−/− cells
a, Scheme of cardiac differentiation showing timing of IAA and BMP4 addition. Cardiac troponin T (cTnT) immunostaining of an auxin inducible degron strain of BRM (Brm-AID) at D10 of differentiation induced with two different BMP4 concentrations with or without IAA present throughout the differentiation. b, Immunostaining with cTnT shows that Brg1 loss is not rescued by addition of increasing the amount of BMP4. Scale bars are 200μm. c-e, Heat maps showing differential enrichment of ATAC-seq peaks of WT and BRM KO cells at D4 (c), D6(d) and D10 (e) of cardiac differentiation with normal (1x) and high (4x) BMP4 concentrations. Boxed regions show restoration of WT-like chromatin in KO cells at high BMP4 condition. Vertical lanes show replicate data. f-g, Browser tracks show chromatin accessibility in WT and Brm−/− cells along with H3K27ac marks in cardiomyocytes and neural precursor cells (purple track) near indicated cardiac genes (f) and neural genes (g).
Extended Data Fig. 8.
Extended Data Fig. 8.. BMP4 restore WT-like gene expression in Brm−/− cells and increases gene expression noise in D4 cells
a, Dot plots showing quantitative changes in gene expression between WT and Brm−/− cells induced with normal (1x) or high (4x) BMP4 concentrations at D4, D6 and D10 stages of differentiation for early developmental, cardiac mesoderm, precursor, and myocyte genes enriched in BRM KO cells. b-d, Transcriptional trajectory analysis of WT and BRM KO cells showing the genotype representation in normal BMP4 concentration (b), normal BMP4 for WT and 4x BMP4 concentration for BRM KO cells (c) and URD feature plots of expression of Nkx2-;5, and Actc1 (d). e, Western blots showing BMP receptor, Smad1 and phospho-SMAD expression during D0 to D4 of cardiac differentiation, f-g, Scatter plots of single cell RNASeq data showing mean gene expression and variance from mean gene expression at D4 stage of differentiation for WT (f) and Brm−/− cells (g) in low and high BMP4 conditions. h-i, Signaling entropy calculated similarly for WT (h) and Brm−/− cells (i) with low and high BMP4 conditions.
Extended Data Fig. 9.
Extended Data Fig. 9.. Computational model using logic-based differential equations supports BRM’s role in cardiac and neural cell fate.
a, The model interaction graph including signaling components and transcription factors critical for cardiac differentiation. b-d, The model outputs determine the cell fate (b) and temporal variations in fractional cell population during cardiac differentiation for WT (c) and Brm−/− (d) cells. e-h, Model-predicted fractional activities of cardiac and neural transcription factors GATA4 (e), and FGF8 (f), as well as mediators of BRM POU3F1 (g) and REST (h) during cardiac differentiation. i-j, Model-predicted variations of quasi-potential landscape and subsequent path of WT (i) and Brm−/− (j) cells induced with different levels of BMP4 from normal (3.2 ng/ml) to high (12.8 ng/ml) during cardiac differentiation. k, Model simulation shows that Brm−/− cells (solid line) induced with high BMP4 at D3 (dotted line) would follow a path similar to that induced with D2 (dashed line) as computed from the GATA4 (red) and FGF8 (black) fractional activities, forming cardiomyocytes. Green line show fate variables with neural fate at 1 and cardiac fate at 0 and predicts D4 as the time of fate divergence. l, Phase portrait plots of bifurcation analysis of WT (upper panels) and BRM KO (lower panels) during indicated differentiation days. As differentiation progresses, WT cells undergo two sequential saddle-node bifurcations (V-> VRV* and VRV*-> V*) completing a hysteresis, while BRM KO cells undergo a saddle node bifurcation (V->VRV*) that reverses with a delay in differentiation timing (VRV*->V) with a dampened hysteresis. V= valley, R=ridge and V*= valley different from V
Extended Data Fig. 10.
Extended Data Fig. 10.. BRG1 compensates for BRM loss in vivo
a, Anti-FLAG affinity purification of BRG1- complex followed by mass spectrometry. BRG1 (bait protein) normalized peptide intensity ratios of Brm−/− (Brg1-3xFLAG;Brm−/−) over WT (Brg1-3x FLAG) are plotted at five different stages of differentiation (left panel) and Brm−/− cells at high BMP4 over normal BMP4 at MES, CP and CM stages of differentiation (right panel). b, The exon–intron organization of Smarca2 (encodes BRM) and the site of guide RNA that targets exon2. The mouse strain from this transfection had a 4 bp deletion leading to premature stop codon. c, Western blot with anti-BRM antibody showing loss of BRM protein in Brm−/− mouse brain whole cell extract. α-tubulin is used as a loading control. d, Heterozygous Brm mouse mating resulted in pups and embryos at expected mendelian ratios. e-f, Western blot with antibody against BRG1 shows partial BRG1 compensation in absence of BRM in adult mouse brain (upper panel) and heart (lower panel) with quantifications shown to the right (e), but no compensation in the in vitro cardiac differentiation system (f) g, E 8.5 mouse embryos stained with MEF2c or cardiac troponin T (cTnT) for the indicated genotypes. Scale bars are 200μm.
Fig. 1.
Fig. 1.. BRM activates cardiac gene expression programs and prevents acquisition of neural fate during directed cardiomyocyte differentiation
a-c, Cardiac differentiation scheme (a), assessment of cardiomyocytes at D10 of cardiac differentiation by immunofluorescence (b) and flow cytometry (c) of cardiac Troponin T (cTnT). d, Bulk RNA-seq data showing number of significantly de-regulated genes in BRM KO cells (FDR<0.05 and fold change > 2) at D4 (mesoderm), D5.3 (cardiac precursor) and D10 (cardiomyocyte) stages of differentiation. Single cell RNAseq gene expression projected on a UMAP space for WT and Brm−/− at D10 (e), inferred cell types (f) based on the marker genes highlighted (g). h, Immunofluorescence of cTnT and pan-neural progenitor marker TUBB3 (TUJ1) at D10. Scale bars are 200μm. i, Time course of scRNAseq data from D4, D6 and D10 projected on UMAP space showing days of differentiation of both WT and Brm−/− cells. Lines connecting cells are derived from a partition-based graph abstraction (PAGA) algorithm that reconciles clustering with cell lineage trajectory inference. j, PAGA clusters with inferred cell types. k, Transcriptional trajectory analysis from single cell data using URD showing stepwise transition of WT cells from D4 to D10, and sudden acquisition of neural fate in BRM KO cells. CM: cardiomyocyte, EP: epicardial, CF: cardiac fibroblast, NP: neural precursor, BL: blood cells.
Fig. 2.
Fig. 2.. BRM modulates regulatory chromatin accessibility near cardiac and neural genes and modulates POU3F1 and REST to prevent neurogenesis during cardiac differentiation
a-c, Heat maps of significantly altered ATAC-seq peaks in WT and BRM KO at D4 (a), D6 (b) and D10 (c). GREAT enrichment (two nearest genes within 100Kb) of significant (Benjamini-Hochberg adjusted p-value (FDR) <0.01) gene ontology (GO) biological processes shown on the right. d-g, ATAC-seq peak strengths are correlated with the neighboring BRM-regulated genes (within 100Kb, FDR<0.05, ±2 fold) for D4 ATAC peaks correlated with D6 (d) and D10 (e) and at respective ATAC peaks correlated with D6 (f) and D10 (g) gene expression. Scheme of Pou3f1 (h) or REST (i) knockdown during cardiac differentiation followed by TUBB3 immunostaining of control, scramble and knockdown cells at D10. Scale bars are 200μm.
Fig. 3.
Fig. 3.. Loss of Brm is compensable in vitro and in vivo
a, Immunostaining of WT and Brm−/− cells in presence of increasing concentrations of exogenous BMP4. BMP4 treatment occurred at D2 to D4 of differentiation. Scale bars are 200μm. b, Western blot showing repression of POU3F1 and re-expression of REST and BAF60c in presence of high BMP4 in BRM KO cells. c, Single cell RNA-seq data projected on UMAP space showing both WT and BRM KO genotypes clusters (upper panel) with inferred cell types (lower panel) at D4, D6 and D10 of differentiation induced with normal (1x, 3.2 ng/ml) and high (4x, 12.8ng/ml) BMP4 concentrations. d, A mathematical model using logic-based differential equations predicts the fate potential of WT and Brm−/− cells induced with normal and high BMP4 during cardiac differentiation. e, Waddington landscape depicting WT differentiation undergoing saddle-node bifurcations with hysteresis (red arrowheads), forming cardiomyocytes. Brm−/− cells differentiate undergoing a reversed saddle node bifurcation with dampened hysteresis to form neural progenitor cells. f, Mouse embryos at 8.5 days post coitum (E8.5) stained with MEF2c or cardiac troponin T (cTnT), (stereomicroscope images upper two panels, scale bars are 200μm.) and representative slices from light sheet microscopy images, with maximum intensity z-projections in inset (lower panel, scale bars are 100μm) for the indicated genotypes.

References

    1. Waddington CH The Strategy of the Genes, a Discussion of Some Aspects of Theoretical Biology. 20, (George Allen & Unwin Ltd, 1957).
    1. Ferrell JE Jr. Bistability, Bifurcations, and Waddington’s Epigenetic Landscape. Current Biology 22, R458–R466 (2012). - PMC - PubMed
    1. Reyes JC et al. Altered control of cellular proliferation in the absence of mammalian brahma (SNF2alpha). The EMBO Journal 17, 6979–6991 (1998). - PMC - PubMed
    1. Van Houdt JKJ et al. Heterozygous missense mutations in SMARCA2 cause Nicolaides-Baraitser syndrome. Nat Genet 44, 445–9–S1 (2012). - PubMed
    1. Tsurusaki Y et al. Mutations affecting components of the SWI/SNF complex cause Coffin-Siris syndrome. Nat Genet 44, 376–378 (2012). - PubMed

Publication types

MeSH terms