. 2022 Jan 10:12:810290.
doi: 10.3389/fimmu.2021.810290. eCollection 2021.

The Polygenic Map of Keloid Fibroblasts Reveals Fibrosis-Associated Gene Alterations in Inflammation and Immune Responses

Affiliations

The Polygenic Map of Keloid Fibroblasts Reveals Fibrosis-Associated Gene Alterations in Inflammation and Immune Responses

Yang Li et al. Front Immunol. .

Abstract

Due to many inconsistencies in differentially expressed genes (DEGs) related to genomic expression changes during keloid formation and a lack of satisfactory prevention and treatment methods for this disease, the critical biomarkers related to inflammation and the immune response affecting keloid formation should be systematically clarified. Normal skin/keloid scar tissue-derived fibroblast genome expression data sets were obtained from the Gene Expression Omnibus (GEO) and ArrayExpress databases. Hub genes have a high degree of connectivity and gene function aggregation in the integration network. The hub DEGs were screened by gene-related protein-protein interactions (PPIs), and their biological processes and signaling pathways were annotated to identify critical biomarkers. Finally, eighty-one hub DEGs were selected for further analysis, and some noteworthy signaling pathways and genes were found to be closely related to keloid fibrosis. For example, IL17RA is involved in IL-17 signal transduction, TIMP2 and MMP14 activate extracellular matrix metalloproteinases, and TNC, ITGB2, and ITGA4 interact with cell surface integrins. Furthermore, changes in local immune cell activity in keloid tissue were detected by DEG expression, immune cell infiltration, and mass CyTOF analyses. The results showed that CD4+ T cells, CD8+ T cells and NK cells were abnormal in keloid tissue compared with normal skin tissue. These findings not only support the key roles of fibrosis-related pathways, immune cells and critical genes in the pathogenesis of keloids but also expand our understanding of targets that may be useful for the treatment of fibrotic diseases.

Keywords: fibroblasts; genome-wide expression; immune response; inflammation; keloid; molecular alterations.


Conflict of interest statement

The authors declare that the research was conducted in the absence of any commercial or financial relationships that could be construed as a potential conflict of interest.

Figures

Figure 1
Figure 1
Immune cell infiltration results and correlation difference between keloid and normal fibroblast. (A) Bubble plot for comparison of the immune cell enriched z-scores difference between keloid and normal fibroblast. Red color indicates a higher immune cell-type z-scores in keloid fibroblast as compared with normal skin/scar fibroblast, while green color indicates a lower z-scores. The size of the circle represents the log2 fold change (log2FC) of the z-scores. (B) Pearson correlation of tumor estimated immune scores and immune cell GSVA z-scores of each samples between keloid and normal skin/scar fibroblast. Only shown different significant results between two group samples. Full results refer to Supplementary Figure S1 . (AE, ArrayExpress; GEO, Gene Expression Omnibus; KF, keloid fibroblast; CtrlF, normal skin/scar fibroblast).
Figure 2
Figure 2
Screening critical DEGs through PPI plot. Subset DEGs with P value < 0.01. PPI applied with protein score_threshold > 400 and degree > 2.
Figure 3
Figure 3
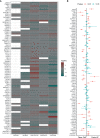
Log2FoldChanges (log2FC) and mean difference of 81 hub DEGs. (A) Bubble plot for comparison of the Log2FC between keloid and normal fibroblast of 81 hub DEGs in every data set. Red color indicates a lower expression level in keloid fibroblast as compared with normal skin/scar fibroblast. While green color indicates a higher expression level. Blank dots indicate undetected probes or unmapped entrez gene IDs. (B) Estimates fixed effects of mean difference weighted by sample numbers with Hedges’g method for each gene’s group. And 95% confident interval is added at the two side of each own estimated effect size result. Significant P value acquired through two-tail of student’s t-test.
Figure 4
Figure 4
Changes in the proportion of local immune cells between keloid and normal dermal tissue. (A) Heatmap of median scaled of marked cells proportion aggregated by samples. (B) Computed centered log−ratios (CLR) on cluster/sample proportions for dimension reduction. (C) Heatmap of median scaled of marked cells proportion aggregated by clusters or immunocell types. (D) Dimension reduction plot colored with artificially annotated cell types. (E) Population frequencies of marked cells across samples and immunocell types. (F) Significant difference in the normalized frequency of immunocell types between keloid and normal samples.
Figure 5
Figure 5
Fibrosis mechanism of fibroblast during keloid formation. Schematic drawing of a fibroblast and its mechanical interaction with ECM. Under continuous stress and strain and low oxygen environment, the disappearance of the temporal protein TNC increases the interaction of integrins with ECM collagen or fibronectin. Fibroblasts are further activated, releasing more chemokines and growth factors, leading to an increase in ECM and fibrosis. At the same time, the increase of TIMPs and MMPs degrades collagen and fibronectin, forming a positive circulation, resulting in the formation and continuous increase of keloid, even invading the surrounding normal tissues. Main signaling pathways associated with integrins activation include the Rho, WNT and MAPK pathways.

References

    1. Caviggioli F, Maione L, Vinci V, Klinger M. The Most Current Algorithms for the Treatment and Prevention of Hypertrophic Scars and Keloids. Plast Reconstr Surg (2010) 3:1130–2. doi: 10.1097/PRS.0b013e3181e3b804 - DOI - PubMed
    1. Slemp AE, Kirschner RE. Keloids and Scars: A Review of Keloids and Scars, Their Pathogenesis, Risk Factors, and Management. Curr Opin Pediatr (2006) 4:396–402. doi: 10.1097/01.mop.0000236389.41462.ef - DOI - PubMed
    1. He Y, Deng Z, Alghamdi M, Lu L, Fear MW, He L. From Genetics to Epigenetics: New Insights Into Keloid Scarring. Cell Prolif (2017) 2:e12326. doi: 10.1111/cpr.12326 - DOI - PMC - PubMed
    1. Bock O, Schmid-Ott G, Malewski P, Mrowietz U. Quality of Life of Patients With Keloid and Hypertrophic Scarring. Arch Dermatol Res (2006) 10:433–8. doi: 10.1007/s00403-006-0651-7 - DOI - PubMed
    1. Del TD, Dedhia R, Tollefson TT. Advances in Scar Management: Prevention and Management of Hypertrophic Scars and Keloids. Curr Opin Otolaryngol Head Neck Surg (2016) 4:322–9. doi: 10.1097/MOO.0000000000000268 - DOI - PubMed

Publication types

MeSH terms