. 2022 Jan 10:9:782529.
doi: 10.3389/fcell.2021.782529. eCollection 2021.

Comprehensive Characterization of Tumor Purity and Its Clinical Implications in Gastric Cancer

Affiliations

Comprehensive Characterization of Tumor Purity and Its Clinical Implications in Gastric Cancer

Shenghan Lou et al. Front Cell Dev Biol. .

Abstract

Solid tumour tissues are composed of tumour and non-tumour cells, such as stromal cells and immune cells. These non-tumour cells constitute an essential part of the tumour microenvironment (TME), which decrease the tumour purity and play an important role in carcinogenesis, malignancy progression, treatment resistance and prognostic assessment. However, the implications of various purity levels in gastric cancer (GC) remain largely unknown. In the present study, we used an in-silico approach to infer the tumour purity of 2,259 GC samples obtained from our hospital and 12 public datasets based on the transcriptomic data. We systematically evaluated the association of tumour purity with clinical outcomes, biological features, TME characteristics and treatment response in GC. We found that tumour purity might be a patient-specific intrinsic characteristic of GC. Low tumour purity was independently correlated with shorter survival time and faster recurrence and significantly associated with mesenchymal, invasive and metastatic phenotypes. Integrating GC purity into a clinical prognostic nomogram significantly improved predictive validity and reliability. In addition, low tumour purity was strongly associated with immune and stromal cell functions. Fibroblasts, endothelial cells and monocytes were markedly enriched in low-purity tumours, serving as robust indicators of a poor prognosis. Moreover, patients with low GC purity may not benefit more from adjuvant chemotherapy. Our findings highlight that tumour purity confers important clinical, biological, microenvironmental and treatment implications for patients with GC. Therefore, a comprehensive evaluation of tumour purity in individual tumours can provide more insights into the molecular mechanisms of GC, facilitate precise classification and clinical prediction and help to develop more effective individualised treatment strategies.

Keywords: chemotherapy resistance; gastric cancer; prognosis; tumor microenvironment; tumor purity.


Conflict of interest statement

The authors declare that the research was conducted in the absence of any commercial or financial relationships that could be construed as a potential conflict of interest.

Figures
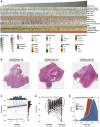
FIGURE 1
FIGURE 1
Tumour purity is an intrinsic property of gastric cancer (GC). (A) The landscape of clinicopathological and molecular characteristics associated with GC purity. (B) Representative slides of GC tissues. (C) Spearman correlation analysis of GC purity based on morphological assessment and the ESTIMATE method. (D) Distribution of GC purity evaluated based on morphological assessment and the ESTIMATE method. The upper and lower ends of the boxes represent the inter-quartile range of values. The lines in the boxes represent the median value. The whisker edges are the last data points within 1.5 of the inter-quartile range. The horizontal width of the violin represents the data density. (E) Density distribution of GC purity estimated based on morphological assessment and the ESTIMATE method.
FIGURE 2
FIGURE 2
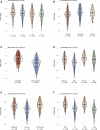
Gastric cancer (GC) purity is characterised by specific clinicopathological and molecular features. (A–F) Distribution of GC purity in terms of (A) TNM stage, (B) Lauren classification, (C) EM (epithelial and mesenchymal) subtype, (D) ACRG subtype, (E) Singapore subtype and (F) TCGA subtype. The upper and lower ends of the boxes represent the inter-quartile range of values. The lines in the boxes represent the median value. The whisker edges are the last data points within 1.5 of the inter-quartile range. The horizontal width of the violin represents the data density.
FIGURE 3
FIGURE 3
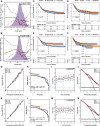
Prognostic value of tumour purity in gastric cancer. (A,B) Association of tumour purity and (A) overall survival (OS) and (B) recurrence-free survival (RFS) estimated using restricted cubic splines. (C–F) Kaplan–Meier curves for (C,D) OS and (E,F) RFS among different subgroups. p-values were obtained using the log-rank test. The + symbols in the panels indicate censored data. (G,K) Calibration plots of the nomogram for the predicted (G) OS and (K) RFS at 1, 3, 5, and 10 years. (H,L) Restricted mean survival (RMS) time curves for (H) OS and (L) RFS. (I,M) Time-dependent ROC curves for (I) OS and (M) RFS. (J,N) Decision curve analysis for the prediction of (J) OS and (N) RFS using the nomogram. HR, hazard ratio.
FIGURE 4
FIGURE 4
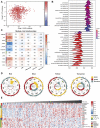
Biological features of tumour purity in gastric cancer. (A) Principal component analysis score plot for the gene expression profile underlying different purity levels. (B) Gene set enrichment analysis associated with purity levels. (C) Trait and module relationship analysis. Each row corresponds to a module eigengene and each column to a trait. The top number represents the biweight midcorrelation coefficient of each cell, and the corresponding p-values are mentioned in brackets. (D) Representative results of functional enrichment analysis for the yellow, blue, red and turquoise modules. (E) Heatmap of the reverse-phase protein arrays demonstrating purity-associated protein production. The coefficient was evaluated via Spearman correlation analysis.
FIGURE 5
FIGURE 5
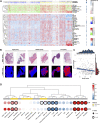
Tumour microenvironment features of tumour purity in gastric cancer (GC). (A) Heatmap of the infiltration level of stromal and immune cells among the purity-based subtypes. (B) Representative slides (top) and tumour-infiltrating lymphocyte (TIL) maps (bottom) of GC tissues with different purity values. The red colour represents a positive TIL patch, the blue colour represents a tissue region with no TIL patch and the black colour represents no tissue. (C) The Spearman correlation between TILs and purity value. (D) Heatmap of survival analysis of purity-related stromal and immune cells for overall survival (OS) and recurrence-free survival (RFS). CNN, convolutional neural network; H&E, haematoxylin and eosin; OS, overall survival; RFS, recurrence-free survival; HR, hazard ratio.
FIGURE 6
FIGURE 6
Drug response features of tumour purity for chemotherapy of gastric cancer. (A) Kaplan–Meier curves for overall survival (OS) among different purity subgroups of patients who received adjuvant chemotherapy. p-values were obtained using the log-rank test. The + symbols in the panels indicate censored data. (B) Subgroup analyses for adjuvant chemotherapy using the Cox proportional hazards regression model. The lines represent the 95% confidence intervals of the hazard ratios. (C–E) Kaplan–Meier curves for OS among patients who received adjuvant chemotherapy (CTX) and those who did not (non-CTX) in the (C) high-purity, (D) middle-purity and (E) low-purity subgroups. p-values were obtained using the log-rank test. The + symbols in the panels indicate censored data. (F) The predicted area under the curve (AUC) value of chemotherapeutic drugs for each patient. (G) The Spearman correlation coefficient between tumour purity and AUC values. (H,I) Differences in the predicted AUC value for chemotherapeutic drugs based on the (H) CTRP and (I) PRISM databases among the three subgroups. The upper and lower ends of the boxes represent the inter-quartile range of values. The horizontal width of the violin represents the data density. p-values were obtained via the Kruskal–Wallis test. CTX, adjuvant chemotherapy; non-adjuvant chemotherapy, non-CTX.

References

    1. Ahn B., Chae Y.-S., Kim C. H., Lee Y., Lee J. H., Kim J. Y. (2018). Tumor Microenvironmental Factors Have Prognostic Significances in Advanced Gastric Cancer. Apmis 126, 814–821. 10.1111/apm.12889 - DOI - PubMed
    1. Aran D., Hu Z., Butte A. J. (2017). xCell: Digitally Portraying the Tissue Cellular Heterogeneity Landscape. Genome Biol. 18, 220. 10.1186/s13059-017-1349-1 - DOI - PMC - PubMed
    1. Aran D., Sirota M., Butte A. J. (2015). Systematic Pan-Cancer Analysis of Tumour Purity. Nat. Commun. 6, 8971. 10.1038/ncomms9971 - DOI - PMC - PubMed
    1. Aurello P., Berardi G., Giulitti D., Palumbo A., Tierno S. M., Nigri G., et al. (2017). Tumor-Stroma Ratio Is an Independent Predictor for Overall Survival and Disease Free Survival in Gastric Cancer Patients. The Surgeon 15, 329–335. 10.1016/j.surge.2017.05.007 - DOI - PubMed
    1. Basu A., Bodycombe N. E., Cheah J. H., Price E. V., Liu K., Schaefer G. I., et al. (2013). An Interactive Resource to Identify Cancer Genetic and Lineage Dependencies Targeted by Small Molecules. Cell 154, 1151–1161. 10.1016/j.cell.2013.08.003 - DOI - PMC - PubMed