. 2022 Jan 10:9:797060.
doi: 10.3389/fcell.2021.797060. eCollection 2021.

Simulated Microgravity Potentiates Hematopoietic Differentiation of Human Pluripotent Stem Cells and Supports Formation of 3D Hematopoietic Cluster

Affiliations

Simulated Microgravity Potentiates Hematopoietic Differentiation of Human Pluripotent Stem Cells and Supports Formation of 3D Hematopoietic Cluster

Chiyuan Ma et al. Front Cell Dev Biol. .

Abstract

Microgravity has been shown to induces many changes in proliferation, differentiation and growth behavior of stem cells. Little is known about the effect of microgravity on hematopoietic differentiation of pluripotent stem cells (PSCs). In this study, we used the random position machine (RPM) to investigate whether simulated microgravity (SMG) allows the induction of hematopoietic stem/progenitor cell (HSPC) derived from human embryonic stem cells (hESCs) in vitro. The results showed that SMG facilitates hESCs differentiate to HSPC with more efficient induction of CD34+CD31+ hemogenic endothelium progenitors (HEPs) on day 4 and CD34+CD43+ HSPC on day 7, and these cells shows an increased generation of functional hematopoietic cells in colony-forming unit assay when compared with normal gravity (NG) conditions. Additionally, we found that SMG significantly increased the total number of cells on day 4 and day 7 which formed more 3D cell clusters. Transcriptome analysis of cells identified thousands of differentially expressed genes (DEGs) between NG and SMG. DEGs down-regulated were enriched in the axonogenesis, positive regulation of cell adhesion, cell adhesion molecule and axon guidance, while SMG resulted in the up-regulation of genes were functionally associated with DNA replication, cell cycle, PI3K-Akt signaling pathway and tumorigenesis. Interestingly, some key gene terms were enriched in SMG, like hypoxia and ECM receptor interaction. Moreover, HSPC obtained from SMG culture conditions had a robust ability of proliferation in vitro. The proliferated cells also had the ability to form erythroid, granulocyte and monocyte/macrophage colonies, and can be induced to generate macrophages and megakaryocytes. In summary, our data has shown a potent impact of microgravity on hematopoietic differentiation of hPSCs for the first time and reveals an underlying mechanism for the effect of SMG on hematopoiesis development.

Keywords: 3D clusters; hematopoietic differentiation; human embryonic stem cells; microgravity; transcriptome analysis.


Conflict of interest statement

The authors declare that the research was conducted in the absence of any commercial or financial relationships that could be construed as a potential conflict of interest.

Figures

FIGURE 1
FIGURE 1
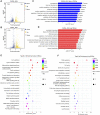
Simulated microgravity promotes hematopoietic differentiation of hESCs. (A) Schematic illustration of hematopoietic differentiation protocol from hESCs. (B) Custom-made random position machine (RPM) for the hematopoietic differentiation of hESCs to simulated microgravity conditions (SMG), the normal gravity (NG) cultivation is a control group. (C) Morphological change of cells during differentiation from hESCs to HSPC under NG and SMG condition on day 0, day 2, day 4 and day 7. Scale bars represent 100 μm. (D) Representative immunostaining images of day 4 cells for CD34 (green) and CD31 (red) under NG and SMG condition. Scale bar represents 100 μm. (E) Representative flow cytometry results of surface marker CD34 and CD31 in NG and SMG group at day 4, the bar graph showing the number of CD34+CD31+ hemogenic endothelium progenitors derived from NG and SMG group at day 4. (F) qRT-PCR analysis of RUNX1, SOX17 and NOS2 expression in the day 4 cells differentiated under NG or SMG condition. (G) Representative immunostaining images of day 7 cells for CD34 (green) and CD43 (red) under NG and SMG condition. Scale bar represents 50 μm. (H) Representative flow cytometry results of surface marker CD34 and CD43 in NG and SMG group at day 7, the bar graph showing the number of CD34+CD43+ hematopoietic stem/progenitor cells derived from NG and SMG group at day 7. (I) Representative colony morphologies from hESC-derived hematopoietic cells on day 7. (J) The total number of colonies derived from NG group and SMG group. (L) The percentage of BFU-E, CFU-E, CFU-GM, and CFU-GEMM in total colonies. (K) The relative fold change of total cell number generated in the day 4 and day 7 (SMG vs NG). For statistical significance, *p < 0.05, **p < 0.01 and n. s., not significant (p > 0.05), all data are presented as mean ± SEM.
FIGURE 2
FIGURE 2
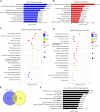
Genome -wide RNA-seq assays to detect differentially expressed genes (DEGs), GO and KEGG pathways analysis of DEGs in SMG4 vs NG4 cells. (A) Volcano plot displaying the DEGs in SMG or NG cells on day 4. The blue, yellow and grey dots represent down-regulated, up-regulated and not significant gene, respectively. (B) Volcano plot displaying the DEGs in SMG or NG cells on day 7. (C) Bar chart shows the top10 down-regulated GO terms of BP in SMG4 vs NG4. (D) Bar chart shows the top10 up-regulated GO terms of BP in SMG4 vs. NG4. (E) Dot plot shows the down-regulated KEGG pathways enriched in SMG4 vs NG4. The size of the dot is based on gene number enriched in the pathway, and the color of the dot shows the pathway enrichment significance. (F) Dot plot shows the up-regulated KEGG pathways enriched in SMG4 vs NG4. NG4, cell induced for 4 d under normal gravity condition; SMG, cell induced for 4 d under simulated microgravity condition; NG7, cell induced for 7 d under normal gravity condition; SMG, cell induced for 7 d under simulated microgravity condition.
FIGURE 3
FIGURE 3
GO and KEGG pathway analysis of DEGs in SMG7 vs NG7 cells. (A) Bar chart shows the top10 down-regulated GO terms of BP in SMG7 vs NG7. (B) Bar chart shows the top10 up-regulated GO terms of BP in SMG7 vs NG7. (C) Dot plot shows the down-regulated KEGG pathways enriched in SMG7 vs. NG7. The size of the dot is based on gene number enriched in the pathway, and the color of the dot shows the pathway enrichment significance. (D) Dot plot shows the up-regulated KEGG pathways enriched in SMG7 vs. NG7. (E) Venn diagram of overlapping DEGs comparing SMG4 vs. NG4 and SMG7 vs. NG7. (F) GO analysis of overlapping DEGs between SMG4 vs NG4 and SMG7 vs NG7.
FIGURE 4
FIGURE 4
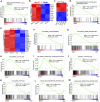
The gene set enrichment analysis (GSEA) result of DEGs in SMG vs NG cells. (A) GSEA of hematopoietic development on day 4 (SMG4 vs NG4) in hematopoietic cell lineage. (B) The heatmap shows the expression pattern of hematopoietic cell linage-related genes in SMG and NG cells on day 4. (C) The heatmap shows the expression of typical arterial-associated genes in SMG and NG cells on day 4. (D) GSEA of hematopoietic stem cell differentiation on day 7 (SMG vs NG). (E) The heatmap shows the expression pattern of hematopoietic stem cell-related genes in SMG and NG cells on day 7. GSEA profiles showing a significant enrichment of gene sets associate with angiogenesis (F), HEME metabolism (G), glycolysis (H) and oxidative phosphorylation (I) in SMG and NG cells on day 7 (SMG7 vs NG7). (J,K) GSEA of hypoxia-associated gene sets both enriched on day 4 and day 7 (SMG4 vs. NG4; SMG7 vs. NG7). (L,M) GSEA of ECM receptor interaction associated gene sets both enriched on day 4 and day 7 (SMG4 vs. NG4; SMG7 vs. NG7).
FIGURE 5
FIGURE 5
SMG promotes the hemogenic endothelium and hematopoietic development and enhances 3D cell clusters generation. (A) A schematic of hESC hematopoietic differentiation strategy under SMG and NG conditions. (B) Phase contrast image of hESC cultures on day 4 (stage 2, blue arrow indicates hemogenic epithelium like structure), 7 (stage 3, red arrow indicates hematopoietic cluster like structure) and 9 (stage 3, green cell indicates hematopoietic progenitor cells) of hematopoietic differentiation. Scale bars, 100 μm. (C) The relative fold change of cell number generated on day 4 and day 7. (D) The relative of suspension cell number generation from cell clusters on day 9 (SMG vs NG). (E) The percentage of percentage of CD34+CD43+, CD34+CD43 and CD34CD43+ cells in NG and SMG group on day 9. (F) The percentage of percentage of CD43+CD45+, CD43+CD45 and CD43CD45+ cells in NG and SMG group on day 9. (G) Representative colony morphologies from hESC-derived CD34+ progenitor cells on day 4. Scale bars, 100 μm. (H) The total number of colonies derived from NG group and SMG group on day 4. (I) The percentage of BFU-E, CFU-E, CFU-GM, and CFU-GEMM in total colonies.
FIGURE 6
FIGURE 6
Continuously generation of HSPC from 3D clusters and functionally assessment of HSPC derived from SMG condition culture. (A) A strategy to continuously collection of floating cells on days 9 during hematopoietic differentiation. (B) Represent image of HSPCs before and after harvest from day 9 to day 13. (C) Flow cytometry results of CD34, CD43 and CD45 at differentiating day 11. (D) CFU assay of day 9 collected HSPCs and percentage of different hematopoietic colonies in MethoCult medium for 2 weeks. Scale bars, 100 μm. (E) Represent image of HSPCs before and after three passage expansion. Scale bars, 100 μm. (F) Immunostaining of CD43 and CD45 for expanded HSPCs. Scale bars, 500 μm. (G) Morphology of differentiated macrophages assessed by light microscopy and Giemsa staining. Scale bars, 20 μm. (H) Morphology of differentiated megakaryocytes by light microscopy and Giemsa staining. Scale bars, 20 μm.

References

    1. Adamo L., Naveiras O., Wenzel P. L., McKinney-Freeman S., Mack P. J., Gracia-Sancho J., et al. (2009). Biomechanical Forces Promote Embryonic Haematopoiesis. Nature 459, 1131–1135. 10.1038/nature08073 - DOI - PMC - PubMed
    1. Bradbury P., Wu H., Choi J. U., Rowan A. E., Zhang H., Poole K., et al. (2020). Modeling the Impact of Microgravity at the Cellular Level: Implications for Human Disease. Front. Cel Dev. Biol. 8, 96. 10.3389/fcell.2020.00096 - DOI - PMC - PubMed
    1. Cao X., Yakala G. K., van den Hil F. E., Cochrane A., Mummery C. L., Orlova V. V. (2019). Differentiation and Functional Comparison of Monocytes and Macrophages from hiPSCs with Peripheral Blood Derivatives. Stem Cel Rep. 12, 1282–1297. 10.1016/j.stemcr.2019.05.003 - DOI - PMC - PubMed
    1. Chen Z., Luo Q., Lin C., Kuang D., Song G. (2016). Simulated Microgravity Inhibits Osteogenic Differentiation of Mesenchymal Stem Cells via Depolymerizing F-Actin to Impede TAZ Nuclear Translocation. Sci. Rep. 6, 30322. 10.1038/srep30322 - DOI - PMC - PubMed
    1. Choi D. H., Jeon B., Lim M. H., Lee D. H., Ye S.-K., Jeong S.-Y., et al. (2021). 3D Cell Culture Using a Clinostat Reproduces Microgravity-Induced Skin Changes. Npj Microgravity 7, 20. 10.1038/s41526-021-00148-6 - DOI - PMC - PubMed

LinkOut - more resources