

Bifidobacterium animalis subsp. lactis BB-12 Has Effect Against Obesity by Regulating Gut Microbiota in Two Phases in Human Microbiota-Associated Rats
- PMID: 35083265
- PMCID: PMC8784422
- DOI: 10.3389/fnut.2021.811619
Bifidobacterium animalis subsp. lactis BB-12 Has Effect Against Obesity by Regulating Gut Microbiota in Two Phases in Human Microbiota-Associated Rats
Abstract
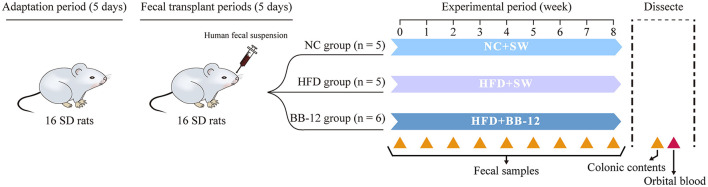
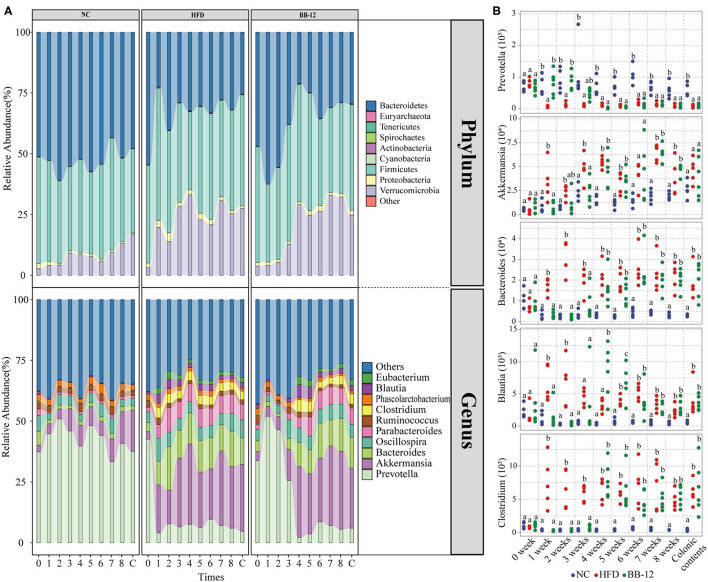
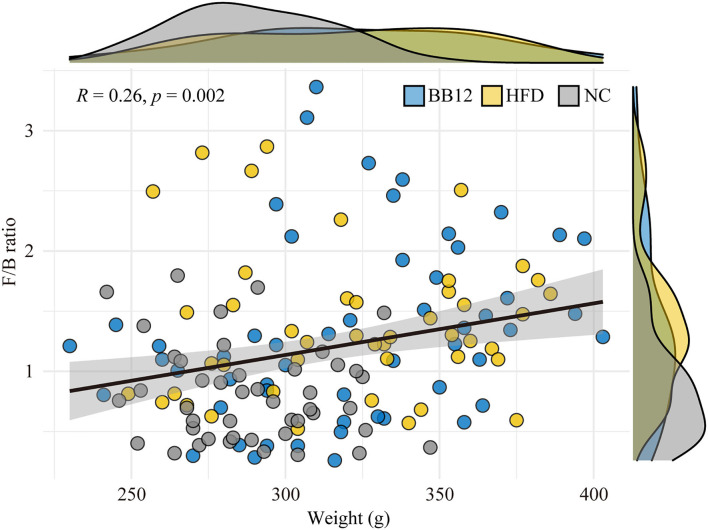
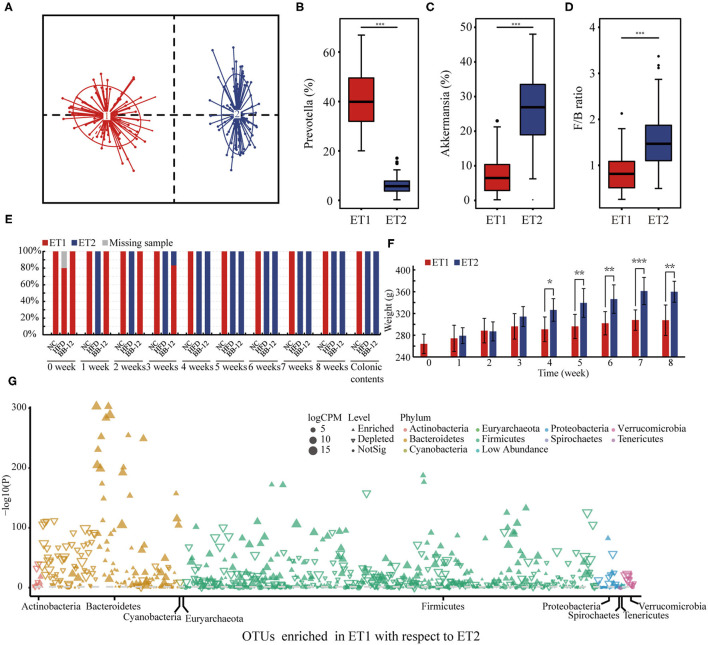
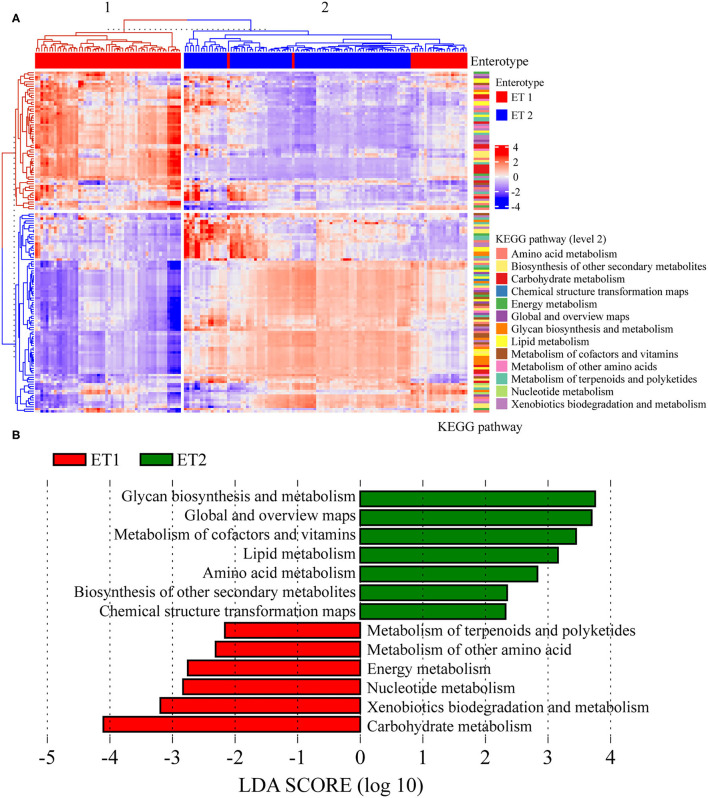
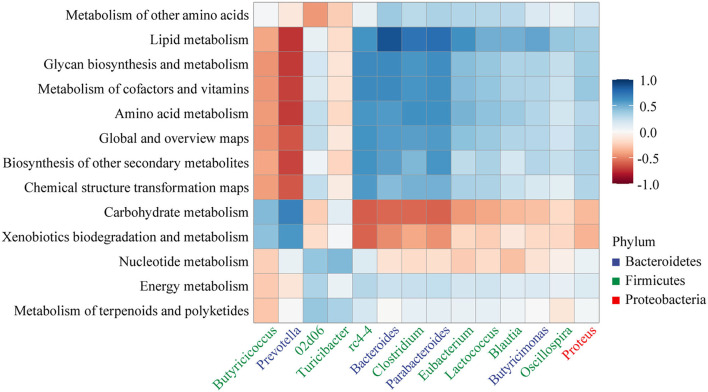
Bifidobacterium animalis subsp. lactis BB-12 (BB-12) is an extensively studied probiotics species, which has been reported to improve the human gut microbiota. This study aimed to confirm the effects of BB-12 on high-fat diet (HFD)-induced gut microbiota disorders. The probiotic BB-12 was consumed by human microbiota-associated rats and changes in gut microbiota were compared using next generation sequencing of the fecal samples collected from the normal chow group, the HFD group, and the BB-12-supplemented group. The enterotypes switched from Prevotella dominant to Akkermansia dominant as a result of switching diet from normal chow to HFD. BB-12 conferred protection on the gut microbiota composition of the rats by increasing the abundance of Prevotella and decreasing the abundance of Clostridium, Blautia, and Bacteroides in 0-3 weeks. In addition, Prevotella-dominant enterotype was maintained, which provides improve obesity effects. A decrease in body weight and the Firmicutes/Bacteroidetes ratio were also observed at week 3. While in 4-8 weeks, the enrichment of short-chain fatty acids-producing bacteria such as Eubacterium and Parabacteroides and probiotics such as Bifidobacterium was observed. The results revealed that BB-12 against obesity by regulating gut microbiota in two phases. After a short-term intervention, BB-12 supplementation suppressed the transition from the healthy to obesity state by protecting Prevotella-dominant enterotype, whereas after a long-term intervention, BB-12 ameliorates obesity by enriching beneficial bacteria in the gut.
Keywords: Bifidobacterium animalis subsp. lactis BB-12; Prevotella; enterotypes; gut microbiota; obesity.
Copyright © 2022 Mao, Gao, Wang, Li, Geng, Zhang, Sadiq and Sang.
Conflict of interest statement
The authors declare that the research was conducted in the absence of any commercial or financial relationships that could be construed as a potential conflict of interest.
Figures

Similar articles
-
Matrix Effects on the Delivery Efficacy of Bifidobacterium animalis subsp. lactis BB-12 on Fecal Microbiota, Gut Transit Time, and Short-Chain Fatty Acids in Healthy Young Adults.mSphere. 2021 Aug 25;6(4):e0008421. doi: 10.1128/mSphere.00084-21. Epub 2021 Jul 7. mSphere. 2021. PMID: 34232082 Free PMC article. Clinical Trial.
-
The effect of probiotic supplementation on the gut microbiota of preterm infants.J Med Microbiol. 2021 Aug;70(8):001403. doi: 10.1099/jmm.0.001403. J Med Microbiol. 2021. PMID: 34431764 Free PMC article.
-
Bifidobacterium animalis subsp. lactis BB-12 Protects against Antibiotic-Induced Functional and Compositional Changes in Human Fecal Microbiome.Nutrients. 2021 Aug 17;13(8):2814. doi: 10.3390/nu13082814. Nutrients. 2021. PMID: 34444974 Free PMC article. Clinical Trial.
-
Microbial enterotypes in personalized nutrition and obesity management.Am J Clin Nutr. 2018 Oct 1;108(4):645-651. doi: 10.1093/ajcn/nqy175. Am J Clin Nutr. 2018. PMID: 30239555 Review.
-
Bifidobacterium animalis subsp. lactis 420 for Metabolic Health: Review of the Research.Nutrients. 2020 Mar 25;12(4):892. doi: 10.3390/nu12040892. Nutrients. 2020. PMID: 32218248 Free PMC article. Review.
Cited by
-
Fermented Dairy Products as Precision Modulators of Gut Microbiota and Host Health: Mechanistic Insights, Clinical Evidence, and Future Directions.Foods. 2025 May 29;14(11):1946. doi: 10.3390/foods14111946. Foods. 2025. PMID: 40509473 Free PMC article. Review.
-
Exogenous antibiotic resistance gene contributes to intestinal inflammation by modulating the gut microbiome and inflammatory cytokine responses in mouse.Gut Microbes. 2023 Jan-Dec;15(1):2156764. doi: 10.1080/19490976.2022.2156764. Gut Microbes. 2023. PMID: 36573825 Free PMC article.
-
Optimization of Mixed Inulin, Fructooligosaccharides, and Galactooligosaccharides as Prebiotics for Stimulation of Probiotics Growth and Function.Foods. 2023 Apr 9;12(8):1591. doi: 10.3390/foods12081591. Foods. 2023. PMID: 37107386 Free PMC article.
-
The Ambiguous Correlation of Blautia with Obesity: A Systematic Review.Microorganisms. 2024 Aug 26;12(9):1768. doi: 10.3390/microorganisms12091768. Microorganisms. 2024. PMID: 39338443 Free PMC article. Review.
-
Intake of slow-digesting carbohydrates is related to changes in the microbiome and its functional pathways in growing rats with obesity induced by diet.Front Nutr. 2022 Nov 30;9:992682. doi: 10.3389/fnut.2022.992682. eCollection 2022. Front Nutr. 2022. PMID: 36532542 Free PMC article.
References
-
- Wankhade UD, Zhong Y, Kang P, Alfaro M, Chintapalli SV, Piccolo BD, et al. . Maternal high-fat diet programs offspring liver steatosis in a sexually dimorphic manner in association with changes in gut microbial ecology in mice. Sci Rep. (2018) 8:16502. 10.1038/s41598-018-34453-0 - DOI - PMC - PubMed
LinkOut - more resources
Full Text Sources