. 2022 Jan;12(1):e718.
doi: 10.1002/ctm2.718.

BRD4-IRF1 axis regulates chemoradiotherapy-induced PD-L1 expression and immune evasion in non-small cell lung cancer

Affiliations

BRD4-IRF1 axis regulates chemoradiotherapy-induced PD-L1 expression and immune evasion in non-small cell lung cancer

Jian Wang et al. Clin Transl Med. 2022 Jan.

Abstract

Background: Chemoradiotherapy-induced PD-L1 upregulation leads to therapeutic resistance and treatment failure. The PD-1/PD-L1 blocking antibodies sensitize cancers to chemoradiotherapy by blocking extracellular PD-1 and PD-L1 binding without affecting the oncogenic function of intracellular PD-L1. Reversing the chemoradiation-induced PD-L1 expression could provide a new strategy to achieve a greater anti-tumour effect of chemoradiotherapy. Here, we aimed to identify candidate small molecular inhibitors that might boost the anti-tumour immunity of chemoradiotherapy by decreasing treatment-induced PD-L1 expression in non-small cell lung cancer (NSCLC).

Methods: A drug array was used to recognize compounds that can suppress the cisplatin-induced and radiation-induced PD-L1 expression in NSCLC via the flow cytometry-based assay. We examined whether and how targeting bromodomain containing 4 (BRD4) inhibits chemoradiation-induced PD-L1 expression and evaluated the effect of BRD4 inhibition and chemoradiation combination in vivo.

Results: BRD4 inhibitors JQ1 and ARV-771 were identified as the most promising drugs both in the cisplatin and radiation screening projects in two NSCLC cell lines. Targeting BRD4 was supposed to block chemoradiotherapy inducible PD-L1 expression by disrupting the recruitment of BRD4-IRF1 complex to PD-L1 promoter. A positive correlation between BRD4 and PD-L1 expression was observed in human NSCLC tissues. Moreover, BRD4 inhibition synergized with chemoradiotherapy and PD-1 blockade to show a robust anti-tumour immunity dependent on CD8+ T cell through limiting chemoradiation-induced tumour cell surface PD-L1 upregulation in vivo. Notably, the BRD4-targeted combinatory treatments did not show increased toxicities.

Conclusion: The data showed that BRD4-targeted therapy synergized with chemoradiotherapy and anti-PD-1 antibody by boosting anti-tumour immunity in NSCLC.

Keywords: BRD4; PD-L1; cisplatin; non-small cell lung cancer; radiotherapy.


Conflict of interest statement

The authors declare no potential conflict of interest.

Figures
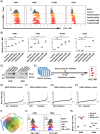
FIGURE 1
FIGURE 1
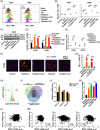
Drug screenings identified JQ1 as an inhibitor of radiation‐induced and cisplatin‐induced programmed death ligand 1 (PD‐L1) up‐regulation in non‐small cell lung cancer (NSCLC). (A) Representative fluorescence‐activated cell sorting (FACS) images and (B) quantitation of cell surface PD‐L1 expression in NSCLC cells treated with the indicated dose of radiation and cisplatin for 48 h (n = 3). (C) Western blot analysis of the expression of PD‐L1 and β‐actin in NSCLC cells treated with vehicle, radiation (8 Gy), cisplatin (4 μM) and the combination for 36 h. (D) Schematic diagram of the screening strategy. 2 × 10 A549 and H460 were seeded overnight and treated with radiation (8 Gy) or cisplatin (4 μM) after adding the inhibitors (10 μM) to the culture medium. Following incubation for 24 h, tumour cells were collected for single‐cell suspension and detected surface PD‐L1 expression by flow cytometry. (E) Results of the A549 radiation screen. Mean fluorescence intensity (MFI) ratio = (MFI(candidate drug + radiation) ‐ MFIisotype)/(MFIradiation ‐ MFIisotype). PD‐L1 MFI ratio values for each inhibitor were plotted to recognize inhibitor with PD‐L1 MFI ratio <.75. (F) Results of the A549 cisplatin screen. Mean fluorescence intensity (MFI) ratio = (MFI(candidate + cisplatin) ‐ MFIisotype)/(MFIcisplatin ‐ MFIisotype). (G) Results of the H460 radiation screen. (H) Results of the H460 cisplatin screen. (I) Venn diagram of intersecting ‘hits’ from the four indicated inhibitor screens above. (J) Representative FACS images and (K) quantitation of cell surface PD‐L1 expression in NSCLC cells treated with JQ1 (1 μM) with the stimulation of interferon gamma (IFN‐γ) (20 ng/ml) for 48 h (n = 3)
FIGURE 2
FIGURE 2
JQ1 blocked chemoradiotherapy‐induced transcription of programmed death ligand 1 (PD‐L1) and increased major histocompatibility complex (MHC)‐1 expression. (A) Representative fluorescence‐activated cell sorting (FACS) images and (B) quantitation of cell surface PD‐L1 expression in non‐small cell lung cancer (NSCLC) cells treated with radiation and cisplatin with or without JQ1 (1 μM) for 48 h (n = 3). (C) Western blot analysis of the expression of PD‐L1, BRD4 and β‐actin in A549 treated with radiation (8 Gy) and cisplatin (4 μM) w/o JQ1 (1 μM). (D) Changes of PD‐L1 mRNA in NSCLC cell lines treated with radiation and cisplatin with or without JQ1 (1 μM) for 36 h. Results are normalized to Glyceraldehyde‐3‐phosphate dehydrogenase (GAPDH) (n = 3). (E) Changes of cell surface PD‐L1 expression in NSCLC cells treated with the combination of radiation and cisplatin with or without JQ1 (1 μM) for 36 h as in Figure 1B (n = 3). (F) Immunofluorescence (IF) staining of PD‐L1 and (G) the percentages of PD‐L1 positive cells in H1299 cells treated with radiation and cisplatin with or without JQ1 (1 μM) for 48 h and counterstained with 4′,6‐diamidino‐2‐phenylindole (DAPI). Scale bar = 200 μm. (H) Volcano plot showing the RNA‐seq results of A549 treated with vehicle or JQ1(2 μM) for 24 h (Table S2). (I) Venn diagram of intersecting genes from the JQ1 down‐regulated genes, interferon gamma (INF‐γ) response genes and adaptive immune system genes (Table S2). (J) Changes of human leucocyte antigen‐A/B/C (HLA‐ABC) mRNA in NSCLC cell lines treated with JQ1 (1 μM) for 36 h. Results are normalized to GAPDH (n = 3). (K) Changes of HLA‐A mRNA in NSCLC cell lines treated with radiation and cisplatin with or without JQ1 (1 μM) for 36 h. Results are normalized to GAPDH (n = 3). (L) Analysis of correlation between PD‐L1 mRNA and BRD4 mRNA level in NSCLC of The Cancer Genome Atlas (TCGA) dataset. (M) Analysis of correlation between HLA‐A mRNA and BRD2/3/4 mRNA level in NSCLC of TCGA dataset
FIGURE 3
FIGURE 3
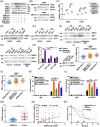
The BRD4‐interferon regulatory factor 1 (IRF1) axis is required for chemoradiotherapy‐mediated programmed death ligand 1 (PD‐L1) up‐regulation. (A) Western blot analysis of the expression of PD‐L1, BRD2/3/4 and β‐actin in A549 transfected with scramble, BRD2/3/4 siRNAs and then treated with the combination of radiation and cisplatin. (B) Western blot analysis of the expression of BRD4 and β‐actin in non‐small cell lung cancer (NSCLC) cells treated with indicated doses of BRD degrader ARV771. (C) Changes of cell surface PD‐L1 expression in NSCLC cells treated with radiation and cisplatin in the presence or absence of ARV771 (.5 μM) (n = 3). (D) The NSCLC cells were subjected to co‐immunoprecipitation (IP) assay to detect the interactions between BRD4 and IRF1 using the anti‐BRD4 antibody or isotype‐matched IgG control and then detected by Western blot analysis with the indicated antibodies. (E) The co‐IP assay was performed with the anti‐IRF1 antibody and then detected by Western blot analysis. (F) A549 cells were treated with radiation with or without JQ1 for 24 h, and then subject to the co‐IP assay with the anti‐BRD4 antibody and detected by Western blot analysis with the indicated antibodies. (G) A549 cells were treated with cisplatin with or without JQ1 for 24 h, and then subject to the co‐IP assay with the anti‐BRD4 antibody. (H) PD‐L1 mRNA changes in A549 transfected with the scramble and IRF1 siRNAs and then treated with the combination of radiation and cisplatin. Knockdown efficiencies of IRF1 by the indicated siRNAs were detected by Western blot analysis. (I) PD‐L1 mRNA levels were determined with BRD4 and IRF1 at low (lo) and high (hi) levels in The Cancer Genome Atlas (TCGA) lung adenocarcinoma (LUAD) patients. (J) PD‐L1 mRNA levels were determined with BRD4 and IRF1at low (lo) and high (hi) levels in TCGA lung squamous cell carcinoma (LUSC) patients. (K and L) A549 cells were treated with radiation and cisplatin with or without JQ1 for 24 h, and then subjected to CUT&Tag analysis for the PD‐L1 gene promoter using the indicated antibodies or isotype‐matched IgG control (n = 3). (M) BRD4 protein expression in the paired adjacent and tumour tissues in the tissue microarray of NSCLC patients. (N) Analysis of correlation between percentages of PD‐L1 positive cells and BRD4 protein expressions in the tissue microarray of NSCLC patients. (O) Overall survival was determined with BRD4 and PD‐L1 at low and high levels in the tissue microarray of NSCLC patients by using the Kaplan–Meier plotter method
FIGURE 4
FIGURE 4
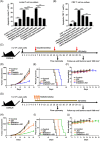
JQ1 enhanced the anti‐tumour effect of radiation and cisplatin in vivo. (A) Using the Annexin V‐FITC/PI assay, percentages of apoptotic Jurkat T cells were detected after co‐culturing with A549 cells with the indicated treatments (n = 3). (B) Apoptosis rates of CD3+ T cells were determined after co‐culturing with A549 cells with the indicated treatments (n = 3). (C) The schema for animal studies. Black arrows indicate the day of tumour implantation and analysis. The brown horizontal line represents JQ1 treatment. Red arrows indicate cisplatin treatment. Details of drug administration were described in the Methods. (D) Growth kinetics of implanted Lewis tumours treated as indicated. Error bars represent ± standard error of the mean (SEM) (n = 5). (E) Survival analysis and (F) body weight measurement for each of the indicated groups (n = 5). (G) The schema for animal studies. Black arrows indicate the day of tumour implantation and analysis. The brown horizontal line represents JQ1 treatment. The orange lightning bolt graphics represent X‐ray radiation. Details of drug administration and radiation were described in the Methods. (H) Growth kinetics of implanted Lewis tumours treated as indicated. Error bars represent ± SEM (n = 5). (I) Survival analysis and (J) body weight measurement for mice treated with the indicated regimens (n = 5)
FIGURE 5
FIGURE 5
JQ1 enhanced anti‐tumour immunity of chemoradiotherapy dependent on CD8+ T cells. (A) Tumours were collected from each group of Lewis tumour‐bearing mice (n = 5) at day 14 after tumour implantation, 1 day after the second weekly dose of cisplatin, and 6 days after the third fraction of radiotherapy. Tumour cells and intratumoural immune cells were analyzed by flow cytometry. (B) Lewis tumour tissues were assessed for interferon gamma (IFN‐γ) and TNF‐α levels (n = 5). (C) Lewis‐bearing mice of the vehicle control, JQ1+radiation, JQ1+radiation anti‐CD8 antibody, JQ1+ CDDP and JQ1+ CDDP + anti‐CD8 antibody groups, were monitored for assessing tumour growth. Error bars represent ± SEM (n = 6)
FIGURE 6
FIGURE 6
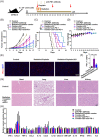
JQ1 synergized with concurrent chemoradiotherapy and anti‐programmed cell death‐1 (PD‐1) antibody without increasing toxicities. (A) The schema for animal studies. Black arrows indicate the day of tumour implantation. The brown horizontal line represents JQ1 treatment. Red arrows indicate cisplatin treatment. The orange lightning bolt graphics represent radiotherapy. Celadon green arrows symbolize anti‐PD‐1 therapy. Details of drug administration were described in the Methods. (B) Growth curves for implanted Lewis tumours treated as indicated (n = 8). (C) Survival analysis and (D) body weight measurement for each of the indicated groups (n = 8). (E) Immunofluorescence (IF) staining of PD ligand 1 (PD‐L1) in implanted Lewis tumours treated as indicated and counterstained with DAPI. Scale bar = 50 μm. (F) Quantitation of PD‐L1 positive cells in Lewis tumours after treatment as described (n = 5). (G) Hearts, lungs, livers and kidneys were harvested from Lewis‐bearing mice treated as indicated at the end of the experiments and prepared for hematoxylin‐eosin (H&E) analysis. Scale bar = 100 μm. (H) Serum was harvested from Lewis‐bearing mice treated as indicated and cryopreserved for cytokine analysis (n = 5). No significant changes were observed in the detected serum cytokines of the indicated groups

References

    1. Molina JR, Yang P, Cassivi SD, Schild SE, Adjei AA. Non‐small cell lung cancer: epidemiology, risk factors, treatment, and survivorship. Mayo Clin Proc. 2008;83:584‐594. - PMC - PubMed
    1. Miller KD, Nogueira L, Mariotto AB, et al. Cancer treatment and survivorship statistics. CA Cancer J Clin. 2019;69:363‐385. - PubMed
    1. Auperin A, Le Pechoux C, Rolland E, et al. Meta‐analysis of concomitant versus sequential radiochemotherapy in locally advanced non‐small‐cell lung cancer. J Clin Oncol. 2010;28:2181‐2190. - PubMed
    1. Blackstock AW, Govindan R. Definitive chemoradiation for the treatment of locally advanced non small‐cell lung cancer. J Clin Oncol. 2007;25:4146‐4152. - PubMed
    1. Rittmeyer A, Barlesi F, Waterkamp D, et al. Atezolizumab versus docetaxel in patients with previously treated non‐small‐cell lung cancer (OAK): a phase 3, open‐label, multicentre randomised controlled trial. Lancet. 2017;389:255‐265. - PMC - PubMed

Publication types

MeSH terms