. 2022 Jan;12(1):e669.
doi: 10.1002/ctm2.669.

Clinical challenges of tissue preparation for spatial transcriptome

Affiliations

Clinical challenges of tissue preparation for spatial transcriptome

Xiaoxia Liu et al. Clin Transl Med. 2022 Jan.

Abstract

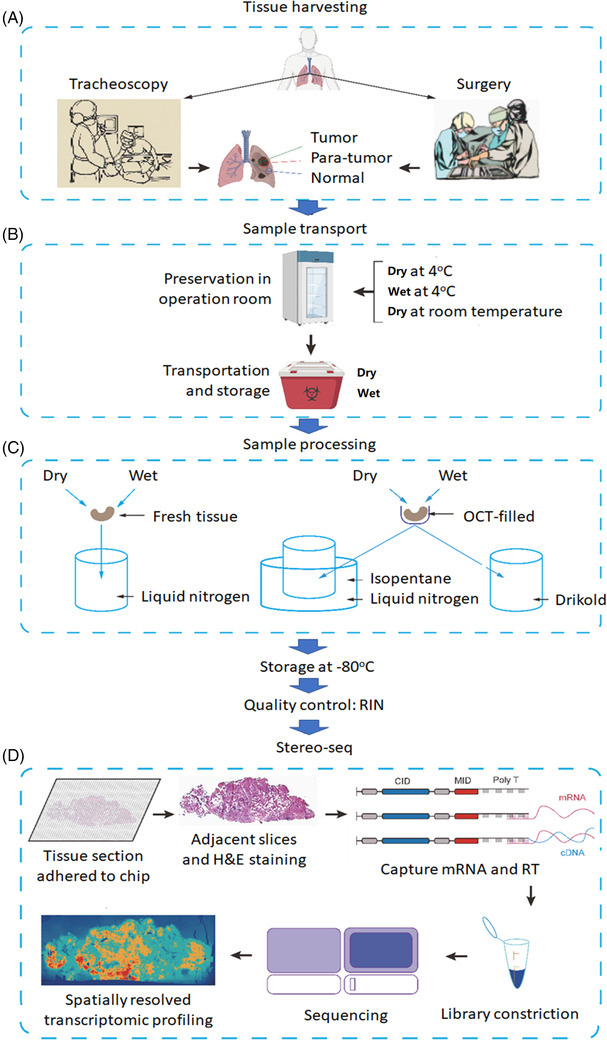
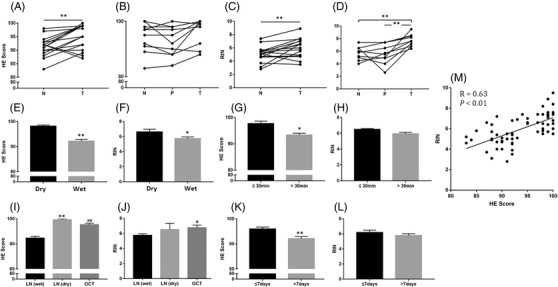
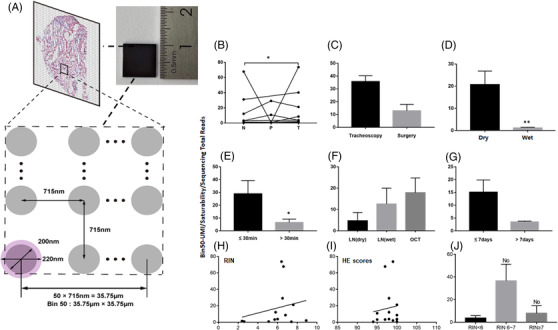
Spatial transcriptomics is considered as an important part of spatiotemporal molecular images to bridge molecular information with clinical images. Of those potentials and opportunities, the excellent quality of human sample preparation and handling will ensure the precise and reliable information generated from clinical spatial transcriptome. The present study aims at defining potential factors that might influence the quality of spatial transcriptomics in lung cancer, para-cancer, or normal tissues, pathological images of sections and the RNA integrity before spatial transcriptome sequencing. We categorised potential influencing factors from clinical aspects, including patient selection, pathological definition, surgical types, sample harvest, temporary preservation conditions and solutions, frozen approaches, transport and storage conditions and duration. We emphasis on the relationship between the combination of histological scores with RNA integrity number (RIN) and the unique molecular identifier (UMI), which is determines the quality of of spatial transcriptomics; however, we did not find significantly relevance between them. Our results showed that isolated times and dry conditions of sample are critical for the UMI and the quality of spatial transcriptomic samples. Thus, clinical procedures of sample preparation should be furthermore optimised and standardised as new standards of operation performance for clinical spatial transcriptome. Our data suggested that the temporary preservation time and condition of samples at operation room should be within 30 min and in 'dry' status. The direct cryo-preservation within OCT media for human lung sample is recommended. Thus, we believe that clinical spatial transcriptome will be a decisive approach and bridge in the development of spatiotemporal molecular images and provide new insights for understanding molecular mechanisms of diseases at multi-orientations.

Keywords: clinical challenge; critical factor; spatial transcriptomics; spatiotemporal molecular image; spatiotemporal molecular medicine.


Conflict of interest statement

The authors declare that they have no competing interests.

Figures

FIGURE 1
FIGURE 1
Processes and workflow of clinical spatial transcriptome from sample harvest to transcriptomic imprints. (A) Tissue harvesting: human samples of lung tumour, para‐tumour (>2 cm from cancer edge) and normal tissues (>3 cm from para‐cancer tissue) were harvested from either tracheoscopy or surgery. (B) Sample transport: the harvested tissues were temporarily maintained with physiological saline solution (‘wet’) or without solution (‘dry’) in the operating room at 4℃ or room temperature, then samples were transported to the laboratory from on ice. (C) Sample processing: tissues at wet or dry conditions were frozen directly in liquid nitrogen or were immersed with the solution of optimal cutting temperature compound (OCT) in isopentane cooled with liquid nitrogen or drikold. The processed samples were temporarily stored in the refrigerator at –80℃, and then RNA integrity number (RIN) value was detected. (D) Stereo‐seq: Spatio‐Temporal Enhanced Resolution Omics‐sequencing (Stereo‐Seq) is an emerging next generation of spatially resolved transcriptomics technology using the high resolution of regularly and septically spaced DNA nanobeads (DNB) to enable in situ RNA capture, amplification and sequencing
FIGURE 2
FIGURE 2
The haematoxylin and eosin (HE) staining images of different lung cancer types in paired samples, including normal tissues (N) and tumour tissues (T) or para‐tumour tissues(P). (A) Lung adenocarcinoma (LUAD: 9 N+T), 1N: the lung tissue structure was present, some alveoli collapsed and a few lymphocytes were infiltrated, 1T: the tumour cells showed invasive growth with less cytoplasm, hyperchromatic nuclei and diffuse infiltration, 2N: lung tissue structure was present and red blood cells were seen in alveolar cavities, 2T: adenocarcinoma cells were seen at the margins of the tissue, growing in an alveolar manner, 3N: normal lung tissue with minimal lymphocytic infiltration, 3T: LUAD with acinar growth, 4N: normal lung tissue with widened alveolar septum and mild fibrous hyperplasia, 4T: not clear enough to be recognised, 5N: the lung structure was basically normal, 5T: LUAD, mainly papillary type, a small amount of wall growth type, 6N: normal lung tissue with red blood cells in alveoli, 6T: LUAD, mainly with wall neoplasia, 7N: the lung structure was normal, 7T: mucinous adenocarcinoma with adherent growth, 8N: the lung tissue was basically normal, 8T: lung cancer mainly with adherent growth, 9N: normal lung tissue, some alveolar structures collapsed, 9T: not clear enough to be recognised. (B) LUAD: 10 N+P+T, 1N: normal lung tissue with minimal lymphocytic infiltration, 1P: the alveolar septum widened with mild fibrous hyperplasia and more dust deposition in lymphatic vessels, 1T: LUAD, adherent growth type, 2N: lung tissue was generally normal with mild fibrosis of the alveolar septum, 2P: alveolar interstitial fibrosis, no tumour tissue, 2T: small amount of acinar type tumour tissue, 3N: the alveolar structure collapsed with lymphocytic infiltration, 3P: alveolar interstitial fibrosis, 3T: LUAD, acinar type, 4N: widened alveolar septum with mild fibrosis, 4P: widened alveolar septum, 4T: LUAD, mainly acinar type, a few papillary type, 5N: lung tissue with some red blood cells, 5P: the lung structure was normal, 5T: a small number of tumour cells grew adherent to the wall, 6N: small amount of lung tissue with red blood cells, 6P: small amount of lung tissue with alveolar septum fibrous hyperplasia, 6T: LUAD, acinar type with marginal adherent growth, 7N: lung septum widened with fibrous tissue mildly hyperplasia, 7P: similar to 7N, 7T: a small number of heterotypic cells, adherant growth, 8N: normal, 8P: the alveolar septum widened with mild fibrous hyperplasia, 8T: LUAD, mainly acinar, some solid, 9N: normal, 9P: the organisational structure was incomplete, 9T: LUAD with adherent growth, 10N: normal, 10P: LUAD, mainly adherent growth, 10T: a small number of tumour cells grew adherent to the wall and mucus was visible in the alveolar cavity. (C) Lung squamous cell carcinomas (LUSC: 7 N+T & 1 N+P+T), 1N: normal, 1T: a large amount of mucus in the alveolar cavity and tumour cells grew adherent to the wall, 2N: basically normal, 2T: LUAD, signet ring cell type, 3N: normal lung tissue with red blood cells, 3T: the alveolar cavity was dilated, red blood cells were found in the cavity and a few lymphocytes were infiltrated in the stroma, none obvious tumour cells were found, 4N: normal, 4T: poorly differentiated carcinoma with solid growth, 5N: normal lung tissue with red blood cells in alveolar cavities, 5T: a small number of cancer cells grew in sheets, and red blood cells were seen in alveolar cavities, 6N: structure is incomplete, 6T: atypia cells, 7N: normal, 7T: small nodular lesions were observed without obvious cancer cells; 8N: basically normal, 8P: normal, 8T: poorly differentiated squamous cell carcinoma, nonkeratinised type. (D) Non‐small cell lung cancer (NSCLC: 2 N+T), 1N: normal, 1T: large necrosis was observed in the lesion, with more dust deposition, and no obvious malignant cells were observed, 2N: a small amount of fibrous hyperplasia in the alveolar septum, 2T: small nodular lesions were observed in the tissue with fibrous hyperplasia, none obvious malignant cells were observed
FIGURE 3
FIGURE 3
The collected and processed information for each sample. (A) Details of each tissue handling: the horizontal axis shows the patient number and indicates the tissue locations, the vertical axis shows different preservation methods at operation room and different sample processing methods, red and green, respectively, represent dry and wet condition in transport and storage, dots and triangles represent different sampling method, the size of the point was different delivery hours of samples and different colours express different storage days at –80℃. (B) The sample number of different processed method
FIGURE 4
FIGURE 4
Influencing factors of HE and RIN score in sample collection and processing. Influencing factors of spatial transcriptome, including tissue location (A, B: HE score, C, D: RIN), transportation and storage (E: HE score, F: RIN), delivery hours of samples (G: HE score, H: RIN), sample processing method (I: HE score, J: RIN) and storage days at –80℃ (K: HE score, L: RIN). (M) The correlation between HE and RIN score
FIGURE 5
FIGURE 5
Quality control of the spatial transcriptome. (A) Image of Bin 50. Stereo‐seq chip surface arranges the spot patterned array chip. Chips have spots with 200 nm diameter and a centre‐to‐centre distance of 715 nm. Each DNB with a diameter of approximately 220 nm occupies a single spot. Probe on DNB captures mRNA from 10 μm thickness tissue sections covering the chip. The matrix region composed of 50 DNB spacing was named Bin50 for subsequent analysis. (B–G) Influencing factors of RNA capture efficiency, including tissue location (B), sampling method (C), transportation and storage (D), delivery hours of samples (E), sample processing method (F) and storage days at –80°C (G), RIN (H), HE scores (I), RIN < 6, 6–7 or > 7 (J). The Bin50‐UMI/saturability/sequencing total reads represent the RNA capture efficiency on basis of the amount of Bin50 capture, saturation and sequencing
FIGURE 6
FIGURE 6
The visualised image of spatial transcriptomics quality control. (A–D) Violin plot showing the UMI (left) and gene number (right) captured by Stereo‐seq at Bin50 with different sample tissues of squamous cell lung cancer. A (normal) and B (tumour) from one patient, C (normal) and D (tumour) from another patient; (E‐H) HE staining of samples corresponding to the spatial transcriptomics results. (I‐L) Spatial visualisation of the number of UMI captured by Stereo‐seq from two samples at bin 50 resolution. E and I (normal) and F and J (tumour) from one sample, G and K (normal) and H and L (tumour) from another sample; (M‐P) Unsupervised spatially‐constrained clustering of the different sample sections analysed by Stereo‐seq data at bin 50 resolution. I (normal) and J (tumour) from one sample, K (normal) and L (tumour) from another sample. (Q‐T) UMAP projection of Stereo‐seq data at Bin 50 with clusters from four sections of two samples. Q (normal) and R(tumour) from one sample, S (normal) and T (tumour) from another sample. AT2: Type II alveolar epithelial cells

References

    1. Wang X, Fan J. Spatiotemporal molecular medicine: a new era of clinical and translational medicine. Clin Transl Med. 2021;11(1):e294. - PMC - PubMed
    1. Wang X, Fan J. Spatiotemporal molecular imaging is a critical part of spatiotemporal molecular medicine. Clin Transl Med. 2021;11(3):e347. - PMC - PubMed
    1. Stahl PL, Salmen F, Vickovic S, Lundmark A, Navarro JF, Magnusson J, Giacomello S, Asp M, Westholm JO, Huss M, Mollbrink A, Linnarsson S, Codeluppi S, Borg A, Pontén F, Costea PI, Sahlén P, Mulder J, Bergmann O, Lundeberg J, Frisén J, et al. Visualization and analysis of gene expression in tissue sections by spatial transcriptomics. Science. 2016;353(6294):78‐82. - PubMed
    1. Saviano A, Henderson NC, Baumert TF. Single‐cell genomics and spatial transcriptomics: discovery of novel cell states and cellular interactions in liver physiology and disease biology. J Hepatol. 2020;73(5):1219‐1230. - PMC - PubMed
    1. Ao CSL, Mengnan C, Kailong M, et al. Large field of view‐spatially resolved transcriptomics at nanoscale resolution. bioRxiv. 2021. Jan 17.

Publication types

MeSH terms

LinkOut - more resources