. 2022 Jan 28;375(6579):eabk2346.
doi: 10.1126/science.abk2346. Epub 2022 Jan 28.

Nests of dividing neuroblasts sustain interneuron production for the developing human brain

Affiliations

Nests of dividing neuroblasts sustain interneuron production for the developing human brain

Mercedes F Paredes et al. Science. .

Abstract

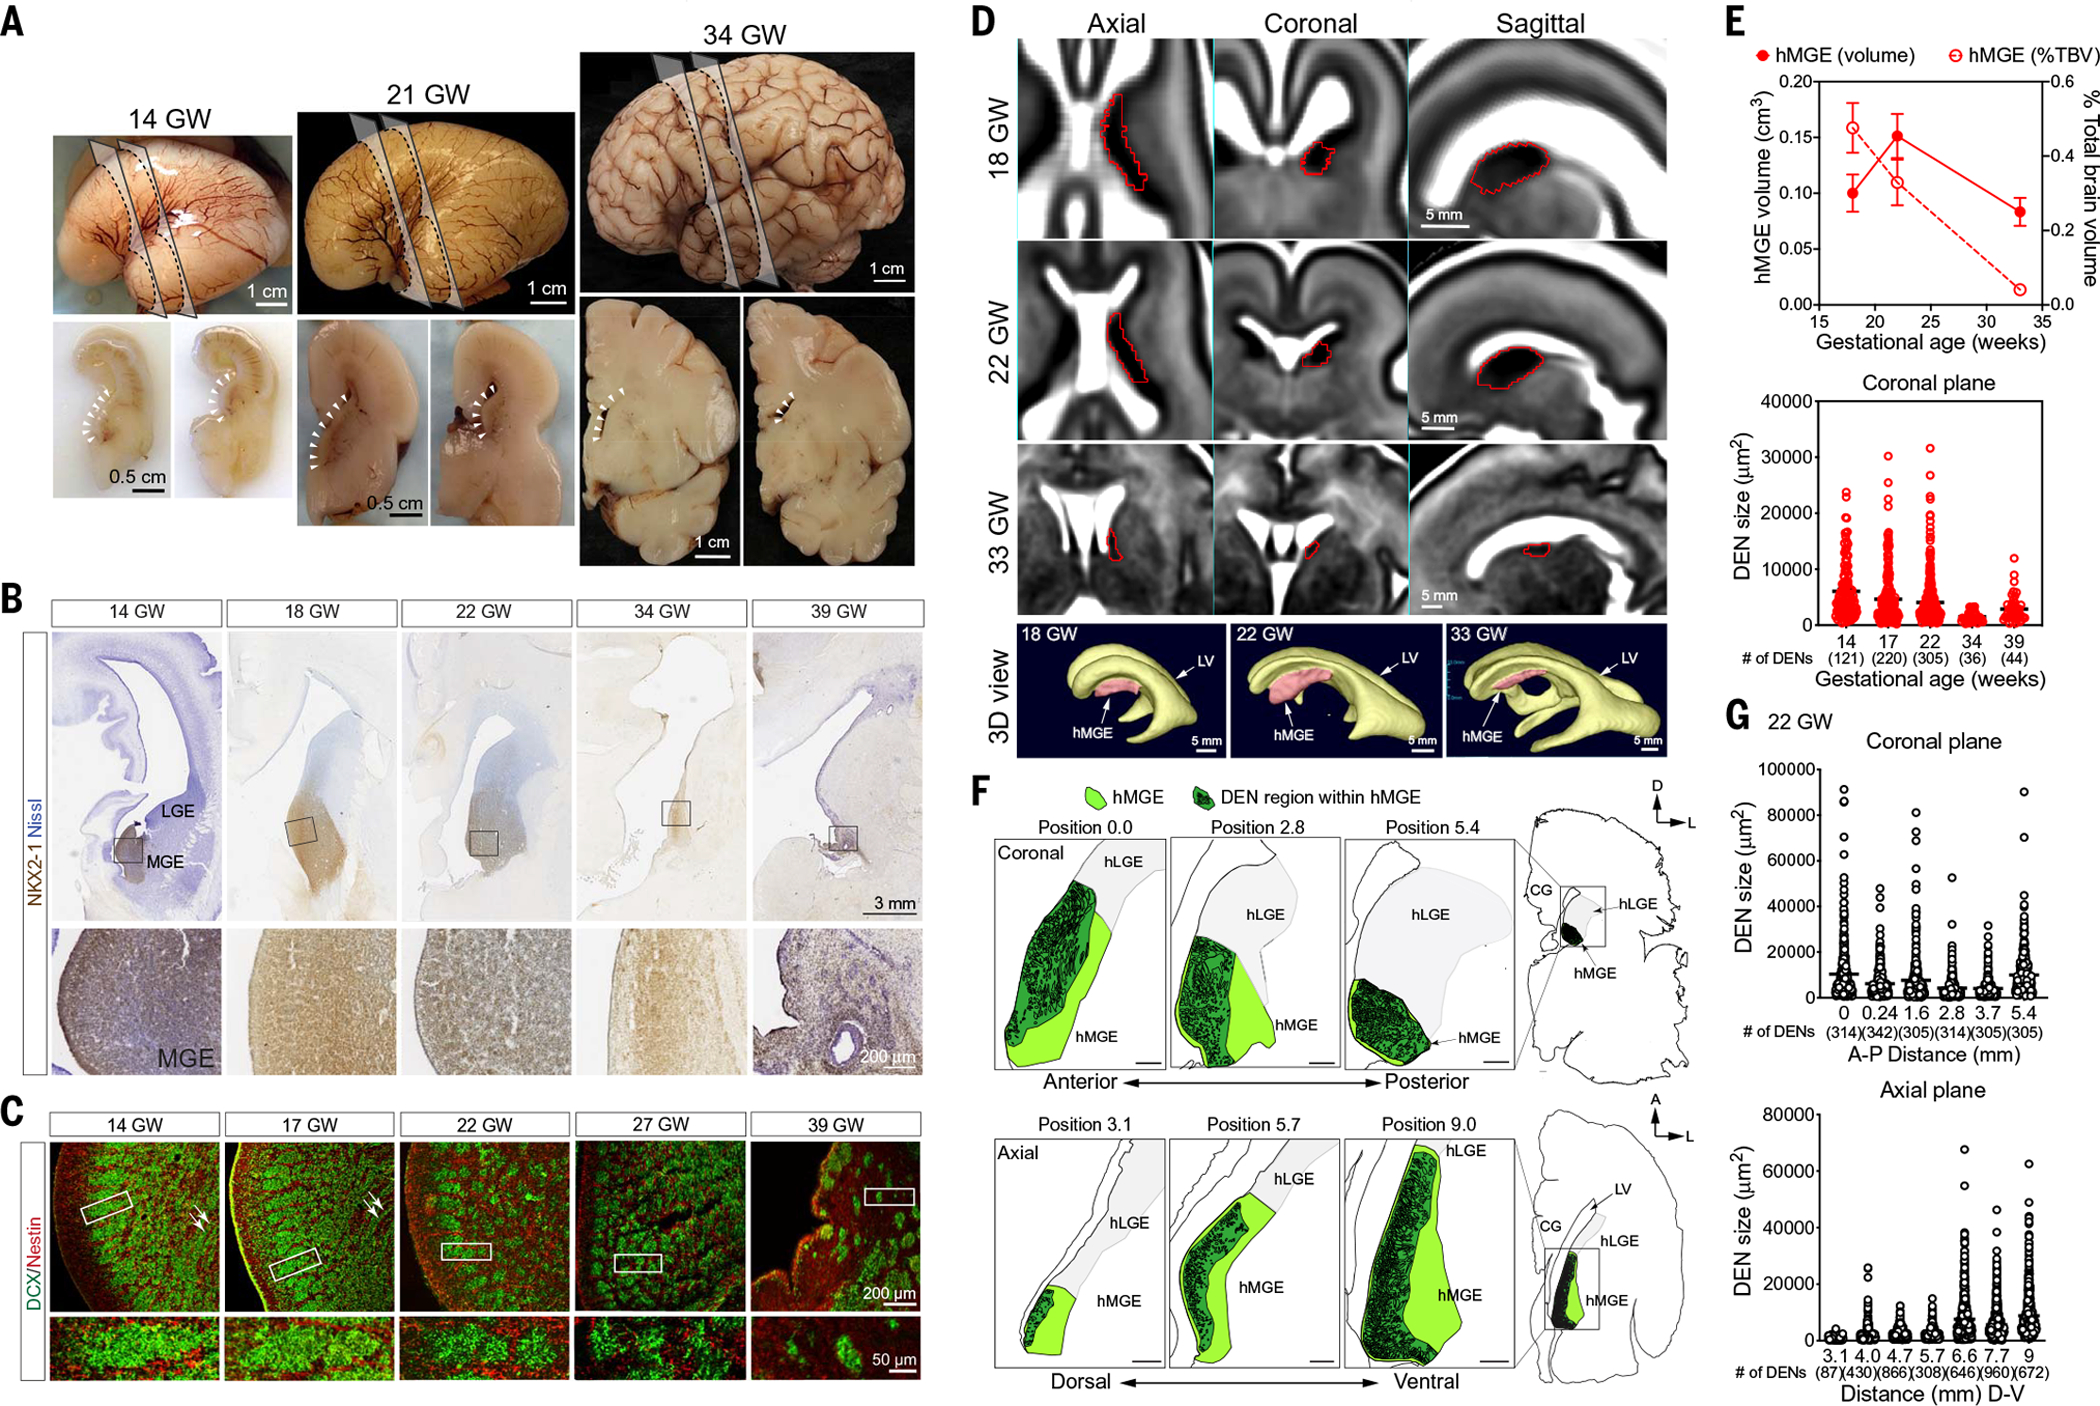
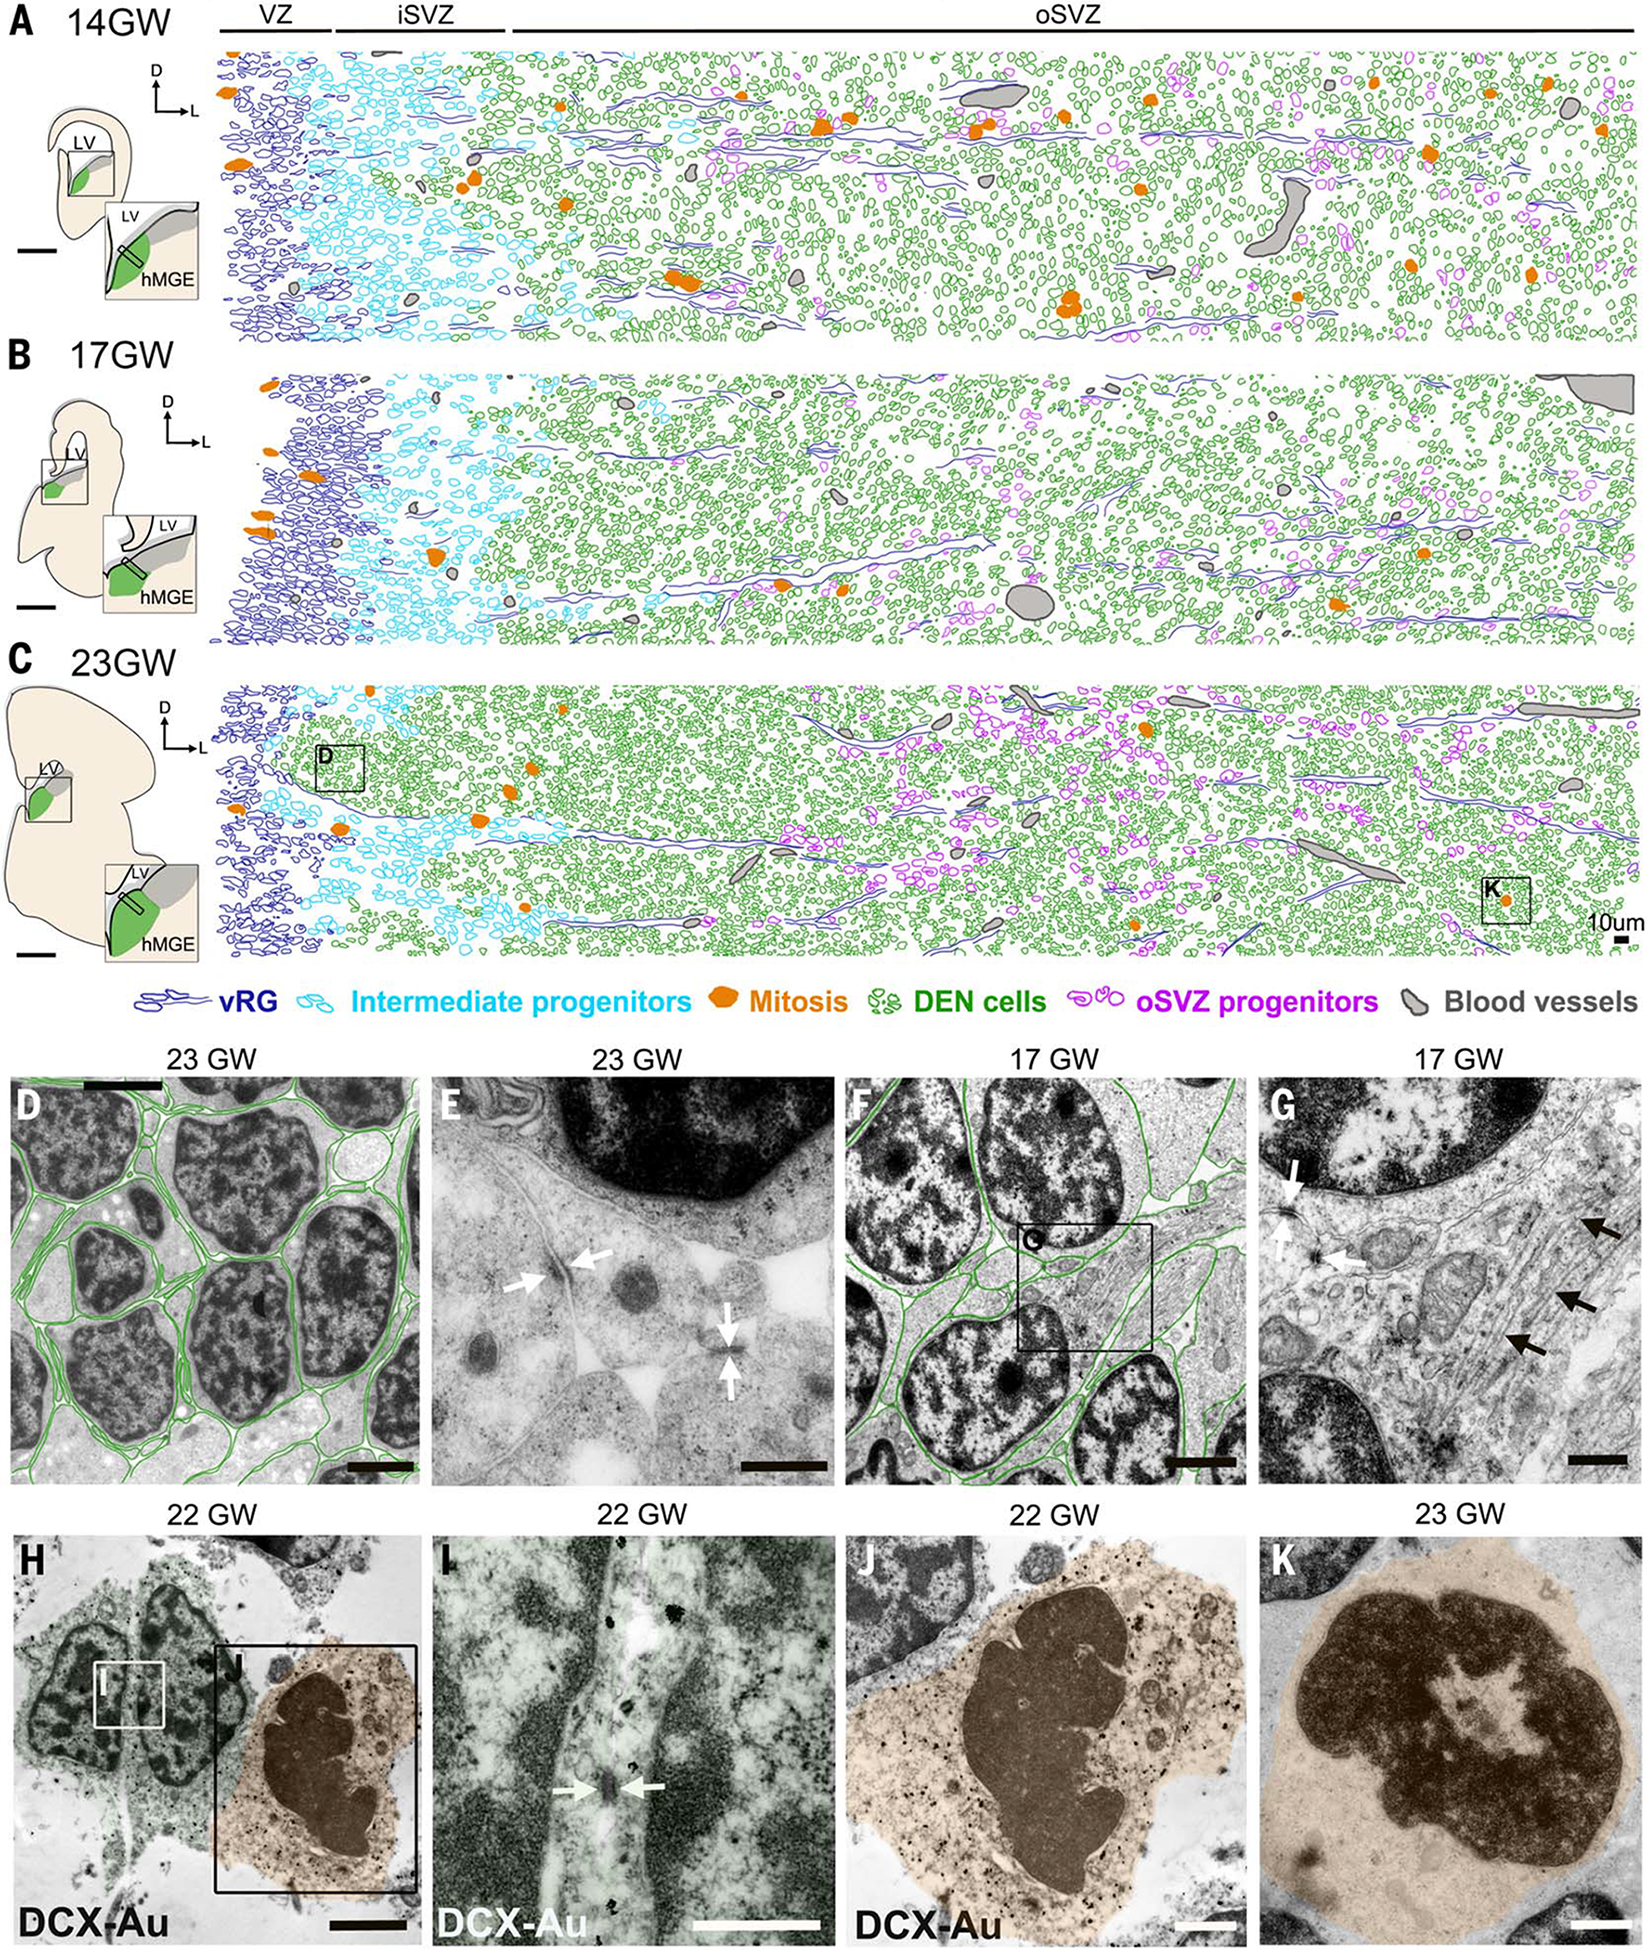
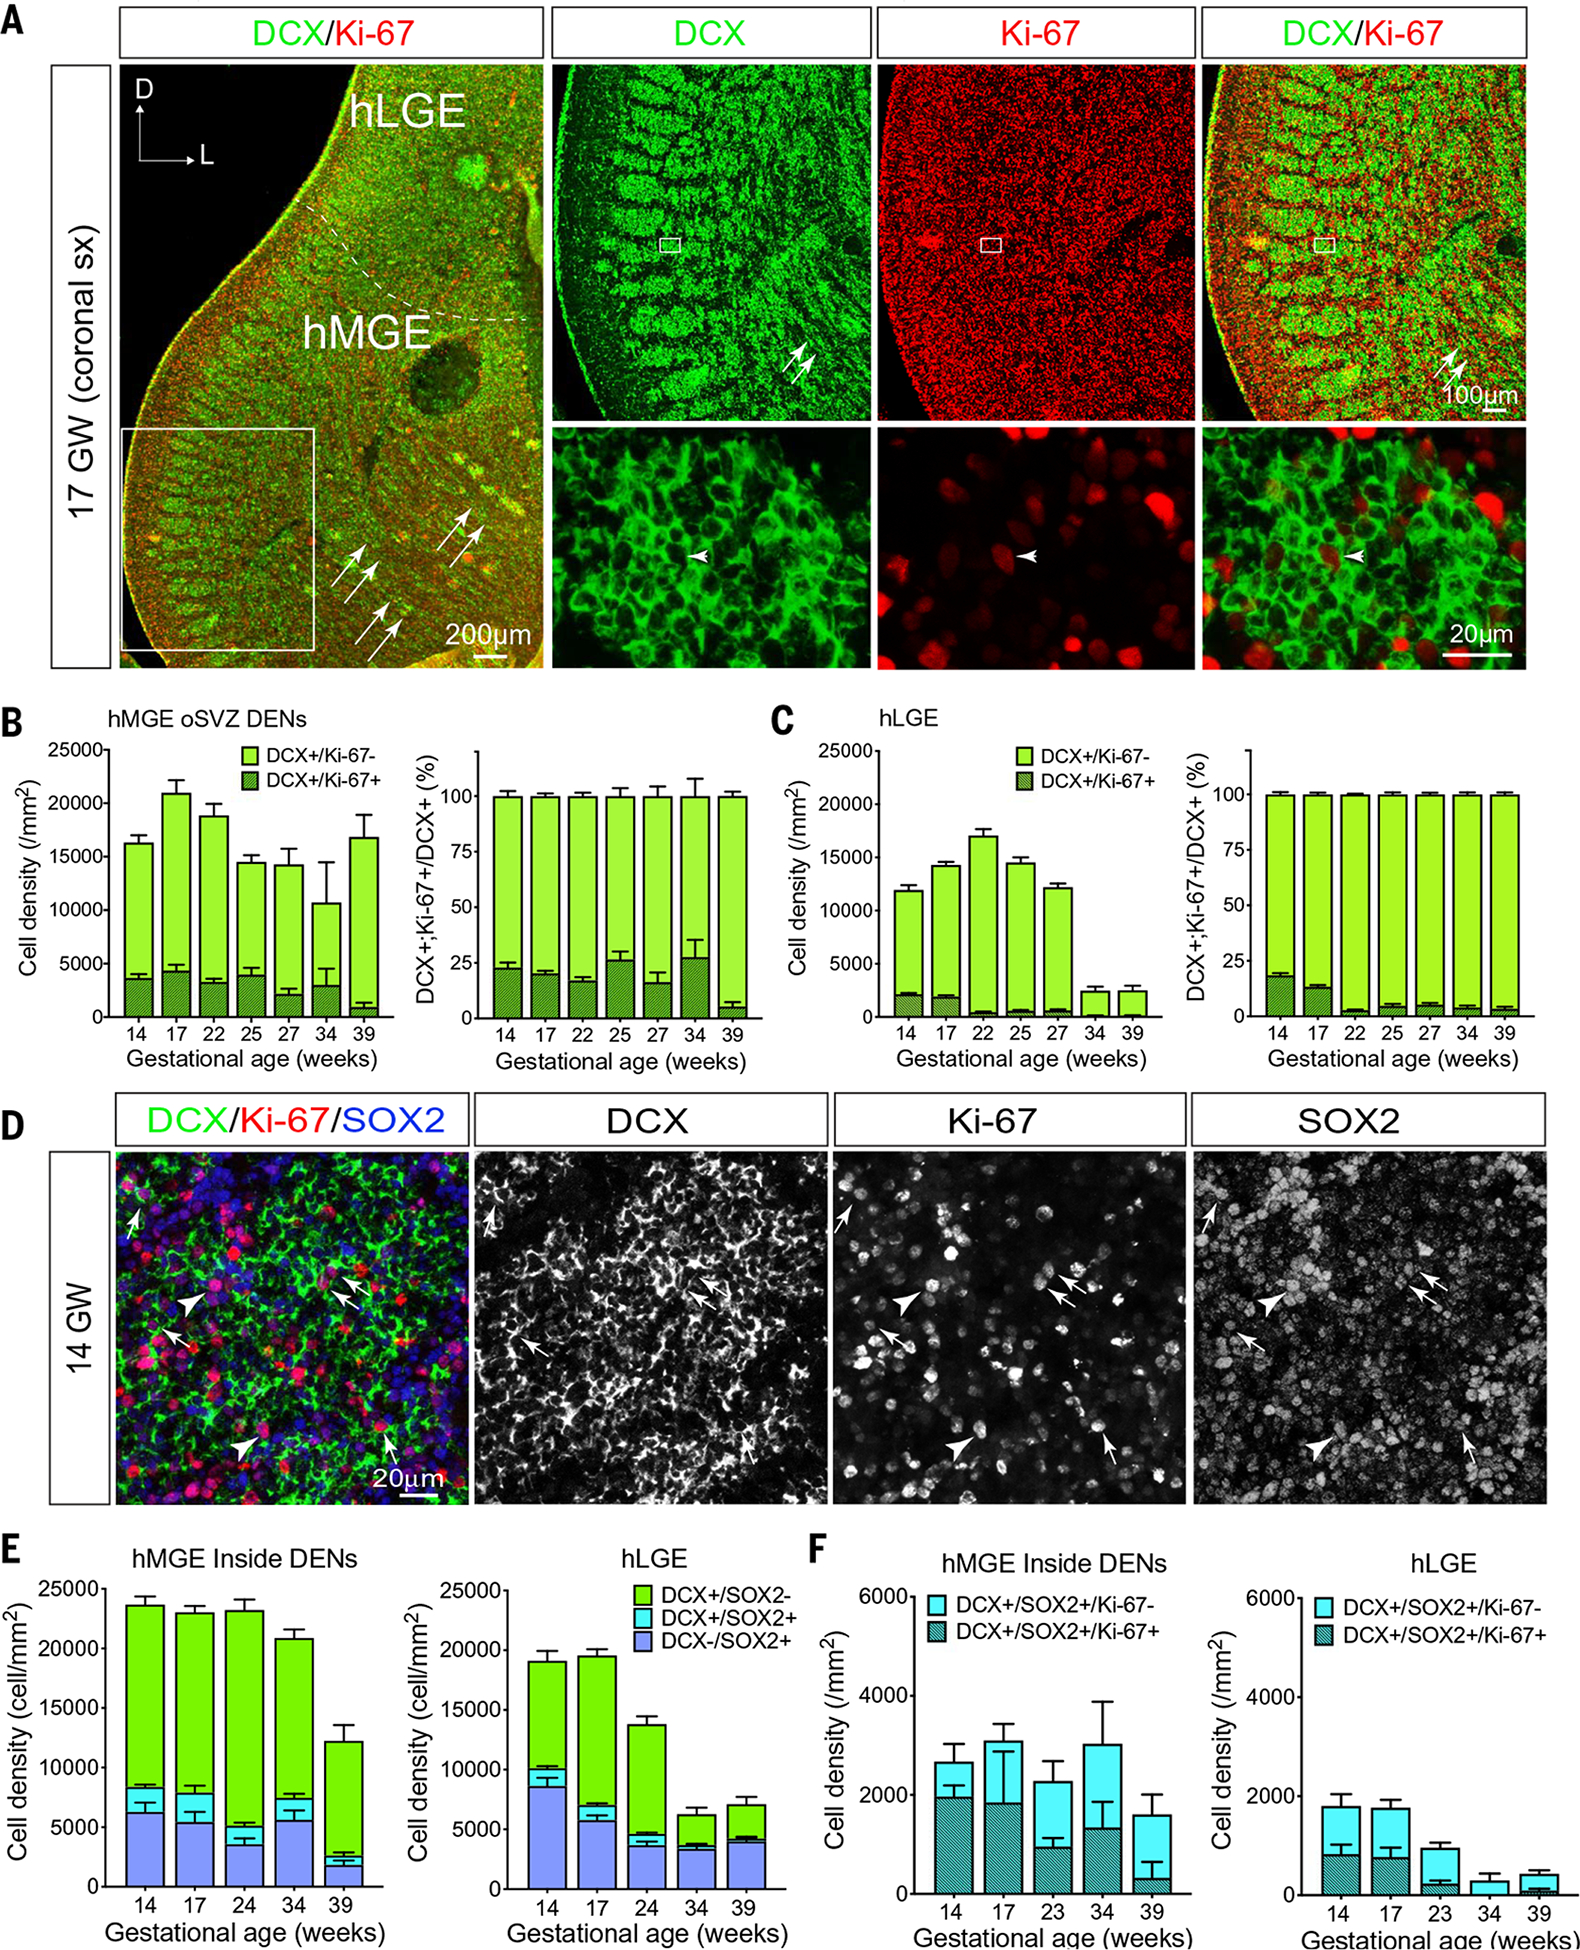
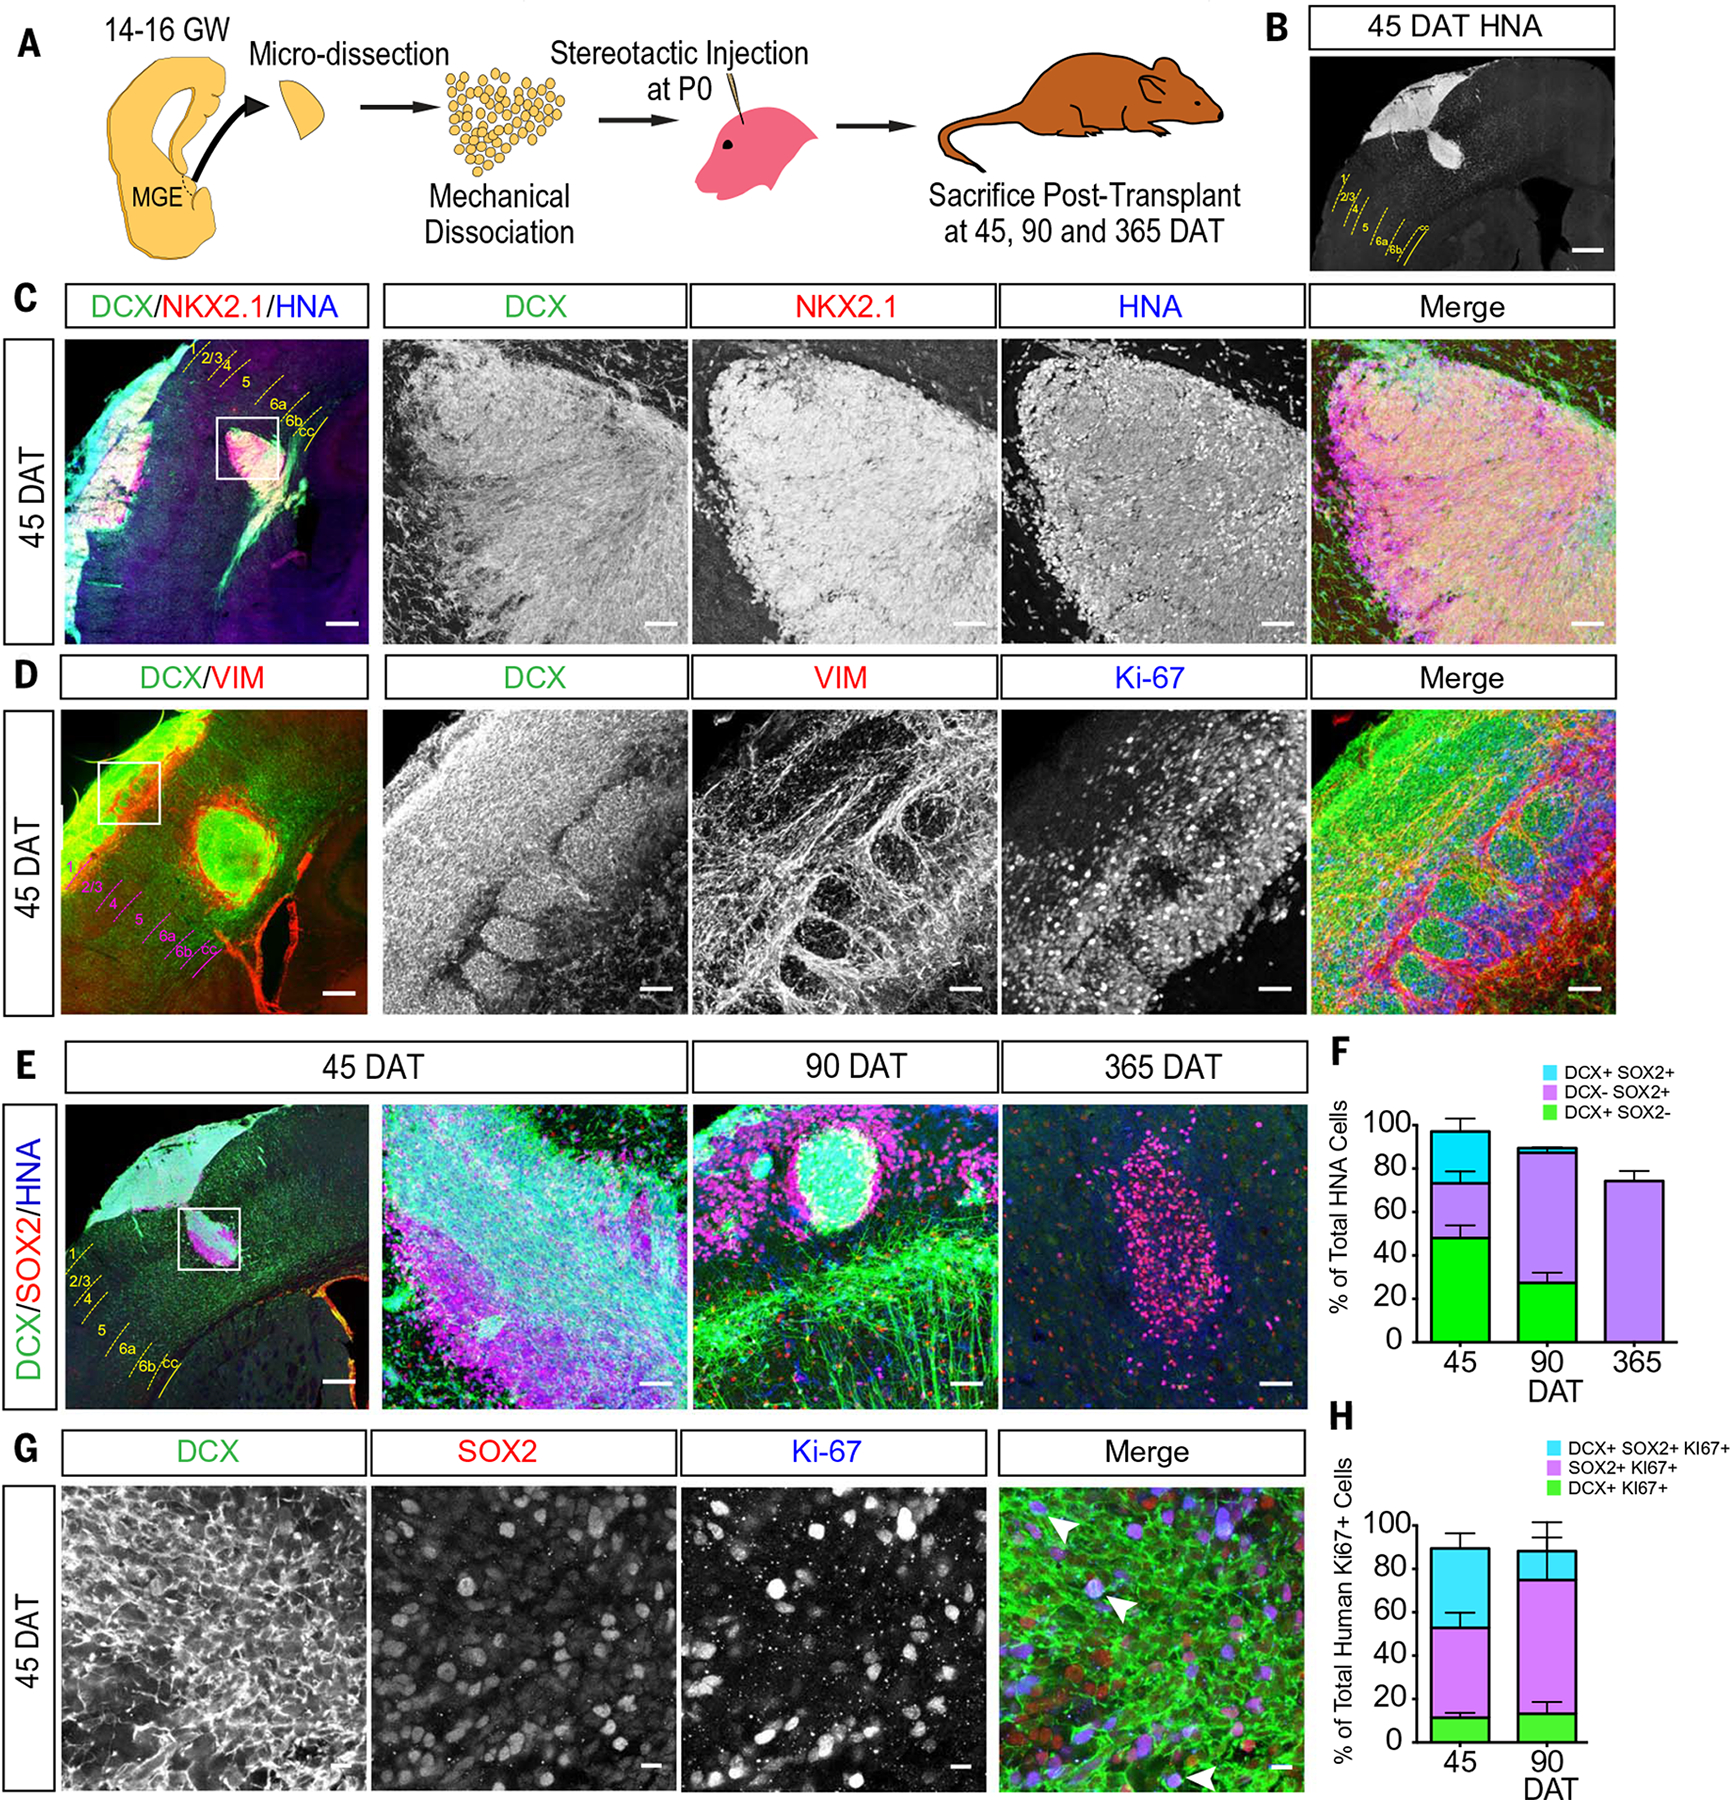
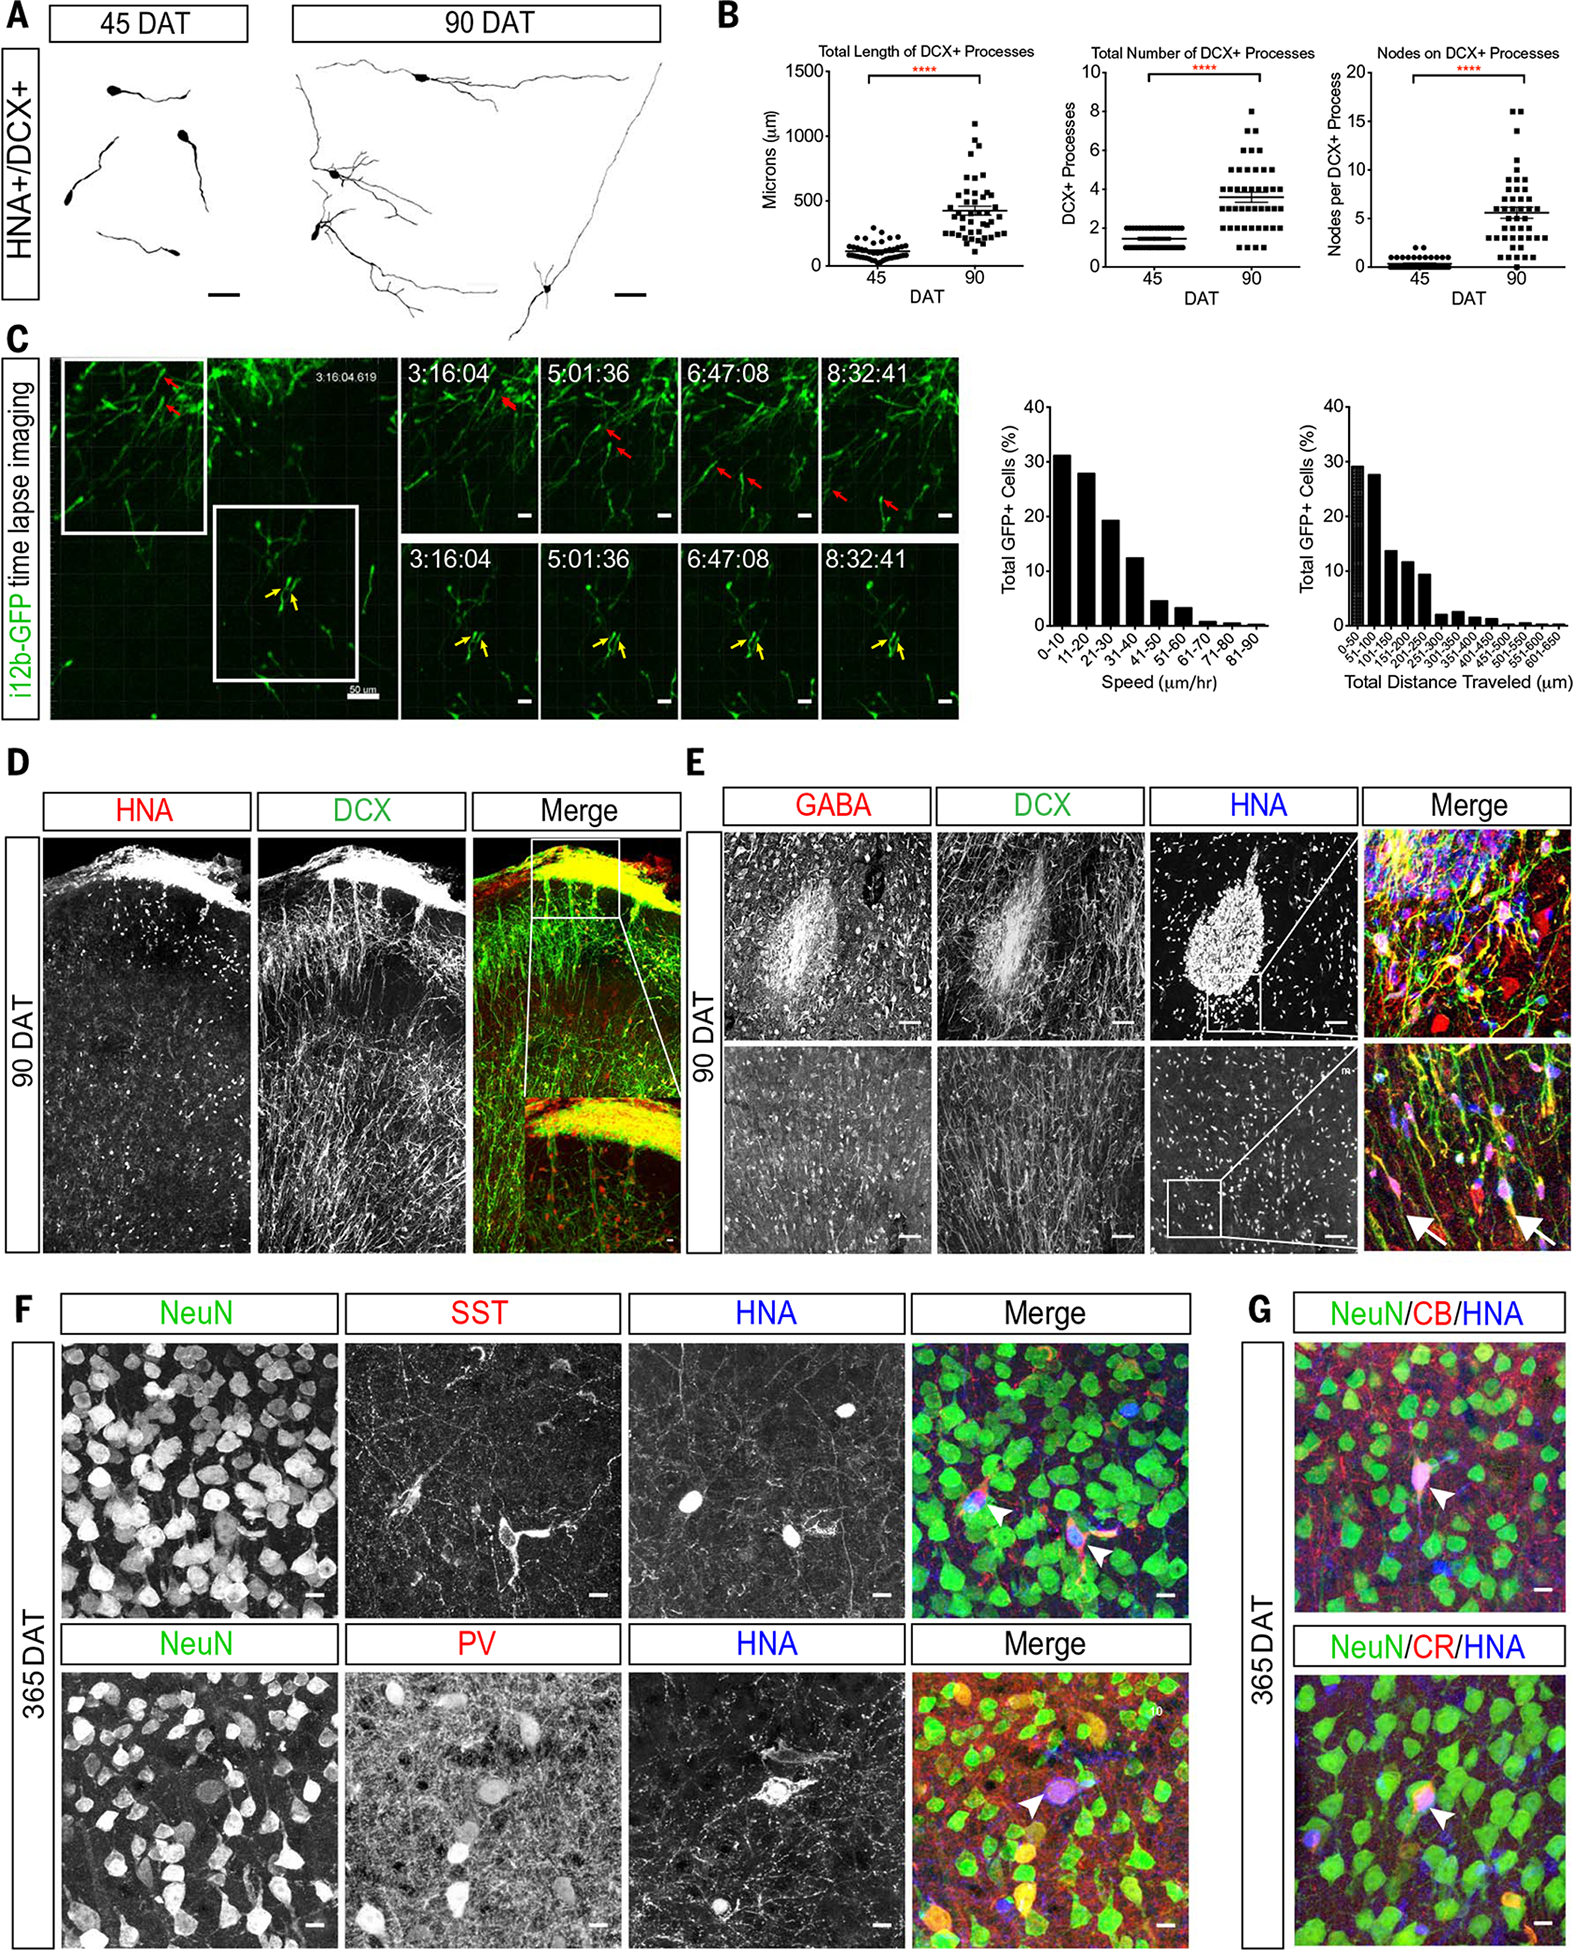
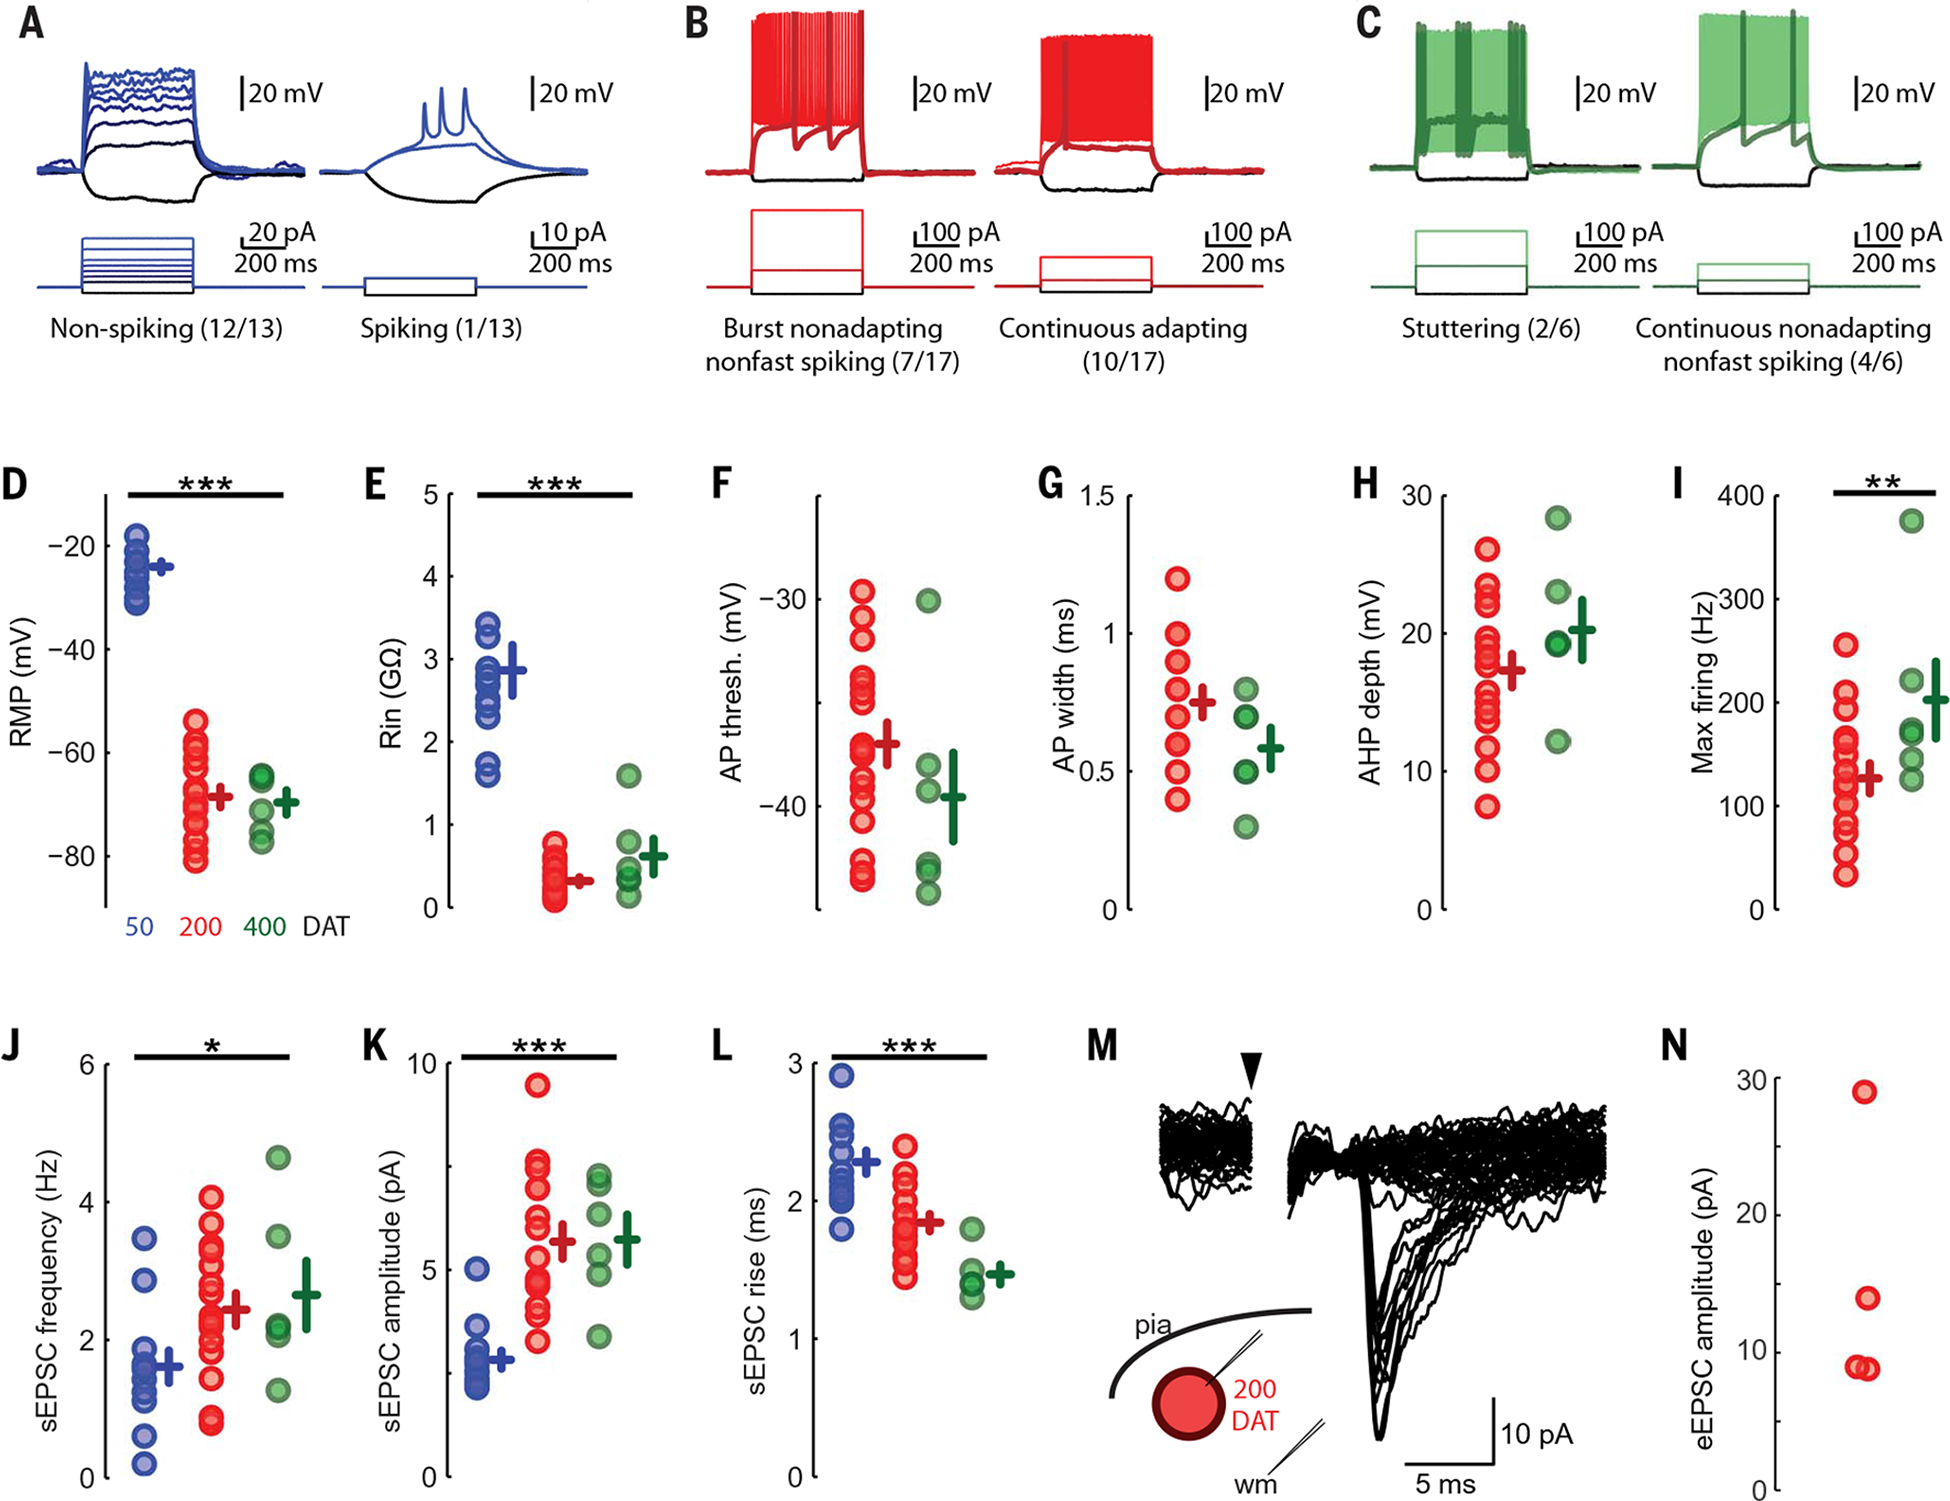
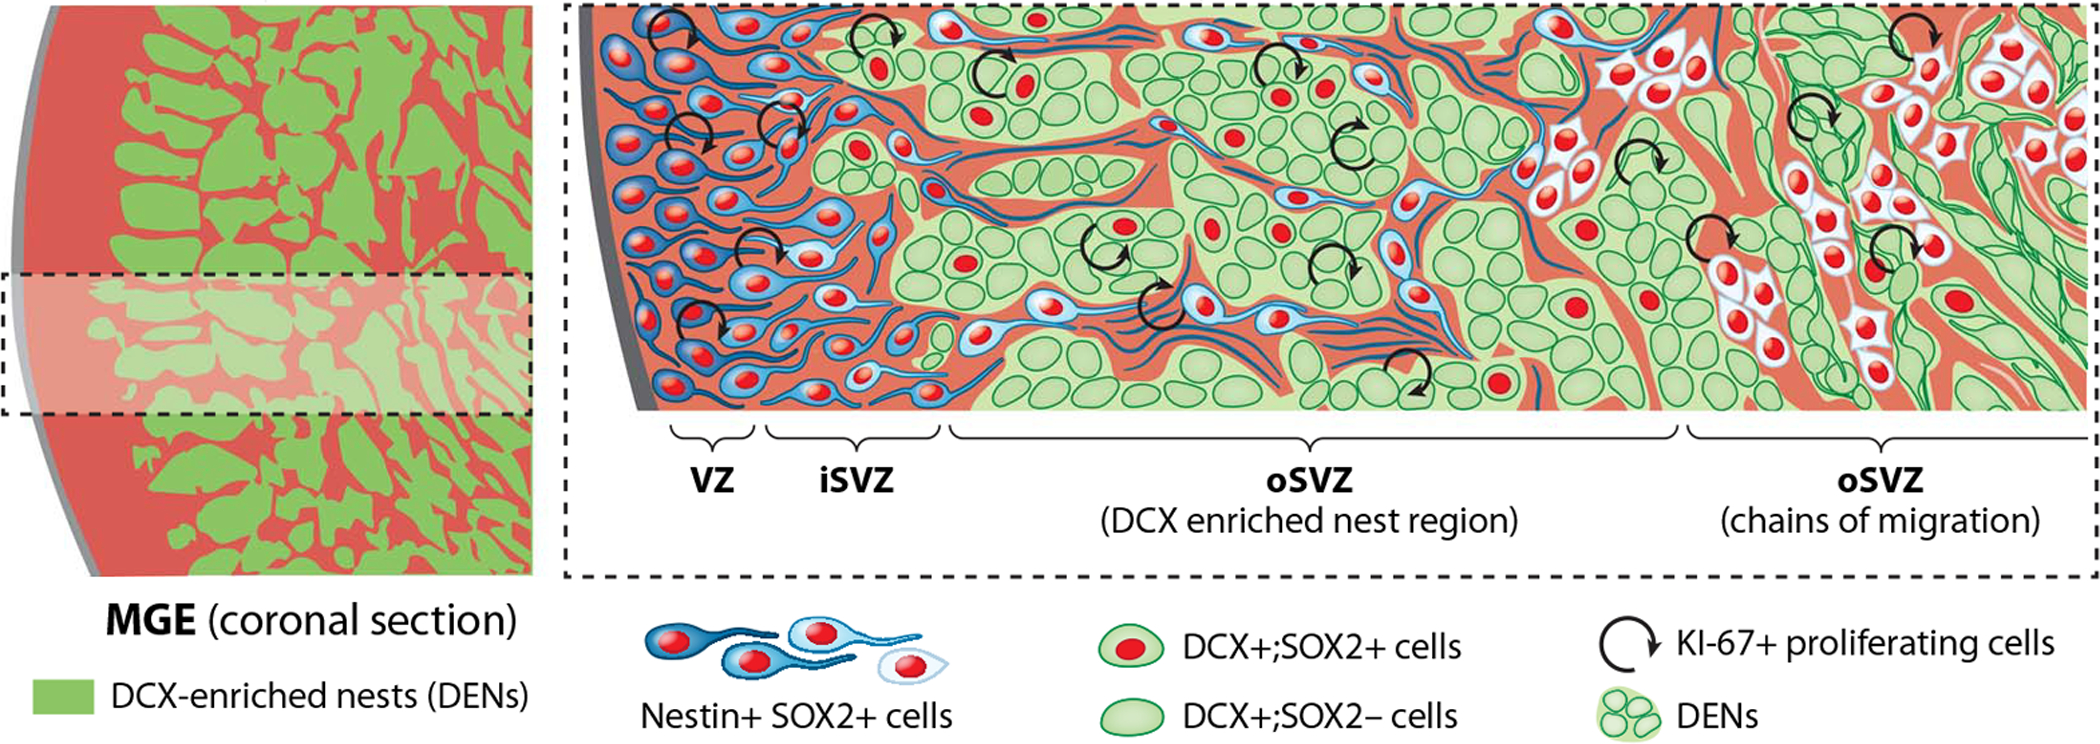
The human cortex contains inhibitory interneurons derived from the medial ganglionic eminence (MGE), a germinal zone in the embryonic ventral forebrain. How this germinal zone generates sufficient interneurons for the human brain remains unclear. We found that the human MGE (hMGE) contains nests of proliferative neuroblasts with ultrastructural and transcriptomic features that distinguish them from other progenitors in the hMGE. When dissociated hMGE cells are transplanted into the neonatal mouse brain, they reform into nests containing proliferating neuroblasts that generate young neurons that migrate extensively into the mouse forebrain and mature into different subtypes of functional interneurons. Together, these results indicate that the nest organization and sustained proliferation of neuroblasts in the hMGE provide a mechanism for the extended production of interneurons for the human forebrain.


Conflict of interest statement

Competing interests: P.L. is currently an employee of Vertex Pharmaceuticals and owns shares in the company. A.A.-B. is co-founder and on the scientific advisory board of Neurona Therapeutics.

Figures

Fig. 1.
Fig. 1.. hMGE organization in the prenatal and perinatal brain.
(A) Lateral views (top) and coronal cross sections (bottom) of the prenatal human brain at 14, 21, and 33 GW. Dashed lines indicate the locations where the coronal sections are made; arrowheads indicate the location of human ganglionic eminences located next to the lateral walls of the lateral ventricles. (B) Immunohistochemical stains for NKX2-1 in the hMGE at 14, 18, 22, 34, and 39 GW. NKX2-1 shows a robust expression from 14 to 22 GW. Despite the decrease in hMGE size at 34 GW, NKX2-1 expression remains high. At 39 GW, NKX2-1 expression in the hMGE is reduced to a thin slit along the subventricular zone. (C) Confocal images of the hMGE from 14 to 39 GW reveal the unique organization of dense DCX+ nests that intermix with nestin+ fibers. (D) MRI images of prenatal hMGE (highlighted in red) on the axial, coronal, and sagittal planes at 18, 22, and 33 GW. Three-dimensional (3D) reconstruction highlights the position of the hMGE in relationship to the lateral ventricle (LV) at the respective ages. (E) Top: Quantification of hMGE volume relative to total brain volume by MRI images at 18, 22, and 33 GW. By cross-referencing NKX2-1 expression patterns and MRI images of human GE, we found that hMGE volume increased from 115 + 15 mm3 at 18 GW to 158 + 13 mm3 at 22 GW, then decreased to 88 + 3 mm3 at 33 GW. Data are means ± SD; n = 10 each gestational age. Bottom: Quantification of the size of DEN in hMGE on the coronal planes shows the progressive reduction in size from 14 to 39 GW. The average area of a DEN in coronal sections decreased from 6053 + 452 μm2 at 14 GW to 4052 + 242 μm2 at 22 GW, and dropped further to 2870 + 360 μm2 39 GW. The number of DENs for each gestational age is included in parentheses. (F) Schematic diagrams highlighting DENs (dark green) in hMGE (light green) in 22 GW prenatal brain at the coronal plane (top) and axial plane (bottom) relatively similar sizes of DCX+ nests. The adjacent hLGE is shaded light gray. The positions of the hMGE indicated on the coronal plane are from anterior (position 0.0) to posterior (position 5.4). On the axial plane, the positions of the hMGE are from top (position 3.1) to bottom (position 9.0). Scale bars, 500 μm (G) Top: Quantification of DEN size in the hMGE at 22 GW shows similar sizes from anterior to posterior on the coronal plane. Bottom: DEN size appears to become progressively larger from top to bottom on the axial plane.
Fig. 2.
Fig. 2.. Ultrastructural characteristics of DENs in the hMGE.
(A to C) Schematics of 14, 17, and 23 GW hMGE in coronal sections used to map identified cell types in TEM ultrathin section micrographs. Ventricular radial glia (vRG) (dark blue), intermediate progenitors (cyan), mitoses (orange), DEN cells (green), outer subventricular zone (oSVZ) progenitors (purple), and blood vessels (gray) were identified by ultrastructural characteristics (table S2 and fig. S4). (D) DEN cells close to the lateral ventricle in (C) showed scarce cytoplasm and thin interdigitated expansions oriented in all directions (DEN cell cytoplasm outlined in green). (E) High magnification of DEN cell expansions showing frequent small adherens junctions (white arrows). (F and G) DEN cells deep into the hMGE showing long cell expansions rich in mitochondria and microtubules (black arrows). Note that contacts through small adherens junctions were frequent (white arrows). (H to J) Immunogold TEM of DCX+ cells within DENs in 22 GW hMGE. Note that DCX-Au+ cells show scarce cytoplasm and small adherens junctions (white arrows). DCX-Au+ mitotic figures inside DENs were also observed. (K) Mitotic figure within DEN in (C). Scale bars, 0.5 mm [(A) to (C)], 2 μm [(D), (F), and (H)], 500 nm [(E), (G), and (I)], 1 μm [(J) and (K)].
Fig. 3.
Fig. 3.. DCX+ cells proliferate in the human ganglionic eminences.
(A) Left: Confocal image of a coronal section of 17 GW hMGE and hLGE immunostained with DCX (green) and Ki-67 (red). Dashed line highlights the boundary that separates the hLGE and hMGE; arrows indicate streams of DCX+ cells migrating away from DENs at the edge of the hMGE. Right: Higher magnifications of DENs in the boxed area in the left panel (top row) where many DCX+ cells show positive staining for Ki-67 (bottom row); arrowhead points to a DCX+/Ki-67+ cell in DENs. (B and C) Quantification of DCX+/Ki-67+ cells and DCX+/Ki-67 cells in hMGE (B) and hLGE (C) at 14, 17, 22, 25, 27, 34, and 39 GW. DCX+/Ki-67+ cells and DCX+/Ki-67 cells are presented as cell density (number of cells per mm2) (left panels); in addition, DCX+/Ki-67+ cells are presented as the percentage of DCX+ cells (right panels). Data are means ± SEM. (D) Confocal images of hMGE at 14 GW immunostained with DCX, Ki-67, and SOX2 antibodies. Arrows in the merged panel and individual channels highlight DCX+/SOX2+/Ki-67+ cells; arrowhead indicates a DCX/SOX2+/Ki-67+ cell within DENs. (E and F) Quantifications DCX+/SOX2, DCX+/SOX2+, and DCX/SOX2+ progenitors (E) and DCX+/SOX2+ progenitors that are still in the cell cycle (Ki-67+ already exited cell cycle (Ki-67) (F) in hMGE and hLGE at 14, 17, 24, 34, and 39 GW. Data are means ± SEM and are presented as cell density (number of cells per mm2).
Fig. 4.
Fig. 4.. Transplanted hMGE cells recapitulate DEN organization and proliferation.
(A) Schematic of hMGE transplantation surgery. (B) Coronal section indicating injection site of HNA+ cells (white) at 45 DAT. Dashed lines delimit cortical layers; cc, corpus callosum. (C) HNA+ cells at the injection site at 45 DAT express DCX and NKX2.1. The transplant (boxed area of the leftmost panel) is shown at higher magnification. (D) Transplanted hMGE cells form dense DCX+ nests encased by VIM+ radial glia fibers at the site of injection at 45 DAT. The transplant (boxed area of the leftmost panel) is shown at higher magnification. Many VIM+ and DCX+ cells are Ki-67+. (E) HNA+ (blue) cells at injection sites express DCX and SOX2 at 45, 90, and 365 DAT. (F) Quantification of proportion of total HNA+ cells at the injection site (45 DAT, n = 4; 90 DAT, n = 2; 365 DAT, n = 3) that are DCX+ (green), SOX2+ (purple), or DCX+/SOX2+ (cyan). Data are means ± SEM. (G) High magnification of DCX+, SOX2+, and Ki-67+ cells in DENs at 45 DAT. (H) Quantification of proportion of HNA+/Ki-67+ cells at the injection site (45 DAT, n = 4; 90 DAT, n = 2; 365 DAT, n = 3) that are DCX+ (green), SOX2+ (purple), or DCX+/SOX2+ (cyan). Data are means ± SEM. Scale bars, 500 mm [(B) and leftmost panel in (C) to (E)], 50 μm [other panels in (C) to (E)], 10 μm (G).
Fig. 5.
Fig. 5.. Transplanted hMGE cells display migratory and functional interneuronal features.
(A) Neurolucida tracings of DCX+ transplanted hMGE at 45 and 90 DAT (four cells shown per time point). (B) Quantification of the length (left) and total number (center) of DCX-positive processes at 45 and 90 DAT. Right graph shows quantification of the number of DCX+ branching nodes per transplanted cell analyzed at 45 or 90 DAT. For all graphs, n = 22 cells per animal for both 45 and 90 DAT; ****P < 0.0001. (C) Left: Sequential images of time-lapse confocal microscopy showing two example sets (red and yellow arrows) of GFP+ transplanted hMGE cells at 21 DAT. Right: Proportion of GFP-positive transplanted hMGE cells (total 395 cells) analyzed for speed (left) and total distance traveled (right). (D) Confocal image of transplanted mouse cortex at 90 DAT showing dispersal of HNA+DCX+ cells. Inset shows boxed area at higher magnification. (E) Top: Injection site at 90 DAT contains cells that coexpress DCX, GABA, and HNA. Bottom: Transplanted hMGE cells away from the injection site also coexpress DCX and GABA (arrows). (F) Examples of transplanted hMGE cells at 365 DAT that express NeuN (green) and HNA (blue) either with SST (red, arrowheads in top panel) or PV (red, arrowhead in bottom panel). (G) Examples of transplanted hMGE cells at 365 DAT that express NeuN, calbindin (CB+, arrowhead in top), and calretinin (CR+, arrowhead in bottom). Scale bars, 50 μm [(A), (C) (leftmost panel), (E)], 25 μm [(C) (upper and lower rows)], 10 μm [(D) (inset), (F), (G)].
Fig. 6.
Fig. 6.. Physiological parameters of hMGE cells after transplantation.
(A) hMGE cells at 50 DAT demonstrate immature action potentials with either minimal regenerative current (left) or a few short/broad action potentials (right). (B) hMGE cells at 200 DAT have regenerative action potentials (17/17 tested) that occur in one of two distinct temporal patterns, either burst nonadapting nonfast spiking (left) or continuous adapting (right). (C) hMGE cells at 400 DAT have action potentials in either a stuttering pattern (left) characteristic of fast-spiking interneurons or a continuous nonadapting phenotype (right). (D and E) Passive physiological properties changed over maturation with a significant hyperpolarization of resting membrane potential [(D), P < 10−18 by one-way analysis of variance (ANOVA)] and a significant decrease in input resistance [(E), P < 10−10 by one-way ANOVA]. (F to I) Active membrane properties were not assessed in 50 DAT transplant-derived cells because they almost uniformly did not fire action potentials. There were no significant changes to the action potential threshold (F) or width (G), the action potential after hyperpolarization (AHP) depth (H), or the maximal firing rate [(I), by two-sample Kolmogorov-Smirnov test]. (J) All cells recorded had clearly identifiable EPSCs at 50 DAT, but sEPSC frequency increased significantly at 200 and 400 DAT (P = 0.038 by one-way ANOVA). (K and L) sEPSC amplitude also increased upon maturation (P < 10−5 by one-way ANOVA) (K), whereas rise time decreased (L) (P < 10−6 by one-way ANOVA). (M and N) EPSCs evoked by deep white matter stimulation >500 μm from the recorded soma (M) demonstrate small eEPSCs (20 sequential traces at minimal stimulation amplitude) in all cells in which extracellular stimulation was attempted (N). *P < 0.05, **P < 0.01, ***P < 0.001.
Fig. 7.
Fig. 7.. The developing hMGE contains multiple layers of proliferating nestin+ progenitors and DCX+ neuroblasts.
Left: Schematic overview of hMGE showing organization of progenitor regions (red) surrounding DCX+ cells (green regions). Right: Higher magnification of the boxed area at left. DCX+ cells (green) are organized into DENs surrounded by nestin+/SOX2+ progenitors (illustrated in different shades of blue to white). Cell proliferation was observed among DCX+ cells in DENs until the end of gestation (see text). Nestin+/SOX2+ progenitors are also proliferative and are found within the VZ, the inner SVZ (iSVZ), and around DENs in the outer SVZ (oSVZ). Nestin+ progenitors and fibers surround DENs and are organized into tight bundles, previously identified as type I clusters (10) (light blue cells) in the initial segment of the oSVZ. In the outer part of the oSVZ, DENs transition to chains of migrating cells, and nestin+ progenitor cells are arranged as type II clusters (10). [Illustration by Noel Sirivansanti]

Comment in

References

    1. Canitano R, Pallagrosi M, Autism Spectrum Disorders and Schizophrenia Spectrum Disorders: Excitation/Inhibition Imbalance and Developmental Trajectories. Front. Psychiatry 8, 69 (2017). doi: 10.3389/fpsyt.2017.00069 - DOI - PMC - PubMed
    1. Chattopadhyaya B, Cristo GD, GABAergic circuit dysfunctions in neurodevelopmental disorders. Front. Psychiatry 3, 51 (2012). doi: 10.3389/fpsyt.2012.00051 - DOI - PMC - PubMed
    1. Marín O, Interneuron dysfunction in psychiatric disorders. Nat. Rev. Neurosci 13, 107–120 (2012). doi: 10.1038/nrn3155 - DOI - PubMed
    1. Wonders CP, Anderson SA, The origin and specification of cortical interneurons. Nat. Rev. Neurosci 7, 687–696 (2006). doi: 10.1038/nrn1954 - DOI - PubMed
    1. Anderson SA, Marín O, Horn C, Jennings K, Rubenstein JL, Distinct cortical migrations from the medial and lateral ganglionic eminences. Development 128, 353–363 (2001). doi: 10.1242/dev.128.3.353 - DOI - PubMed

Publication types

MeSH terms