. 2022 Jan 28;375(6579):411-418.
doi: 10.1126/science.aaz5284. Epub 2022 Jan 27.

The Blood Proteoform Atlas: A reference map of proteoforms in human hematopoietic cells

Affiliations

The Blood Proteoform Atlas: A reference map of proteoforms in human hematopoietic cells

Rafael D Melani et al. Science. .

Abstract

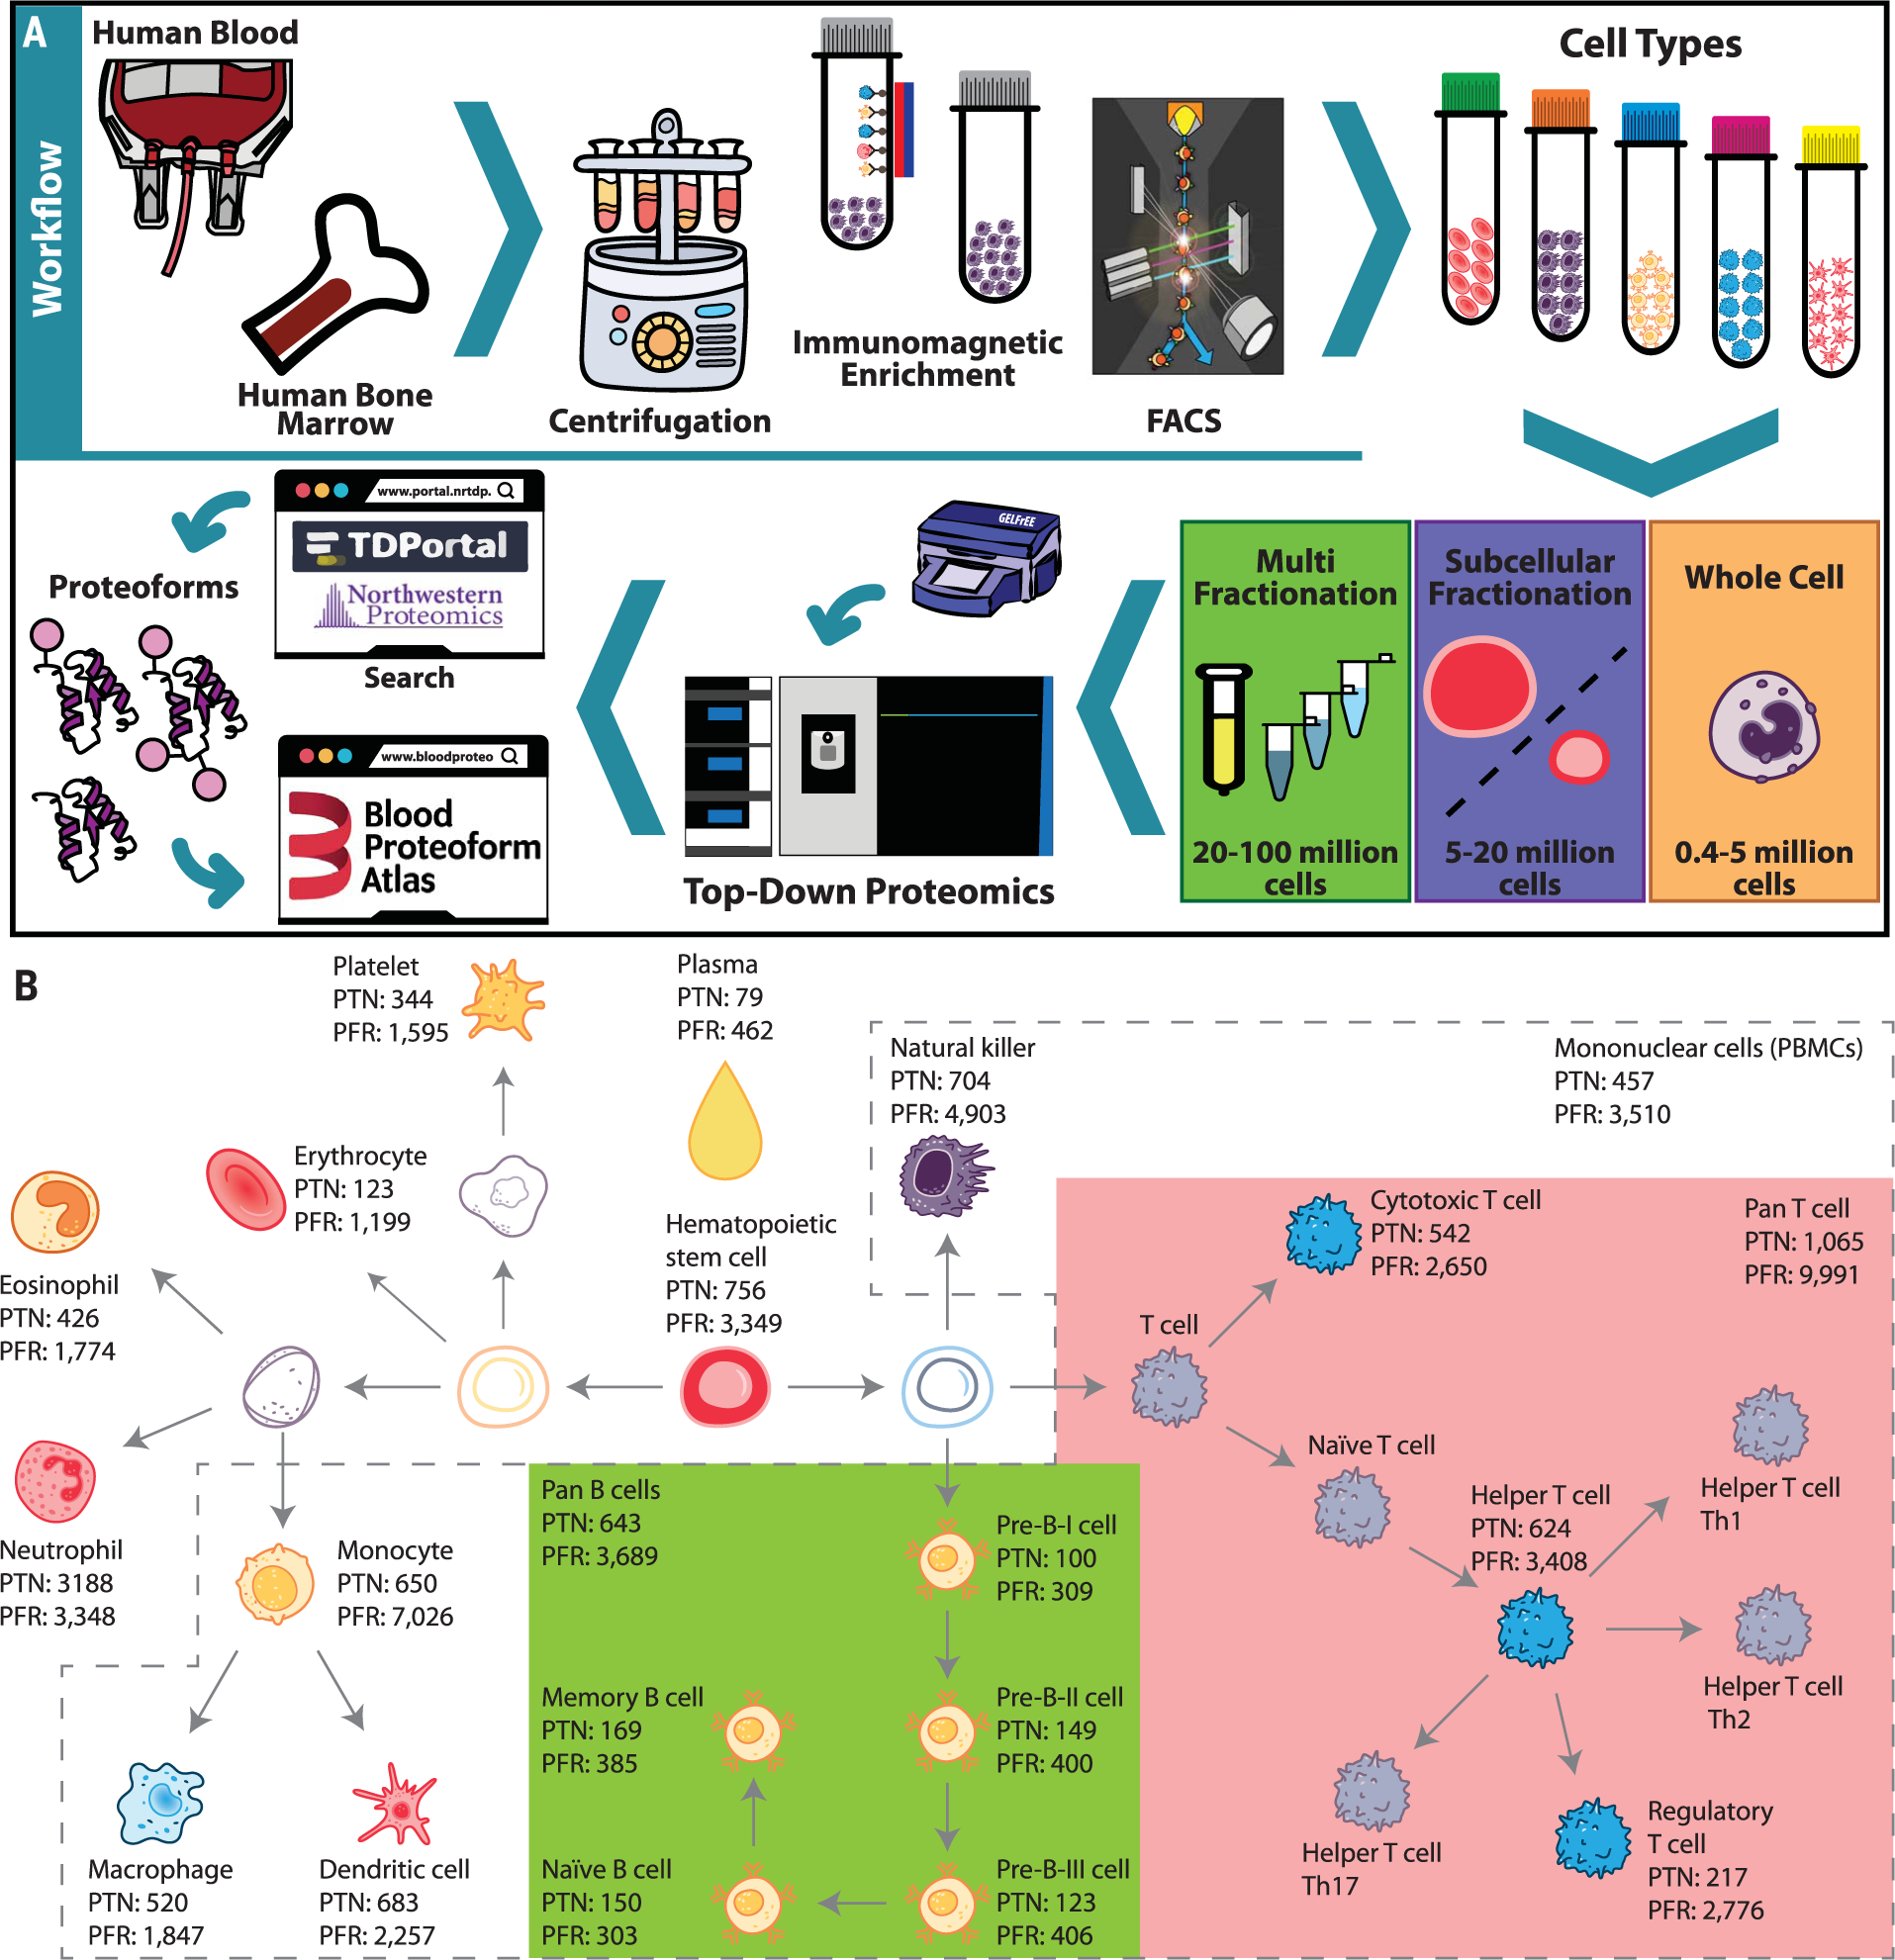
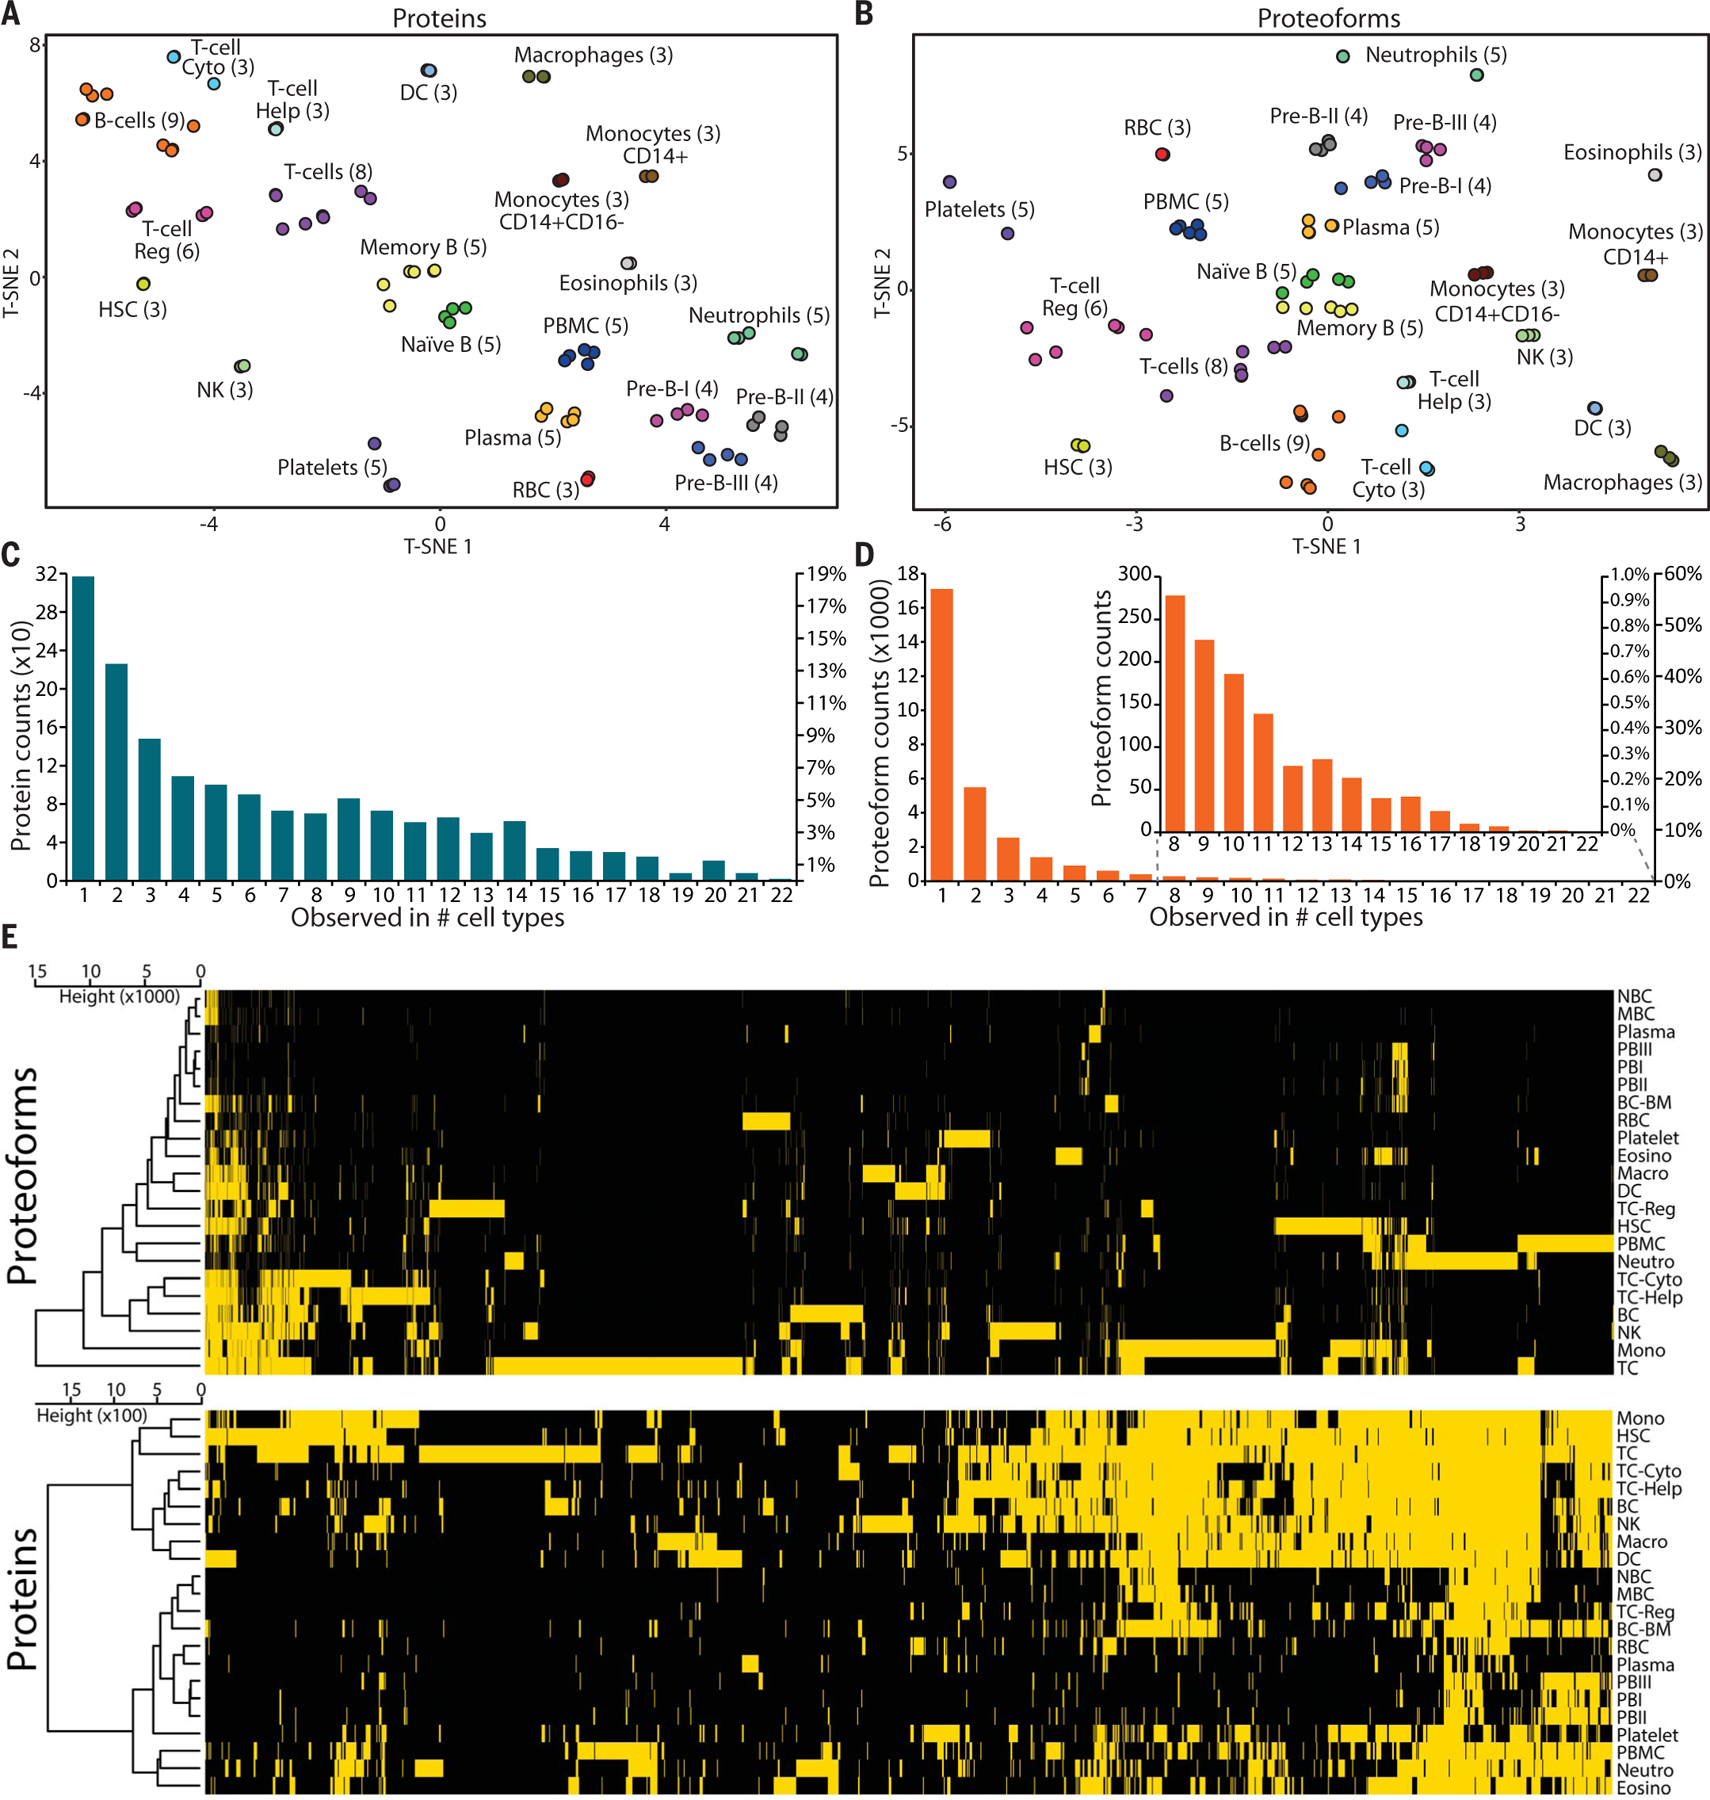
Human biology is tightly linked to proteins, yet most measurements do not precisely determine alternatively spliced sequences or posttranslational modifications. Here, we present the primary structures of ~30,000 unique proteoforms, nearly 10 times more than in previous studies, expressed from 1690 human genes across 21 cell types and plasma from human blood and bone marrow. The results, compiled in the Blood Proteoform Atlas (BPA), indicate that proteoforms better describe protein-level biology and are more specific indicators of differentiation than their corresponding proteins, which are more broadly expressed across cell types. We demonstrate the potential for clinical application, by interrogating the BPA in the context of liver transplantation and identifying cell and proteoform signatures that distinguish normal graft function from acute rejection and other causes of graft dysfunction.


Conflict of interest statement

Competing interests: N.L.K. is involved in entrepreneurial activities in top-down proteomics and consults for Thermo Fisher Scientific. A.I.K. is an employee of Stem Cell Technologies.

Figures

Fig. 1.
Fig. 1.. Workflow and number of identified proteoforms in the Blood Proteoform Atlas.
(A) Human blood or bone marrow samples were subjected to centrifugation, immunomagnetic enrichment, and/or FACS. Cell types were submitted to whole-cell, subcellular, and/or protein fractionation on the basis of the obtained cell amounts, followed by systematic proteoform discovery. Proteoforms were identified using a database search against the human proteome and deposited in the Blood Proteoform Atlas (BPA) website. (B) A map of hematopoiesis shows the number of proteoforms identified in each cell type. Certain cell groups (pan B cells, green; pan T cells, pink; and PBMCs, dashed gray lines) were also analyzed in pools. PTN, proteins; PFR, proteoforms.
Fig. 2.
Fig. 2.. Display of protein and proteoform analysis for entries in the Blood Proteoform Atlas.
t-SNE plots display cell types grouped by presence or absence of (A) proteins and (B) proteoforms. T-cell Cyto, cytotoxic T cells; T-cell Help, helper T cells; T-cell Reg, regulatory T cells; HSC, hematopoietic stem cells; DC, dendritic cells; RBC, red blood cells. Histograms of (C) proteins and (D) proteoforms shared by different cell types. (E) Heatmaps and cell type hierarchical clustering of identified (yellow) or not-identified (black) proteins (1690) and proteoforms (,620) at 1% FDR, with proteoforms exhibiting higher specificity for distinct cell types. NBC, naïve B cells; MBC, memory B cells; PBI, pre-B-I cells; BC-BM, B cells from bone marrow; Eosino, eosinophils; Macro, macrophages; Neutro, neutrophils; BC, B cells from blood; Mono, monocytes; TC, T cells.
Fig. 3.
Fig. 3.. Comparison of B cell subtypes using quantitative top-down proteomics.
Venn diagram analysis of (A) proteins and (B) proteoforms observed in pre-B-I, pre-B-II, and pre-B-III cells; naïve B cells; and memory B cells. (C) Heatmap and hierarchical clustering of quantified proteoforms from B cells subtypes. Numbers 1 to 3 represent the three major clusters of proteoforms found. (D) Volcano plot of up- and down-regulated proteoforms from naïve B cells (NB) relative to memory B cells (MB). (E) Box-and-whisker plots of proteoforms PFR1464 (TMSB4X) and PFR1215 (S100A6) levels show their variance among the five B cell subtypes. Fragmentation maps of (F) PFR1464 and (G) PFR1215. Red box indicates N-terminal acetylation. Single-letter abbreviations for the amino acid residues are as follows: A, Ala; C, Cys; D, Asp; E, Glu; F, Phe; G, Gly; H, His; I, Ile; K, Lys; L, Leu; M, Met; N, Asn; P, Pro; Q, Gln; R, Arg; S, Ser; T, Thr; V, Val; W, Trp; and Y, Tyr. (H) Distributions of proteoforms PFR1464 and PFR1215 in blood cell types of the BPA.
Fig. 4.
Fig. 4.. Quantitative top-down proteomics analysis of PBMC proteoforms from liver transplant recipients.
(A) Workflow used to compare patients with transplant excellent (TX); with acute dysfunction, no rejection (ADNR); and with acute rejection (AR). (B) The number of patients whose PBMCs were analyzed in an untargeted fashion. Volcano plot showing differentially expressed proteoforms in (C) AR patients relative to non-AR (TX+ADNR) and (D) TX patients relative to non-TX (ADNR+AR). (E) The number of patients whose PBMCs were analyzed for targeted proteoforms. Volcano plot with the relative levels of the 24 targeted proteoforms in (F) AR versus non-AR and (G) TX versus non-TX. (H) Distributions of the normalized spectral (N.S.) counts of proteins (left) and proteoforms (right) observed in BPA cell types.

References

    1. Picotti P et al., Nature 494, 266–270 (2013). - PMC - PubMed
    1. Battle A et al., Science 347, 664–667 (2015). - PMC - PubMed
    1. Kim MS et al., Nature 509, 575–581 (2014). - PMC - PubMed
    1. Wilhelm M et al., Nature 509, 582–587 (2014). - PubMed
    1. Thul PJ et al., Science 356, eaal3321 (2017). - PubMed

Publication types