. 2022 Jan 28;375(6579):eabf5546.
doi: 10.1126/science.abf5546. Epub 2022 Jan 28.

Amplification of human interneuron progenitors promotes brain tumors and neurological defects

Affiliations

Amplification of human interneuron progenitors promotes brain tumors and neurological defects

Oliver L Eichmüller et al. Science. .

Abstract

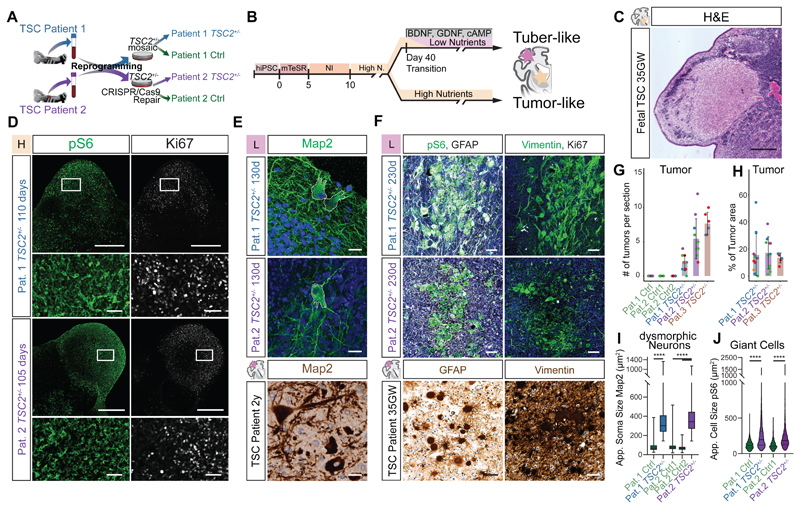
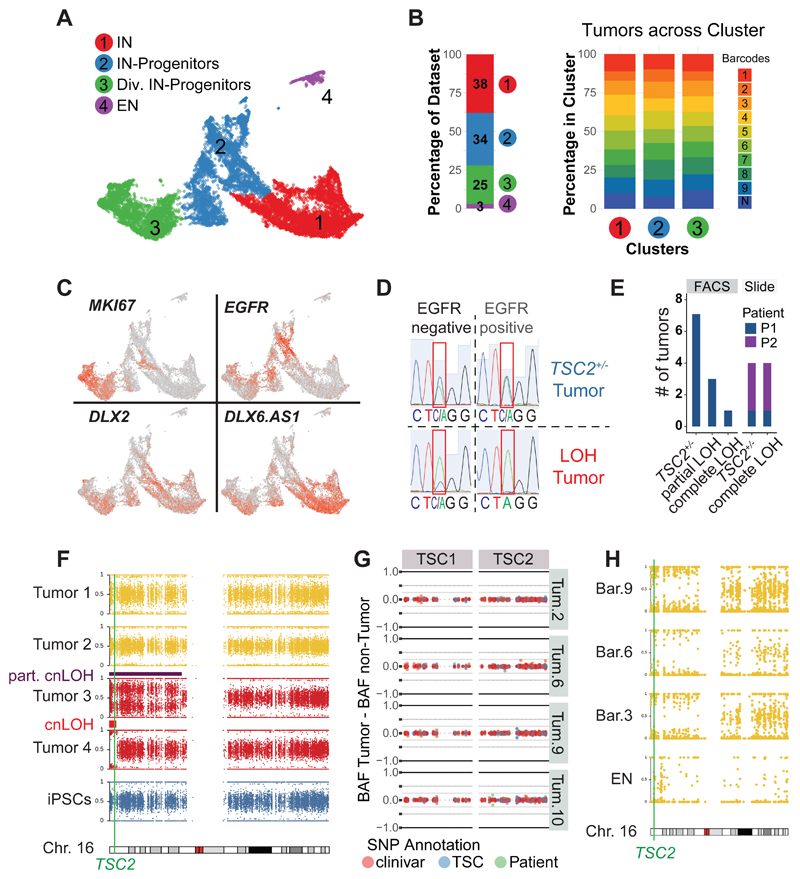
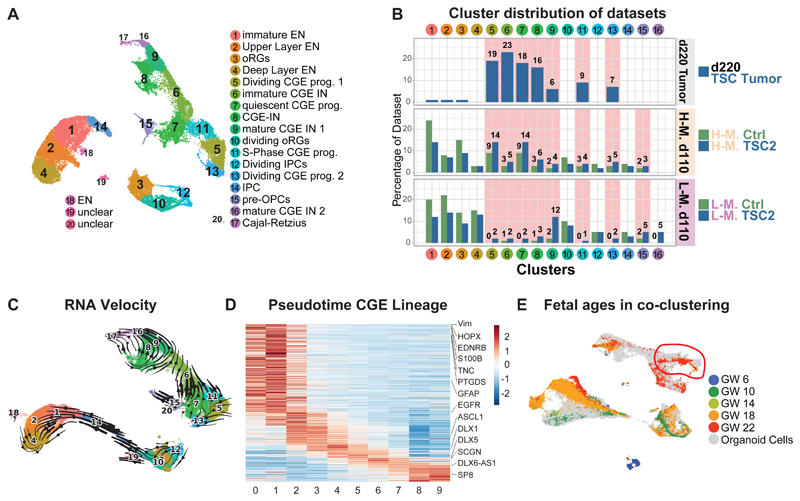
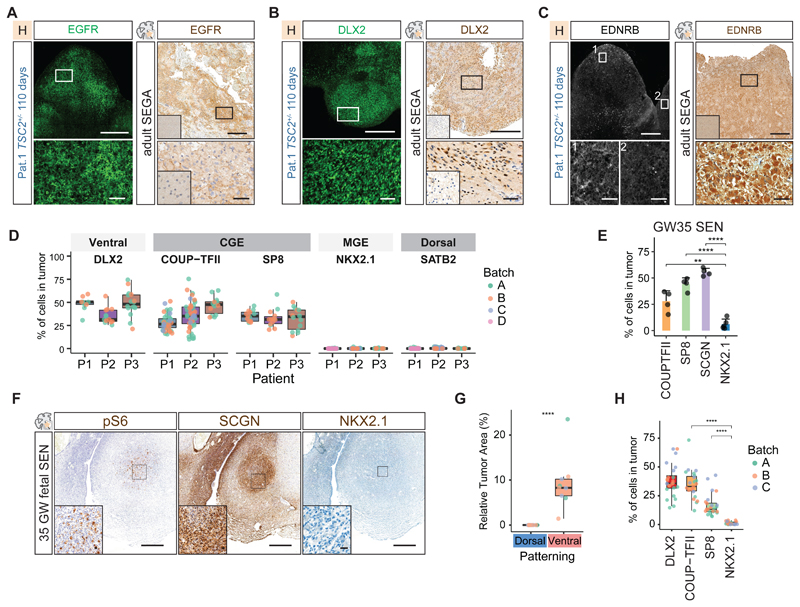
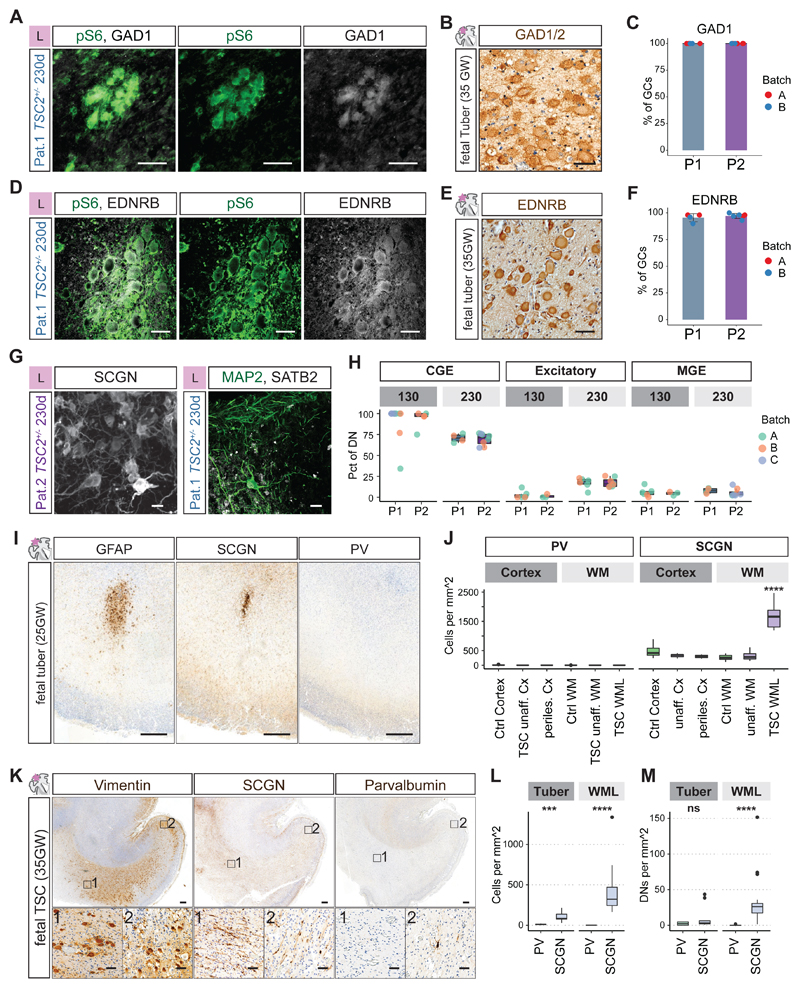
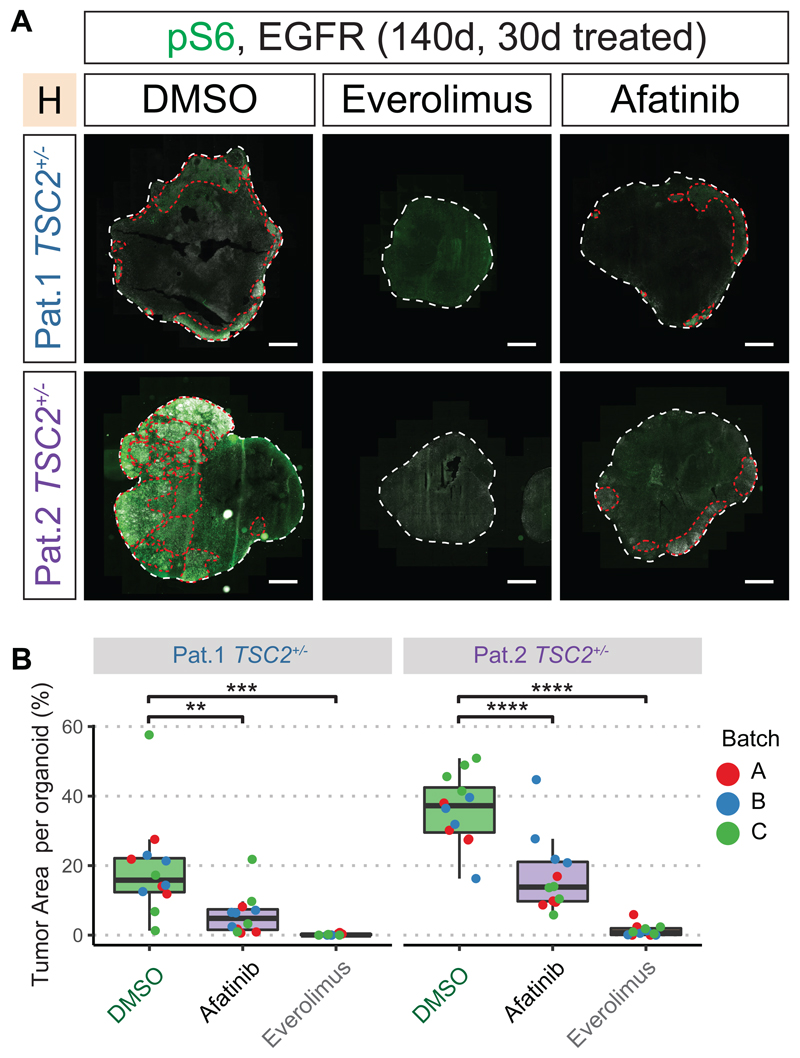
Evolutionary development of the human brain is characterized by the expansion of various brain regions. Here, we show that developmental processes specific to humans are responsible for malformations of cortical development (MCDs), which result in developmental delay and epilepsy in children. We generated a human cerebral organoid model for tuberous sclerosis complex (TSC) and identified a specific neural stem cell type, caudal late interneuron progenitor (CLIP) cells. In TSC, CLIP cells over-proliferate, generating excessive interneurons, brain tumors, and cortical malformations. Epidermal growth factor receptor inhibition reduces tumor burden, identifying potential treatment options for TSC and related disorders. The identification of CLIP cells reveals the extended interneuron generation in the human brain as a vulnerability for disease. In addition, this work demonstrates that analyzing MCDs can reveal fundamental insights into human-specific aspects of brain development.


Conflict of interest statement

Competing interests: J.A.K. is on the supervisory and scientific advisory board of a:head bio AG (https://aheadbio.com) and is an inventor on several patents relating to cerebral organoids.

Figures

Fig 1
Fig 1. TSC2+/--derived organoids recapitulate histopathology of TSC
A Ctrl and TSC2+/- cell lines derived from two patients (see Materials and Methods for details). B High- and Low-nutrient organoid protocols used to model distinct TSC phenotypes. C H&E staining of 35GW fetal brain depicts histopathology of a fetal SEN. D pS6 and Ki67 staining on 110- and 105-day-old TSC2+/--derived organoids in high-nutrient medium identifies SEN-like structures. Lower panel shows higher magnification of inset. E Map2 staining on 130-day-old organoids in L-medium shows dysmorphic neurons (top), with comparable morphology to those in a resected tuber of a 2-year-old patient (bottom). Nuclear counterstain with DAPI or hematoxylin. F pS6 and GFAP identifies GCs in 230-day-old organoids comparable to GCs in patient tubers. Giant cells in organoids express Vimentin, as shown in patients. GCs can be distinguished from tumors by their lower expression of Ki67. Nuclear counterstain with DAPI or hematoxylin. G Tumors identified as pS6- and Ki67-positive areas are found in TSC2+/--derived organoids of all three patients. Control organoids of patient 1 and two clones of repaired patient 2 showed no tumors. Color of dots mark independent batches of experiments (See Fig. S3E for summary of replicates). H Percentage of tumor area of the total organoid area reveals similar tumor burden for organoids derived from three TSC2+/- patients. Color of dots mark independent batches of experiments (See Fig. S3F for summary of replicates). I. Area of the soma in Map2+ neurons shows that dysmorphic neurons in TSC2+/--derived organoids are roughly 4-fold larger then Map2+ neurons in control organoids (Pat.1 Ctrl vs. TSC2+/- p<0.0001; Pat.2 Ctrl1 vs. TSC2+/- and Pat.2 Ctrl2 vs. TSC2+/- both p<0.0001; test: Ordinary One-Way ANOVA; See Fig. S4D for summary of replicates). J. Cell area of pS6-positive cells shows enlarged pS6 cells in TSC2+/--derived organoids. (Pat.1 Ctrl vs.TSC2+/- p<0.0001, Pat.2 Ctrl vs. TSC2+/- p<0.0001, Pat.1 Ctrl vs. Pat.2 Ctrl p>0.9999, Pat.1 TSC2+/- vs. Pat.2 TSC2+/- p>0.9999; Kruskal-Wallis test with Dunn's multiple comparisons test; see Fig. S4E for summary of replicates) Scale bars: C and D: 500μm; E: 20μm; inset D and F: 50μm
Fig 2
Fig 2. TSC tumors consist of interneuron progenitors and acquire cnLOH during progression
A UMAP projection of cells isolated from 220-day-old TSC tumor organoids identified four main clusters: interneurons (Cl. 1), interneuron progenitors (Cl. 2), dividing interneuron progenitors (Cl. 3) and excitatory neurons (Cl. 4). B Dataset composition and contribution of different tumor regions. 97% of cells in tumors were ventral cells and all nine tumor regions of three organoids were similarly distributed across ventral clusters (Cl. 1, 2 and 3). C Expression of genes specific for dividing cells (MKI67) and interneurons (DLX2 and DLX6.AS1) in 220-day-old TSC tumors. EGFR was specifically expressed in TSC tumor progenitors. D Genotyping example of FACS sorted tumor (EGFR+) and non-tumor (EGFR-) population, showing a heterozygous tumor and a LOH (loss-of-heterozygosity) tumor that lost the WT-allele (C) within the tumor. E Genotyping of tumors of patient 1 in FACS sorted samples showing 7 out of 11 TSC tumors were heterozygous, three showed a partial LOH, and one tumor showed a full LOH. Genotyping tumors from stained slides confirmed the presence of heterozygous and LOH tumors (patient 1: one TSC2+/- tumor, one LOH tumor; patient 2: three TSC2+/- tumors, three LOH tumors) F B-Allele frequency (BAF) of chromosome 16 for four tumors of Pat. 1 TSC2+/--derived organoids. While tumor 1 and 2 remain heterozygous, a shift in BAF is seen in tumors 3 and 4 compared to iPSCs. See Fig. S6L for BAF and LRR. Note that tumor 2 showed a partial cnLOH of a large section, while tumor 4 had a small complete cnLOH at the beginning of chromosome 16. Both cnLOH regions included the TSC2 gene. G Targeted amplification of TSC1 and TSC2 in four tumors and matched non-tumor samples of patient 1. Detected SNPs are colored as annotation of clinivar database (red), LOVD TSC database (blue) or disease-causing SNP of patient 1 (green). The difference between BAF of the tumor and matched non-tumor sample is shown. No disease-causing SNPs increased in the tumor samples could be detected. Note that in tumor 10 there was a small shift of the patient SNP, confirmed as partial cnLOH (Fig. S6I). H SNP mapping of scRNA seq data shown in panel A. Cells from tumors with sufficient reads (barcodes 3, 6 and 9) and excitatory neurons were aggregated per group and allelic frequencies were determined. All tumors showed cnLOH, while excitatory neurons (cluster 4, Fig 2A) remained heterozygous.
Fig 3
Fig 3. Late CGE progenitors give rise to TSC phenotypes
A UMAP projection of 220-day-old TSC tumor organoids with 110-day-old Ctrl and TSC2+/--derived organoids in H- and L-medium. All cell types of the dorsal lineage were present, with radial glia (RG, Cl. 3 and 10), intermediate progenitors (IPCs, Cl. 12 and 14) and excitatory neurons (EN, Cl. 1, 2, 4, 18). Separate a lineage of CGE-derived cells was identified with quiescent CGE progenitors (Cl. 7), dividing CGE progenitor cells (Cl. 5, 11, 13) and CGE interneurons (IN, Cl. 6, 8, 9, 16, 17). Pre-OPC-like cells (Cl. 15) cluster close to quiescent CGE progenitors. B Contribution of different datasets to clusters shown in panel A. 220-day-old TSC tumors only contributed to CGE progenitors and their progeny (Clusters 5, 6, 7, 8, 9, 11 and 13). These clusters were also increased in 110-day-old TSC2+/--derived organoids. H-medium enriched for progenitors. L-medium organoids had more mature CGE-INs (Cl. 9, and 16). C RNA velocity projected in 2D. The cluster annotation corresponds to Fig. 3A. From the increased CGE progenitor population two trajectories emerge: a small trajectory towards pre-OPC cells (Cl. 15), and a larger trajectory towards interneurons (Cl. 6 and 9). D Expression of genes along pseudotime in CGE lineage. Genes enriched along pseudotime were calculated and cells were binned into 10 groups (x axis, see Fig. S9B). All genes with enriched expression along the trajectory were ordered using a sliding average. Genes enriched in progenitors: top left. Genes in mature interneurons: bottom right. Selected genes were highlighted. E UMAP of integration of organoid and fetal cells color coded for gestational ages shows GW22 cells co-clustered with quiescent CGE progenitor cluster (right top).
Fig 4
Fig 4. CGE progenitors initiate TSC tumors
A Immunostaining for EGFR identified tumors in 110-day-old TSC2+/--derived organoids grown in H-medium. EGFR expression was present in adult SEGAs. Inset in primary tissue staining shows healthy control cortex negative for EGFR (See Fig. S12C for co-staining with COUP-TFII in organoids). B DLX2 was expressed in tumors in 110-day-old TSC2+/--derived organoids and resected SEGA tissue. Inset in primary tissue staining shows healthy control cortex negative for DLX2 (Fig. S13, See Fig. S13 for EGFR and SP8 in organoid and patient tumors). C EDNRB was expressed in tumors in 110-day-old TSC2+/--derived organoids. Zoom-in 1 and 2; tumor regions expressing EDNRB and negative region. See Fig. S16A for co-staining with PROX1 and pS6 in two patients. EDNRB expression was found in adult SEGAs. Inset in primary tissue staining shows healthy control cortex negative for EDNRB. D Quantification of ventral (DLX2), CGE (COUP-TFII and SP8), MGE (NKX2.1) and dorsal markers (SATB2) in tumors of three patients. Tumors of at least two independent batches were quantified shown by different colors. Ventral and CGE markers are found in all tumors, MGE and dorsal markers are not found (See Fig. S14B for statistical comparison). E Quantification of CGE markers COUP-TFII, SCGN, SP8 and MGE marker NKX2.1 in 35GW fetal SENs (mean and standard deviation, see Fig. S14D for statistical comparison). F Immunostaining on fetal SENs. Fetal tumors characteristically expressed Vimentin (Fig. S14C) and pS6 in enlarged cells. Tumor were enriched in SCGN expressing CGE interneurons. Only few MGE cells were found. G Dorsal and ventral patterning of tumors of patient 1. In 120-day-old TSC2+/--derived organoids tumors only appear in ventral patterned organoids containing interneuron progenitors (Student's t-test, see Fig. S15B. for overview of samples). H Tumors in ventral patterned organoids expressed the ventral marker DLX2 and the CGE markers COUP-TFII and SP8, while NKX2.1 is almost absent (Ordinary one-way ANOVA with Tukey HSD, see Fig. S15H for statistical comparison). Scale bars: overview images A, B, C: 500μm; Zoom-in A, B, C: 50μm; overview F: 500μm; Inset F: 20μm
Fig 5
Fig 5. CLIP cells initiate cortical tuber pathogenesis
A and B GCs in organoids (A) and fetal tubers (B) expressed the interneuron lineage marker GAD1. C Quantification of co-expression of GAD1 and pS6 in giant cells in organoids (P1: N = 2, n = 6, mean = 100%; P2: N = 2, n = 8, mean = 100%) D and E EDNRB was expressed in GCs in organoids and in fetal tubers. F Quantification of co-expression of EDNRB and pS6 in GCs in organoids (P1: N = 2, n = 4, mean = 95.5%; P2: N = 2, n = 6, mean = 97.2%). G Dysmorphic neurons at 230 days expressed the CGE-marker SCGN. Individual dysmorphic neurons expressed the excitatory marker SATB2 (See Fig. S20C-G for stainings at different timepoints). H Quantification of expression of CGE (SCGN, COUP-TFII), excitatory (SATB2) and MGE markers (PV) in dysmorphic neurons (DNs) at early and late stages in organoids of two patients. CGE DNs were enriched at 130 days and decreased over time. Excitatory DNs increased over time. See Fig. S20I and J for statistical analysis. I GFAP identified early dysplastic regions at 25GW located in the white matter below the cortex. There was a focal enrichment of SCGN expressing CGE interneurons, while PV expressing MGE interneurons were rare (See. Fig. S21A and B). J Quantification of MGE marker PV and CGE marker SCGN in ~25GW fetal brain. Unaffected cortical areas, unaffected white matter, as well as white matter lesions (WML) and adjacent cortex (perilesional cortex) quantified for density of cells expressing PV or SCGN (Fig. S21A and B). WMLs were significantly enriched in CGE interneurons compared to all other regions (One-way ANOVA, see Fig. S21C and D for statistical analysis). K At 35GW Vimentin staining identified streams of cells in WMLs and affected cortex. SCGN expressing cells were abundant in the WMLs, and cortex, while PV expressing cells were mainly found in cortical regions. L and M Quantification of MGE marker PV and CGE marker SCGN in 35GW TSC case. Density of all cells is shown in L, with increase of SCGN cells in tuber and WML areas. In M the density of DNs expressing PV and SCGN in tuber and WML areas is shown. SCGN DNs were significantly enriched in WMLs, while tubers contained similar density of PV and SCGN cells (all neurons: Tuber p = 0.0002, WML p = <0.0001; DNs: Tuber p = 0.248, WML p = <0.0001; pairwise Wilcoxon-test, see Fig. S21E for overview of samples). (Scale bars: A, B, D, E, inset K: 50μm; G: 20μm; overview I and K: 500μm)
Fig 6
Fig 6. EGFR-inhibition reduces tumor burden
A 30 days of treatment started at 110 days after EB formation (see Fig. S23A). Immunostaining for pS6 and EGFR identified tumors (red lines) in the control group (DMSO) in both patients. Tumors were reduced by Afatinib and Everolimus treatment. B Quantification of tumor area per organoid. All sections of each organoid stained on one slide were used for quantification. Tumors were identified as regions of overlapping pS6 and EGFR staining. While tumors were detected in DMSO-control for both patients, Afatinib or Everolimus treatment both reduce tumor burden. (two-way ANOVA for treatment condition controlling for batches, Tukey's multiple comparisons test, see Fig. S23B) (Scale bars: A.: 1mm)

Comment in

References

    1. Kuzniecky RI. MRI in cerebral developmental malformations and epilepsy. Magnetic Resonance Imaging. 1995;13:1137–1145. - PubMed
    1. Thiele EA. Managing and understanding epilepsy in tuberous sclerosis complex. Epilepsia. 2010;51(Suppl 1):90–91. - PubMed
    1. Ruppe V, et al. Developmental brain abnormalities in tuberous sclerosis complex: a comparative tissue analysis of cortical tubers and perituberal cortex. Epilepsia. 2014;55:539–550. - PubMed
    1. Gelot AB, Represa A. Progression of Fetal Brain Lesions in Tuberous Sclerosis Complex. Front Neurosci. 2020;14:899. - PMC - PubMed
    1. Henske EP, Jozwiak S, Kingswood JC, Sampson JR, Thiele EA. Tuberous sclerosis complex. Nat Rev Dis Primers. 2016;2:16035. - PubMed

Publication types

MeSH terms