

Expectile Neural Networks for Genetic Data Analysis of Complex Diseases
- PMID: 35085091
- PMCID: PMC10201460
- DOI: 10.1109/TCBB.2022.3146795
Expectile Neural Networks for Genetic Data Analysis of Complex Diseases
Abstract
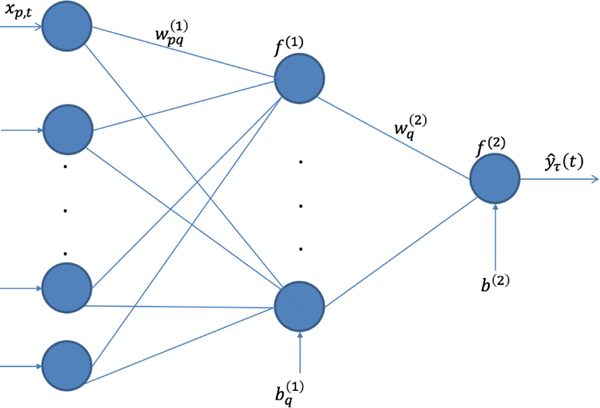
The genetic etiologies of common diseases are highly complex and heterogeneous. Classic methods, such as linear regression, have successfully identified numerous variants associated with complex diseases. Nonetheless, for most diseases, the identified variants only account for a small proportion of heritability. Challenges remain to discover additional variants contributing to complex diseases. Expectile regression is a generalization of linear regression and provides complete information on the conditional distribution of a phenotype of interest. While expectile regression has many nice properties, it has rarely been used in genetic research. In this paper, we develop an expectile neural network (ENN) method for genetic data analyses of complex diseases. Similar to expectile regression, ENN provides a comprehensive view of relationships between genetic variants and disease phenotypes, which can be used to discover variants predisposing to sub-populations. We further integrate the idea of neural networks into ENN, making it capable of capturing non-linear and non-additive genetic effects (e.g., gene-gene interactions). Through simulations, we showed that the proposed method outperformed an existing expectile regression when there exist complex genotype-phenotype relationships. We also applied the proposed method to the data from the Study of Addiction: Genetics and Environment (SAGE), investigating the relationships of candidate genes with smoking quantity.
Figures


References
-
- Koenker R,& Bassett G. (1978). Regression Quantiles. Econometrica, 46(1). 10.2307/1913643. - DOI
-
- Newey WK, & Powell JL (1987). Asymmetric Least Squares Estimation and Testing. Econometrica, 55(4). 10.2307/1911031. - DOI
-
- Buchinsky M. (1995). Quantile regression, Box-Cox transformation model, and the U.S. wage structure, 1963–1987. Journal of Econometrics, 65(1). 10.1016/0304-4076(94)01599-U. - DOI
