. 2022 Mar 15;132(6):e155851.
doi: 10.1172/JCI155851.

High-dose rifampin improves bactericidal activity without increased intracerebral inflammation in animal models of tuberculous meningitis

Affiliations

High-dose rifampin improves bactericidal activity without increased intracerebral inflammation in animal models of tuberculous meningitis

Camilo A Ruiz-Bedoya et al. J Clin Invest. .

Abstract

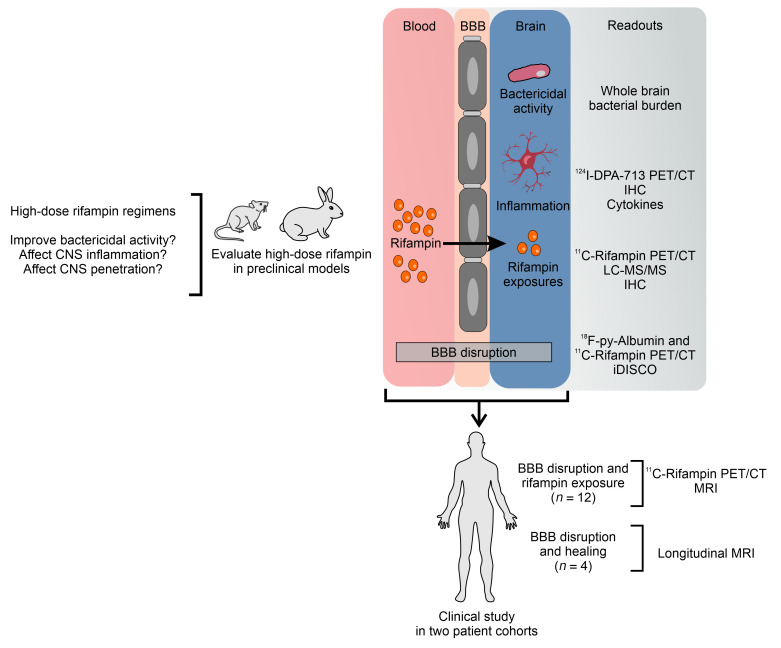
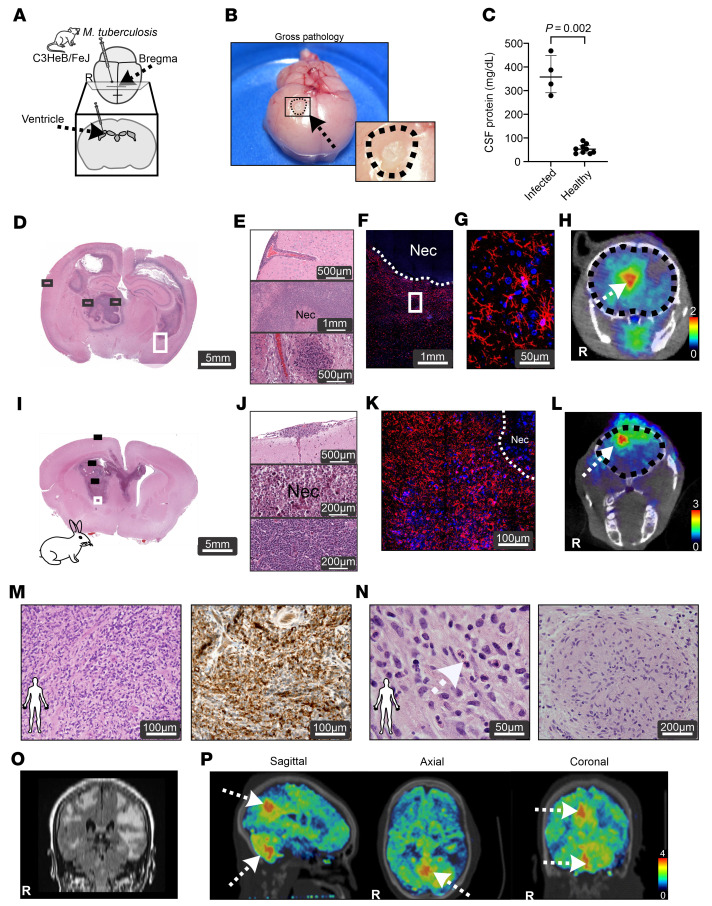
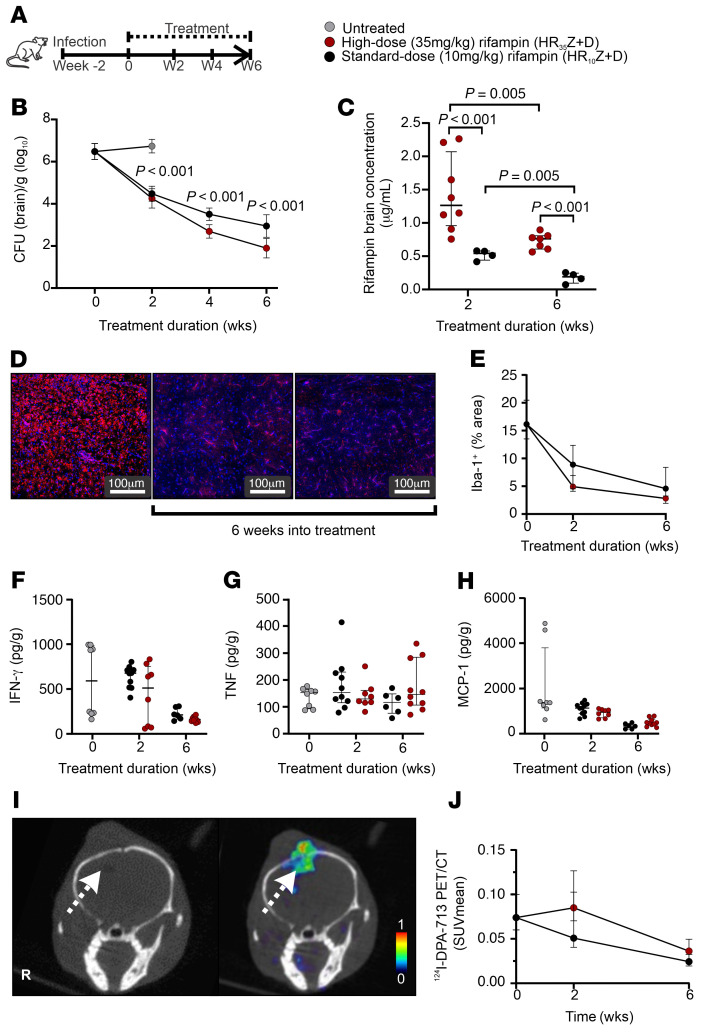
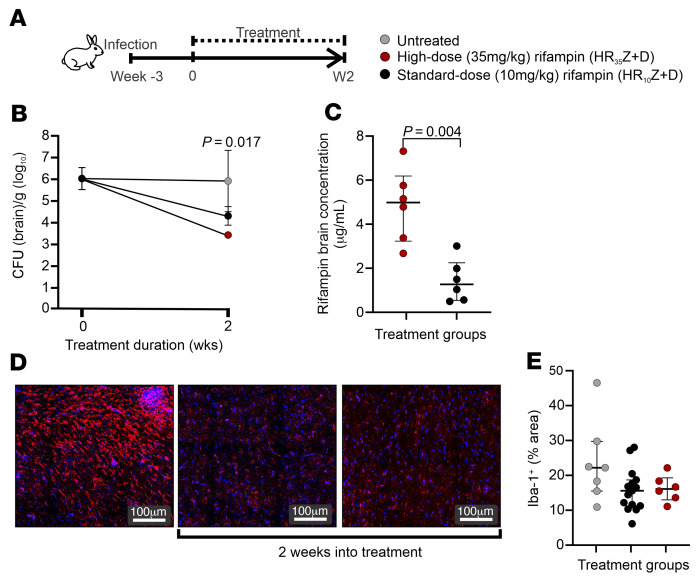
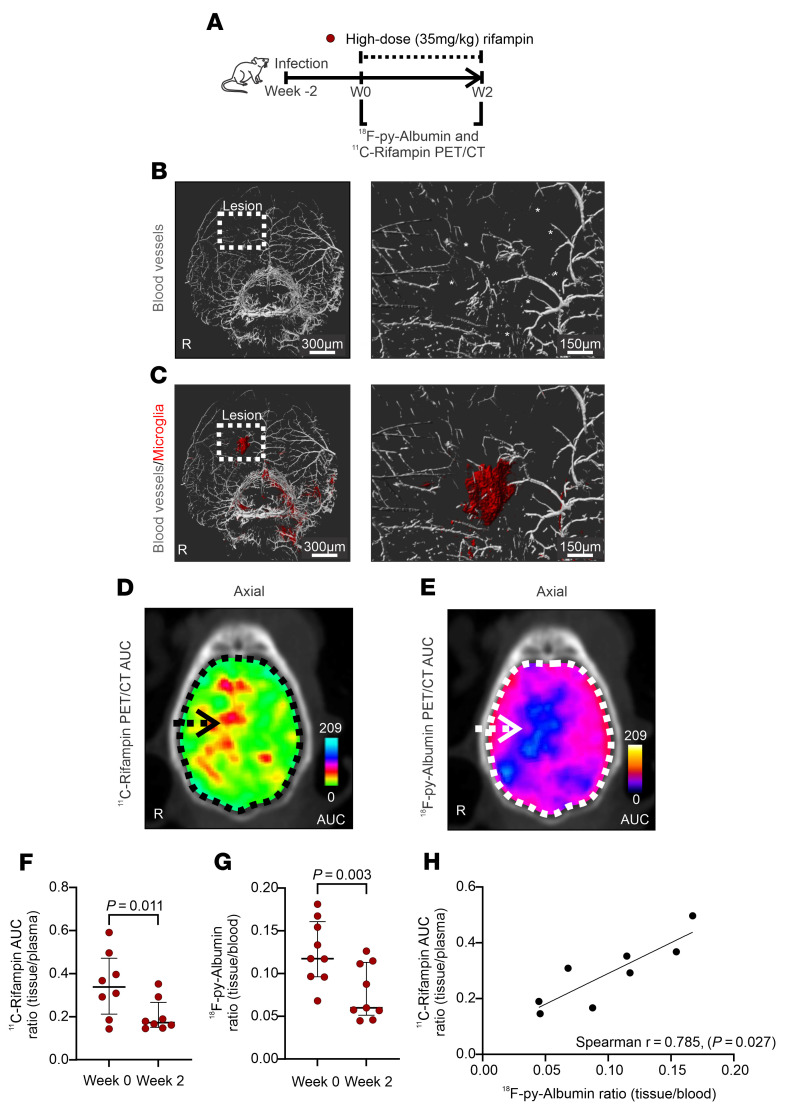
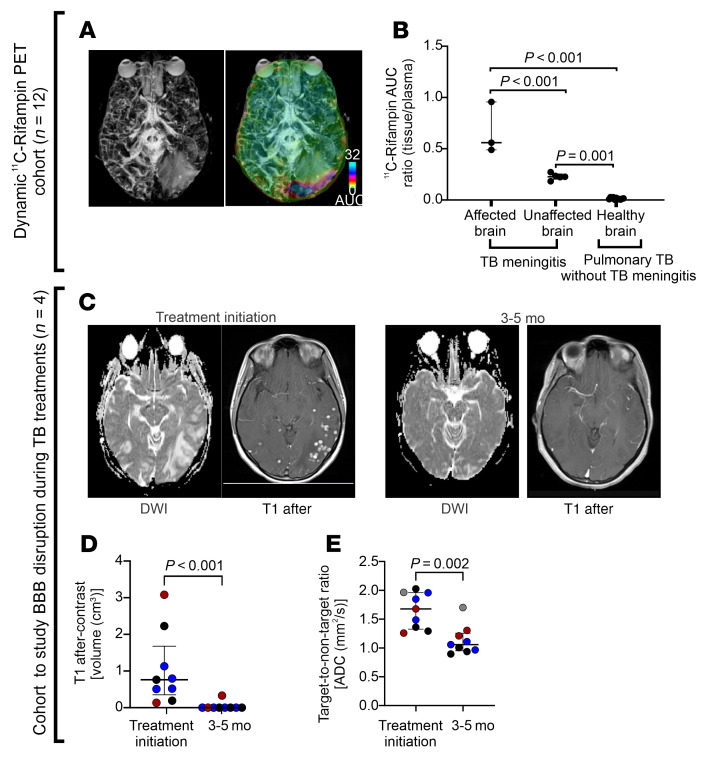
Tuberculous meningitis (TB meningitis) is the most severe form of tuberculosis (TB), requiring 12 months of multidrug treatment for cure, and is associated with high morbidity and mortality. High-dose rifampin (35 mg/kg/d) is safe and improves the bactericidal activity of the standard-dose (10 mg/kg/d) rifampin-containing TB regimen in pulmonary TB. However, there are conflicting clinical data regarding its benefit for TB meningitis, where outcomes may also be associated with intracerebral inflammation. We conducted cross-species studies in mice and rabbits, demonstrating that an intensified high-dose rifampin-containing regimen has significantly improved bactericidal activity for TB meningitis over the first-line, standard-dose rifampin regimen, without an increase in intracerebral inflammation. Positron emission tomography in live animals demonstrated spatially compartmentalized, lesion-specific pathology, with postmortem analyses showing discordant brain tissue and cerebrospinal fluid rifampin levels and inflammatory markers. Longitudinal multimodal imaging in the same cohort of animals during TB treatment as well as imaging studies in two cohorts of TB patients demonstrated that spatiotemporal changes in localized blood-brain barrier disruption in TB meningitis are an important driver of rifampin brain exposure. These data provide unique insights into the mechanisms underlying high-dose rifampin in TB meningitis with important implications for developing new antibiotic treatments for infections.

Keywords: Infectious disease; Microbiology; Neuroimaging; Neurological disorders; Pharmacology.


Figures

Figure 1
Figure 1. Study design.
Cross-species studies were performed in mice, rabbits, and humans to address key questions regarding the use of high-dose rifampin for TB meningitis. Longitudinal, multimodal imaging studies in live animals, supported by postmortem assays, were designed to evaluate the bactericidal activity of high- versus standard-dose rifampin regimens as well as lesion-specific, intracerebral inflammation. Studies to assess intracerebral, lesion-specific rifampin exposures and expression of efflux pumps (e.g., MDR-1) were performed with the goal of identifying pathways that could be modulated to optimize rifampin delivery to the CNS. We also studied the effect of dexamethasone on rifampin levels, intracerebral inflammation, and the efficacy of rifampin-containing regimens. Multimodal imaging in the same cohort of animals was utilized to explore the mechanisms underlying the spatiotemporal changes in lesion-specific, rifampin brain exposures, and localized blood-brain barrier disruptions (18F-py-albumin PET/CT). Postmortem analyses to assess vessel pathology at high resolution were also performed (clarified whole mouse brains — iDISCO protocol). Finally, longitudinal imaging studies in 2 cohorts of patients were analyzed to understand the spatiotemporal changes in rifampin exposures and localized blood-brain barrier disruptions during TB treatment and correlated with the findings from the animal studies. LC–MS/MS, liquid chromatography and tandem mass spectrometry; IHC, immunohistochemistry; BBB, blood-brain barrier.
Figure 2
Figure 2. Animal models of TB meningitis recapitulate human disease.
Mice (AH), rabbits (IL), and humans (MP). (A) Schematic of brain infection of mice with live M. tuberculosis. Two weeks after infection, brain lesions were noted on gross pathology (B) with high protein in the CSF (n = 4–9 animals/group) (C). Histopathology from the brains of infected mice (DG) and rabbits (IK) demonstrates TB lesions with inflammatory cells. Panels E and J show meningitis (upper panels), necrotizing tuberculomas (middle panels), and nonnecrotizing tuberculomas (lower panels). Immunohistochemistry demonstrates microglia (Iba-1 stain in red and DAPI nuclear stain in blue) in brains from infected mice (F and G) and rabbits (K). 18F-FDG uptake is noted in the brain lesions on PET/CT images (arrows) from infected mice (H) and rabbits (L). Areas of nonspecific PET uptake were also noted extracranially. (M and N) Histology from brain lesion biopsies from 2 patients with TB meningitis (subjects 3 and 5, Supplemental Table 1) CD68+ cells (right, panel [M]) and multinucleated giant cells (left panel [N], white arrow). (O) MRI from a 67-year-old female with TB meningitis (subject 3, Supplemental Table 1) demonstrating focal FLAIR hyperintensities and 18F-FDG uptake (arrows) noted on PET/CT images (P). Coronal PET images are presented as standardized uptake values (SUV). High-power views (D, E, I, J, M, and N) are shown in Supplemental Figures 1 and 3, respectively. Data are represented as median ± IQR. Statistical comparisons were performed using a 2-tailed Mann-Whitney-Wilcoxon test (B). R, right; Nec, necrotizing.
Figure 3
Figure 3. Treatment with a high-dose rifampin-containing regimen in mice.
(A) Experimental schematic for multidrug treatment in mice with experimentally induced TB meningitis. Week –2 represents 2 weeks prior to initiation of TB treatments. (B) Bacterial burden (CFU per gram of brain tissue [log10]) (n = 9–16 animals/group per time point). (C) Rifampin brain concentration (μg/mL) (n = 4–8 animals/group). (D) Representative images from untreated (left panel) animals or animals treated with 6 weeks of high-dose (middle panel) or standard-dose (right panel) rifampin-containing regimen demonstrating microglia (Iba-1 stain in red and DAPI nuclear stain in blue) density in brain tissues. (E) Quantification of Iba-1 signal (n = 3 animals/group per time point). (FH) Brain tissue levels of IFN-γ (F), TNF (G), and MCP-1 (H) (n = 3–6 animals/group per time point, with 2 technical replicates per animal). (I) 124I -DPA-713 PET/CT images from a representative mouse demonstrating a hypodense lesion (left, white arrow) on CT corresponding to 124I-DPA-713 PET activity (right, white arrow) at the site of a TB lesion. (J) Serial 124I-DPA-713 PET imaging presented as SUVmean (n = 5–19 animals/group per time point). Data are represented as median ± IQR range except bacterial burden (CFU), which is presented as mean ± SD. Statistical comparisons were performed using 2-way ANOVA followed by Bonferroni’s multiple-comparison test (B and C).
Figure 4
Figure 4. Treatment with a high-dose rifampin-containing regimen in rabbits.
(A) Experimental schematic for multidrug treatment in New Zealand white rabbits with experimentally induced TB meningitis. Week –3 represents 3 weeks prior to initiation of TB treatments. (B) Bacterial burden (CFU per gram of brain tissue [log10]) (n = 3–4 animals/group per time point). (C) Rifampin brain concentration (μg/mL) (n = 3–4 animals/group with 1–2 samples/animal). (D) Representative images from untreated (left panel) rabbits or rabbits treated with 2 weeks of high-dose (middle panel) or standard-dose (right panel) rifampin-containing regimen demonstrating microglia (Iba-1 stain in red and DAPI nuclear stain in blue) density in brain tissues. (E) Quantification of Iba-1 signal (n = 1 animal/group). Data are represented as median ± IQR except for bacterial burden (CFU), which is presented as mean ± SD. Statistical comparisons were performed using 2-way ANOVA followed by Bonferroni’s multiple-comparison test (B) and 2-tailed Mann-Whitney-Wilcoxon test (C).
Figure 5
Figure 5. Spatiotemporal changes in rifampin brain exposures and vascular pathology in mice.
(A) Experimental schematic. Whole brain immunostaining (iDISCO) was performed to visualize arteries (B, α-SMA stain in white) and microglia (C, Iba-1 in red) in infected mice. Truncated arteries are marked with asterisks. (D) 11C-Rifampin PET AUC shown as a heatmap overlaid on the axial CT section. (E) Corresponding 18F-py-Albumin PET AUC heatmap. Arrows point to the lesion, while the dotted line outlines the brain parenchyma. (F) 11C-Rifampin brain/plasma AUC ratios (n = 4 animals per time point). (G) 18F-py-Albumin brain/plasma ratio (n = 9 animals per time point). (H) Correlation between the lesion-specific 18F-py-Albumin PET uptake and 11C-rifampin exposures. Data are represented as median ± IQR. Statistical comparisons were performed using 2-tailed Mann-Whitney-Wilcoxon test (F and G) and Spearman’s rank correlation (H).
Figure 6
Figure 6. Imaging studies in patients with TB meningitis.
(A and B) 11C-Rifampin PET/CT to study rifampin exposures. (A) MRI T2 FLAIR maximum intensity projection (MIP) (right) with the corresponding 11C-rifampin PET AUC overlaid as a heatmap (left). (B) 11C-Rifampin brain/plasma AUC ratios in brain regions with and without vasogenic edema in a patient with TB meningitis (n = 1 patient with 7 VOI) and in brains of patients with pulmonary TB, but without meningitis (n = 11 patients, 1 VOI per patient). (CE) Another cohort of patients with TB meningitis who underwent serial MRI during TB treatment was used to assess the blood-brain barrier disruption (n = 4 patients). (C) Representative MRI axial sections with DWI and T1 after contrast at treatment initiation (left) and after 3 months of treatment (subject 1, Supplemental Table 1). (D) Changes in brain T1 after contrast volume (cm3) during TB treatment (n = 3; no contrast was administered for subject 4 with chronic renal disease). (E) Changes in brain diffusion (ADC [mm2/s]) for all 4 patients. All patients received 2 months of initiation treatment with HRZ with or without fluoroquinolones, followed by continuation phase with at least 12 months of HR treatment. Panel C and the corresponding T2 FLAIR are shown in Supplemental Figure 18A. Data are represented as median ± IQR. Statistical comparisons were performed using 2-way ANOVA followed by Bonferroni’s multiple-comparison test (B) and 2-tailed Mann-Whitney-Wilcoxon test (D and E). TB drug treatments are abbreviated. BBB, blood-brain barrier; T1 post, T1 after contrast image.

Similar articles

Cited by

References

    1. Wilkinson RJ, et al. Tuberculous meningitis. Nat Rev Neurol. 2017;13(10):581–598. doi: 10.1038/nrneurol.2017.120. - DOI - PubMed
    1. Jain SK, et al. Tuberculous meningitis: a roadmap for advancing basic and translational research. Nat Immunol. 2018;19(6):521–525. doi: 10.1038/s41590-018-0119-x. - DOI - PMC - PubMed
    1. Chiang SS, et al. Treatment outcomes of childhood tuberculous meningitis: a systematic review and meta-analysis. Lancet Infect Dis. 2014;14(10):947–957. doi: 10.1016/S1473-3099(14)70852-7. - DOI - PubMed
    1. Diacon AH, et al. Early bactericidal activity of high-dose rifampin in patients with pulmonary tuberculosis evidenced by positive sputum smears. Antimicrob Agents Chemother. 2007;51(8):2994–2996. doi: 10.1128/AAC.01474-06. - DOI - PMC - PubMed
    1. Chigutsa E, et al. Impact of nonlinear interactions of pharmacokinetics and MICs on sputum bacillary kill rates as a marker of sterilizing effect in tuberculosis. Antimicrob Agents Chemother. 2015;59(1):38–45. doi: 10.1128/AAC.03931-14. - DOI - PMC - PubMed

Publication types