

The relationship between lipoprotein A and other lipids with prostate cancer risk: A multivariable Mendelian randomisation study
- PMID: 35085228
- PMCID: PMC8794090
- DOI: 10.1371/journal.pmed.1003859
The relationship between lipoprotein A and other lipids with prostate cancer risk: A multivariable Mendelian randomisation study
Abstract
Background: Numerous epidemiological studies have investigated the role of blood lipids in prostate cancer (PCa) risk, though findings remain inconclusive to date. The ongoing research has mainly involved observational studies, which are often prone to confounding. This study aimed to identify the relationship between genetically predicted blood lipid concentrations and PCa.
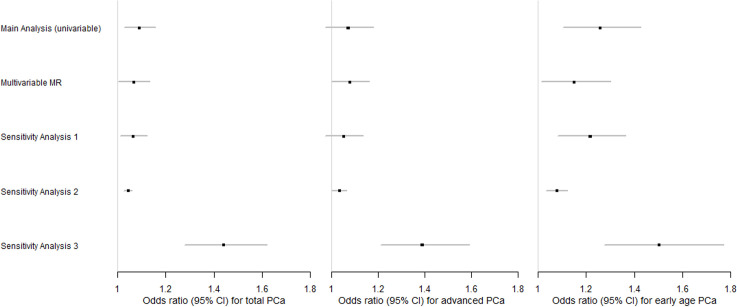
Methods and findings: Data for low-density lipoprotein (LDL) cholesterol, high-density lipoprotein (HDL) cholesterol, triglycerides (TG), apolipoprotein A (apoA) and B (apoB), lipoprotein A (Lp(a)), and PCa were acquired from genome-wide association studies in UK Biobank and the PRACTICAL consortium, respectively. We used a two-sample summary-level Mendelian randomisation (MR) approach with both univariable and multivariable (MVMR) models and utilised a variety of robust methods and sensitivity analyses to assess the possibility of MR assumptions violation. No association was observed between genetically predicted concentrations of HDL, TG, apoA and apoB, and PCa risk. Genetically predicted LDL concentration was positively associated with total PCa in the univariable analysis, but adjustment for HDL, TG, and Lp(a) led to a null association. Genetically predicted concentration of Lp(a) was associated with higher total PCa risk in the univariable (ORweighted median per standard deviation (SD) = 1.091; 95% CI 1.028 to 1.157; P = 0.004) and MVMR analyses after adjustment for the other lipid traits (ORIVW per SD = 1.068; 95% CI 1.005 to 1.134; P = 0.034). Genetically predicted Lp(a) was also associated with advanced (MVMR ORIVW per SD = 1.078; 95% CI 0.999 to 1.163; P = 0.055) and early age onset PCa (MVMR ORIVW per SD = 1.150; 95% CI 1.015,1.303; P = 0.028). Although multiple estimation methods were utilised to minimise the effect of pleiotropy, the presence of any unmeasured pleiotropy cannot be excluded and may limit our findings.
Conclusions: We observed that genetically predicted Lp(a) concentrations were associated with an increased PCa risk. Future studies are required to understand the underlying biological pathways of this finding, as it may inform PCa prevention through Lp(a)-lowering strategies.
Conflict of interest statement
I have read the journal’s policy and the authors of this manuscript have the following competing interests: VZ is a paid statistical consultant on PLOS Medicine’s statistical board.
Figures
References
-
- Cancer R. Global cancer observatory [Internet]. [cited 2020 Jun 26]. Available from: https://gco.iarc.fr/
-
- Loda M, Mucci LA, Mittelstadt ML, Van Hemelrijck M, Cotter MB. Pathology and epidemiology of cancer. Pathology and Epidemiology of Cancer. 2016. p. 1–670.
-
- Perdana NR, Mochtar CA, Umbas R, Hamid ARA. The Risk Factors of Prostate Cancer and Its Prevention: A Literature Review. Acta Med Indones. 2016;48(3):228–38. - PubMed
Publication types
MeSH terms
Substances
Grants and funding
LinkOut - more resources
Full Text Sources
Other Literature Sources
Medical
Miscellaneous
