

Indoor noise level measurements and subjective comfort: Feasibility of smartphone-based participatory experiments
- PMID: 35085311
- PMCID: PMC8794191
- DOI: 10.1371/journal.pone.0262835
Indoor noise level measurements and subjective comfort: Feasibility of smartphone-based participatory experiments
Abstract
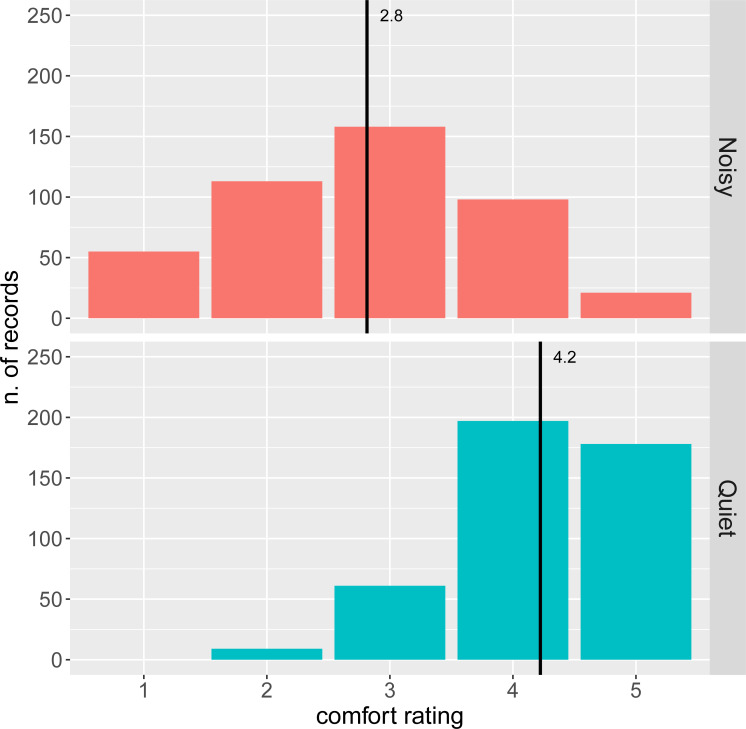
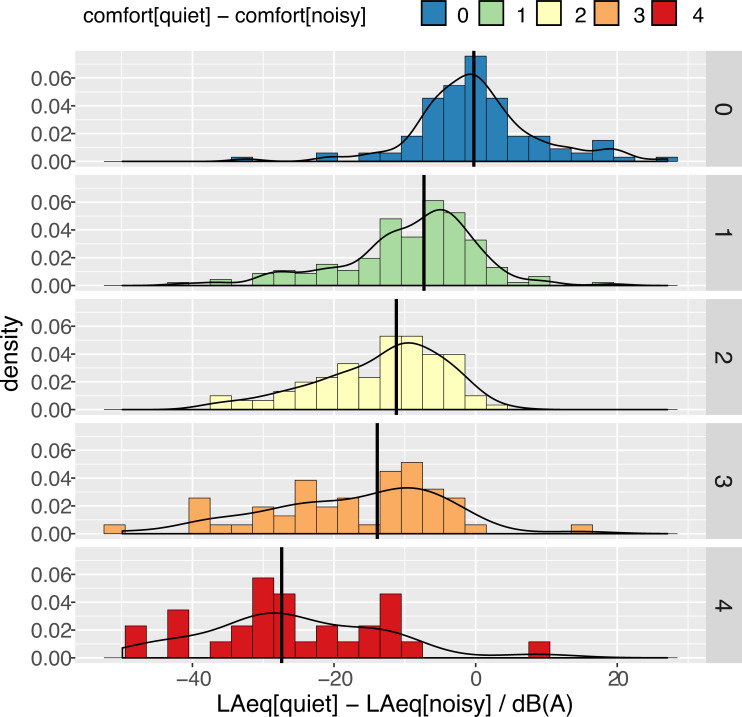
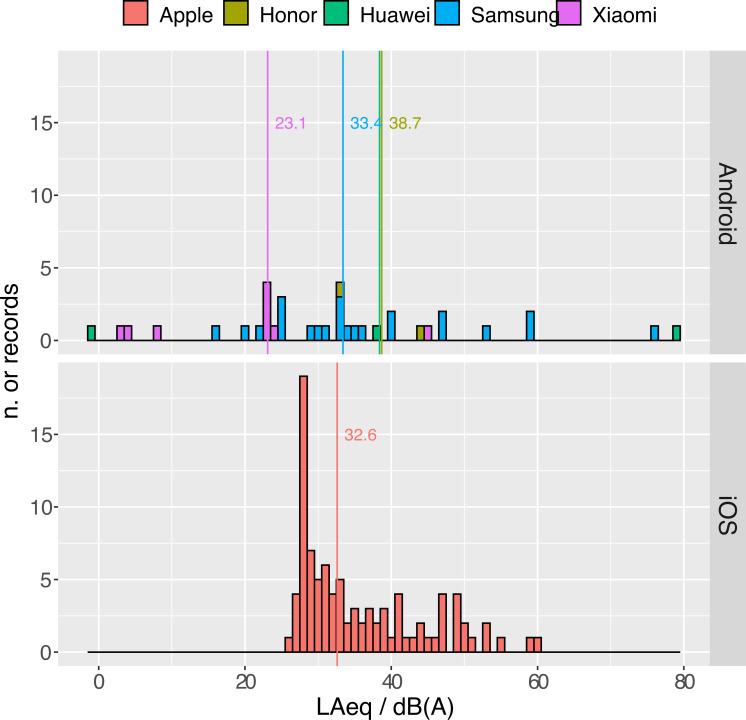
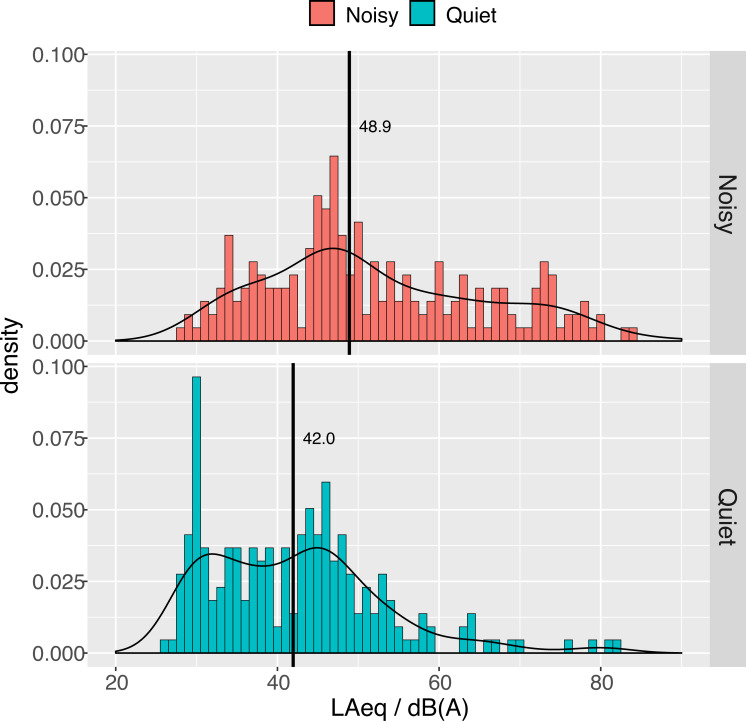
We designed and performed a participatory sensing initiative to explore the reliability and effectiveness of a distributed network of citizen-operated smartphones in evaluating the impact of environmental noise in residential areas. We asked participants to evaluate the comfort of their home environment in different situations and at different times, to select the most and least comfortable states and to measure noise levels with their smartphones. We then correlated comfort ratings with noise measurements and additional contextual information provided by participants. We discuss how to strengthen methods and procedures, particularly regarding the calibration of the devices, in order to make similar citizen-science efforts effective at monitoring environmental noise and planning long-term solutions to human well-being.
Conflict of interest statement
The authors have declared that no competing interests exist.
Figures

References
-
- Maisonneuve N, Stevens M, Niessen M, Hanappe P, Steels L. (2014) Citizen Noise Pollution Monitoring. Proceedings of the 10th International Digital Government Research Conference; 2009 (May 2014):96–103.
-
- Kanjo E. (2010) NoiseSPY: A Real-Time Mobile Phone Platform for Urban Noise Monitoring and Mapping. Mobile Networks and Applications; 15(4):562–574.
-
- Aspuru I, García I, Herranz K, Santander A. (2016) CITI-SENSE: Methods and tools for empowering citizens to observe acoustic comfort in outdoor public spaces. Noise Mapping; 3(1):37–48.
-
- Radicchi A. (2017) Beyond the Noise: Open Source Soundscapes. A mixed methodology to analyze and plan small, quiet areas on the local scale, applying the soundscape approach, the citizen science paradigm, and open source technology. The Journal of the Acoustical Society of America; 141(5):3622–3622.
MeSH terms
LinkOut - more resources
Full Text Sources
Medical
