. 2022 May;162(6):1635-1649.
doi: 10.1053/j.gastro.2022.01.022. Epub 2022 Jan 25.

Evaluating Eosinophilic Colitis as a Unique Disease Using Colonic Molecular Profiles: A Multi-Site Study

Collaborators, Affiliations

Evaluating Eosinophilic Colitis as a Unique Disease Using Colonic Molecular Profiles: A Multi-Site Study

Tetsuo Shoda et al. Gastroenterology. 2022 May.

Abstract

Background & aims: Colonic eosinophilia, an enigmatic finding often referred to as eosinophilic colitis (EoC), is a poorly understood condition. Whether EoC is a distinct disease or a colonic manifestation of eosinophilic gastrointestinal diseases (EGIDs) or inflammatory bowel disease (IBD) is undetermined.

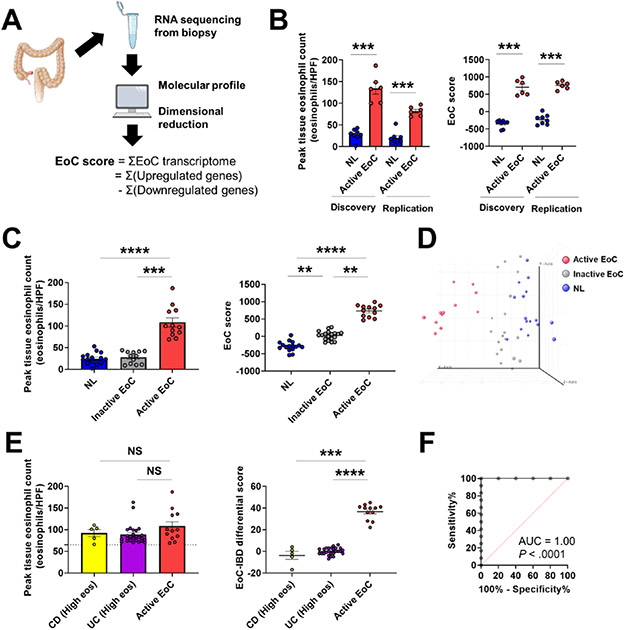
Methods: Subjects with EoC (n = 27) and controls (normal [NL, n = 20], Crohn's disease [CD, n = 14]) were enrolled across sites associated with the Consortium of Eosinophilic Gastrointestinal Disease Researchers. EoC was diagnosed as colonic eosinophilia (ascending ≥100, descending ≥85, sigmoid ≥65 eosinophils/high-power field) with related symptoms. Colon biopsies were subjected to RNA sequencing. Associations between gene expression and histologic features were analyzed with Spearman correlation; operational pathways and cellular constituents were computationally derived.

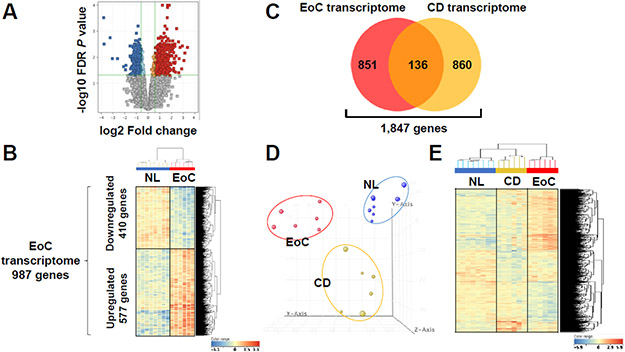
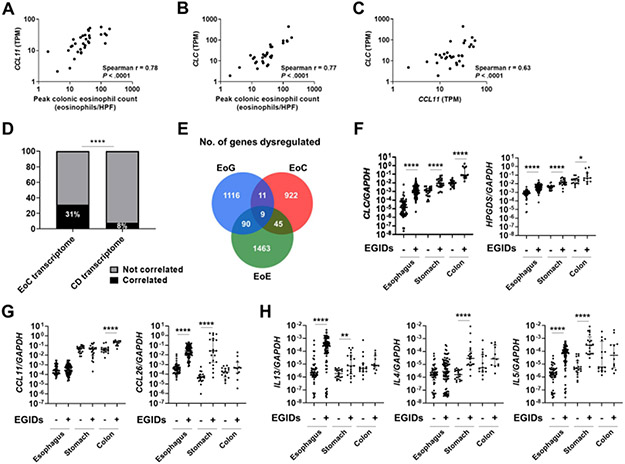
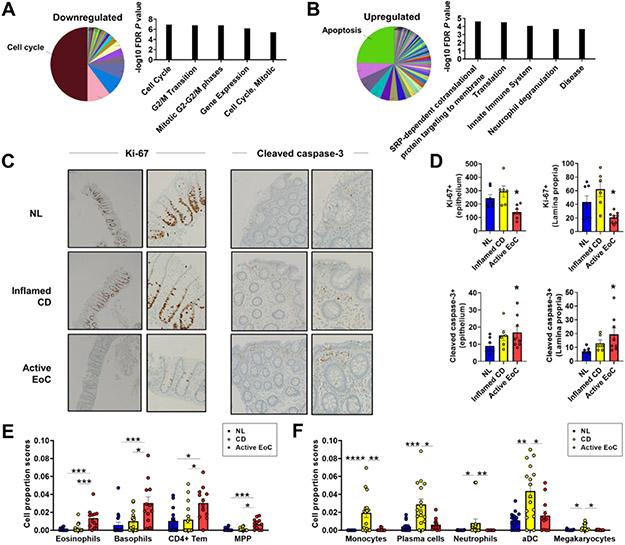
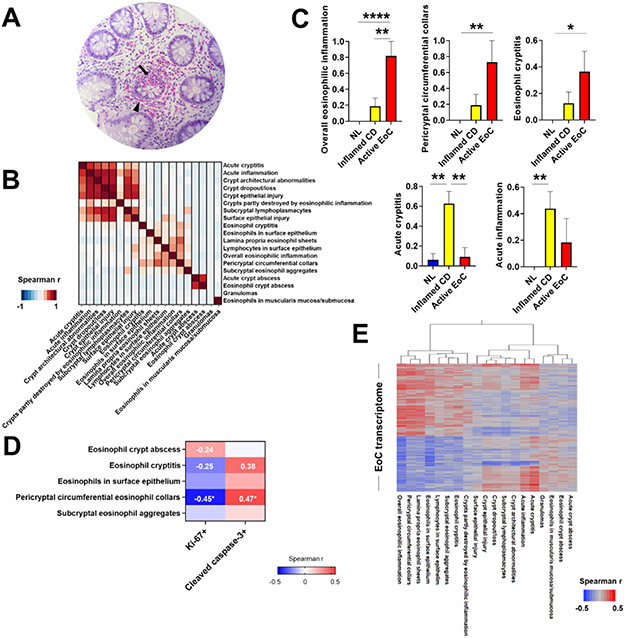
Results: We identified 987 differentially expressed genes (EoC transcriptome) between EoC and NL (>1.5-fold change, P < .05). Colonic eosinophil count correlated with 31% of EoC transcriptome, most notably with CCL11 and CLC (r = 0.78 and 0.77, P < .0001). Among EoC and other EGIDs, there was minimal transcriptomic overlap and minimal evidence of a strong allergic type 2 immune response in EoC compared with other EGIDs. Decreased cell cycle and increased apoptosis in EoC compared with NL were identified by functional enrichment analysis and immunostaining using Ki-67 and cleaved caspase-3. Pericryptal circumferential eosinophil collars were associated with the EoC transcriptome (P < .001). EoC transcriptome-based scores were reversible with disease remission and differentiated EoC from IBD, even after controlling for colonic eosinophil levels (P < .0001).

Conclusions: We established EoC transcriptomic profiles, identified mechanistic pathways, and integrated findings with parallel IBD and EGID data. These findings establish EoC as a distinct disease compared with other EGIDs and IBD, thereby providing a basis for improving diagnosis and treatment.

Keywords: Colitis; Eosinophil; Eosinophilic Colitis; Inflammatory Bowel Disease; Transcriptome.


Figures

Figure 1.
Figure 1.. Distinct, conserved pattern of gene expression in active EoC colonic tissue.
A, Volcano plot (red, upregulated; blue, downregulated) of expression profiles of differentially dysregulated genes between NL and subjects with active EoC (EoC, FDR P < .05, ≥1.5-fold change). B, Clustering analysis based on 987 differentially expressed genes (EoC transcriptome). C, Venn diagram of the number of genes dysregulated in EoC and CD transcriptomes (Supplemental Figure S1). D, Colonic transcriptome data on NL (blue), subjects with inflamed CD (CD, yellow), and subjects with active EoC (red) reduced to 3-dimensional presentation by multidimensional scaling analysis for visual presentation of the expression distance between samples. E, Heat map (red, upregulated; blue, downregulated) and clustering analysis of the expression profiles of the 1,847 genes from the EoC and/or CD transcriptomes with differentially dysregulated expression in active EoC and/or inflamed CD vs. NL (FDR P < .05, ≥1.5-fold change). B and E, each column represents an individual subject or control. CD, Crohn disease; EoC, eosinophilic colitis; NL, normal; FDR, false discovery rate.
Figure 2.
Figure 2.. EoC transcriptome associates with colonic eosinophilia and distinguishes EoC from NL and other EGIDs.
A–C, correlation plots for peak colonic eosinophil count and colonic expression of CLC and CCL11, the genes that most correlated with EoC eosinophil count. D, Correlation of peak colonic eosinophil counts with each of the EoC and CD transcriptomes. ****p < .0001, using the chi-square test. E, Venn diagram of the number of genes dysregulated in EGID transcriptomes (EoE, EoG, EoC). F–H, Comparisons of type 2–related gene expression by RT-qPCR in active EGIDs [esophagus (EoE n=82, NL n=50), stomach (EoG n=21, NL n=20), colon (EoC n=12, NL n=16)]. F, eosinophil and mast cells genes; G, eosinophil chemotactic chemokines; H, type 2 cytokines. Data presented as median with interquartile range. Markers represent individual samples. *P < .05, **P < .01, and ****P < .0001, using Mann–Whitney U test. CD, Crohn disease; EoC, eosinophilic colitis; EoE, eosinophilic esophagitis; EoG, eosinophilic gastritis; EGIDs, eosinophilic gastrointestinal diseases; NL, normal; GI, gastrointestinal; HPF, high-power microscopic field; TPM, transcripts per kilobase million.
Figure 3.
Figure 3.. Functions and cell types enriched in EoC transcriptome.
A–B, Functional annotation enrichment analyses of 410 downregulated (A) and 577 upregulated (B) genes of EoC transcriptome using CluGO overview charts and showing the 5 most significant terms in biological process by ToppGene (full list; Supplementary Table 8). C–D, Decreased cell proliferation and increased apoptosis in patients with EoC. Representative photographs and quantitative evaluation of Ki–67+ (proliferating) and cleaved caspase-3+ (apoptotic) colonic cells from NL, inflamed CD, and active EoC. Ki–67+: left, 4X; right, 20X. Cleaved caspase-3+: left, 10X; right, 20X. *P < .05, versus NL. E–F, Specific increase of gene expression–estimated proportion of cell types in EoC (E) and CD (F). Data presented as mean ± SEM. *P < .05, **P < .01, ***p < .001, ****p < .0001, using Kruskal-Wallis test followed by Dunn multiple-comparison test. aDC, activated dendritic cells; CD, Crohn disease; CD4+ Tem, CD4+ effector memory T cells; EoC, eosinophilic colitis; MPP, multipotent progenitors; NL, normal; FDR, false discovery rate; SEM, standard error of mean.
Figure 4.
Figure 4.. Colonic histologic features and associations with colonic transcripts.
A, Hematoxylin and eosin–stained colon biopsy specimen of a representative subject with EoC (200X magnification). Eosinophils densely populate crypts (arrow) and pericryptal circumferential collars (arrowhead). B, Histologic feature clustering in colon biopsies with features arranged to ensure that members of the same cluster are adjacent in the correlation plot and in the same order as in the cluster members. Color map shows correlations among histologic features; darker red shades indicate stronger positive correlations. C, Comparison of histologic features among NL, inflamed CD, and active EoC. Data are mean ± SEM. *P < .05, **P < .01, and ****p < .0001, using Kruskal-Wallis test followed by Dunn multiple-comparison test. D, Spearman r correlations of eosinophilic histologic features with cell proliferation/apoptosis in the epithelium. *P < .05. E, Hierarchic relationships between histologic features on the basis of EoC transcriptome gene expression profile correlations, showing a Spearman r–based heat diagram for gene-level correlations. Darker red shades indicate stronger positive correlations, whereas darker blue shades indicate stronger negative correlations. EoC, eosinophilic colitis; CD, Crohn disease; NL, normal; SEM, standard error of mean.
Figure 5.
Figure 5.. EoC transcriptome as a function of disease activity and differential diagnosis.
A, Schematic summary of EoC score generation based on dimensionality reduction of the EoC transcriptome to distinguish active EoC vs. NL and quantify EoC disease severity. B, Discovery and replication of the EoC score with independent patients and from different colon sites (discovery: ascending, replication: descending/sigmoid colon). Peak colonic eosinophil count (left) and EoC score (right) are shown. Data are mean ± SEM. ***P < .001, using Mann–Whitney U test. C, EoC score as a function of disease activity in EoC. Peak colonic eosinophil count (left) and the EoC score (right) are shown. Data are mean ± SEM. **P < .01, ***p < .001, and ****p < .0001, using Kruskal-Wallis test followed by Dunn multiple-comparison test. D, Unsupervised principal component analysis of the EoC transcriptome showed complete separation of active EoC from inactive EoC and controls, whereas controls and inactive EoC overlapped. E, Comparison between active EoC and the challenge cases of IBD (CD and UC) with high colonic eosinophil count (High eos). Peak colonic eosinophil count (left) and the EoC-IBD differential score (right) are shown. The dashed line indicates 65 eosinophils/HPF. Data are mean ± SEM. NS, not significant, ***P < .001, and ****P < .0001, using Mann–Whitney U test. F, A receiver operating characteristic curve analysis showing utility of the EoC-IBD differential score to differentiate active EoC from IBD (CD and UC) (High eos). AUC, area under the curve; EoC, eosinophilic colitis; IBD, inflammatory bowel disease; CD, Crohn disease; UC, ulcerative colitis; NL, normal; HPF, high-power microscopic field; SEM, standard error of mean.

Comment in

References

    1. Rothenberg ME. Eosinophilic gastrointestinal disorders (EGID). J Allergy Clin Immunol 2004;113:11–28. - PubMed
    1. Jensen ET, Martin CF, Kappelman MD, et al. Prevalence of Eosinophilic Gastritis, Gastroenteritis, and Colitis: Estimates From a National Administrative Database. J Pediatr Gastroenterol Nutr 2016;62:36–42. - PMC - PubMed
    1. Mansoor E, Saleh MA, Cooper GS. Prevalence of Eosinophilic Gastroenteritis and Colitis in a Population-Based Study, From 2012 to 2017. Clin Gastroenterol Hepatol 2017;15:1733–1741. - PubMed
    1. DiTommaso LA, Rosenberg CE, Eby MD, et al. Prevalence of eosinophilic colitis and the diagnoses associated with colonic eosinophilia. J Allergy Clin Immunol 2019;143:1928–1930. - PMC - PubMed
    1. Jensen ET, Aceves SS, Bonis PA, et al. High Patient Disease Burden in a Cross-sectional, Multicenter Contact Registry Study of Eosinophilic Gastrointestinal Diseases. J Pediatr Gastroenterol Nutr 2020;71:524–529. - PMC - PubMed

Publication types

Supplementary concepts