. 2022 Apr 12;6(7):2254-2266.
doi: 10.1182/bloodadvances.2021004366.

IRF8 is a transcriptional activator of CD37 expression in diffuse large B-cell lymphoma

Affiliations

IRF8 is a transcriptional activator of CD37 expression in diffuse large B-cell lymphoma

Suraya Elfrink et al. Blood Adv. .

Abstract

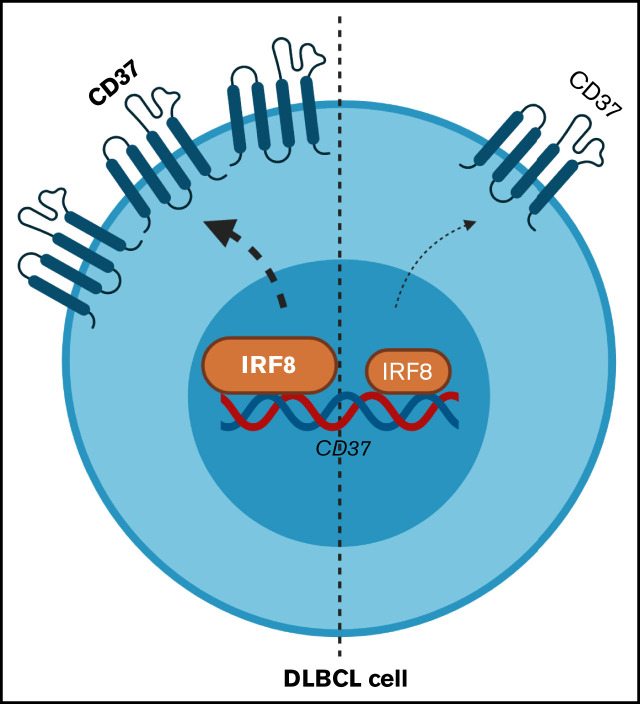
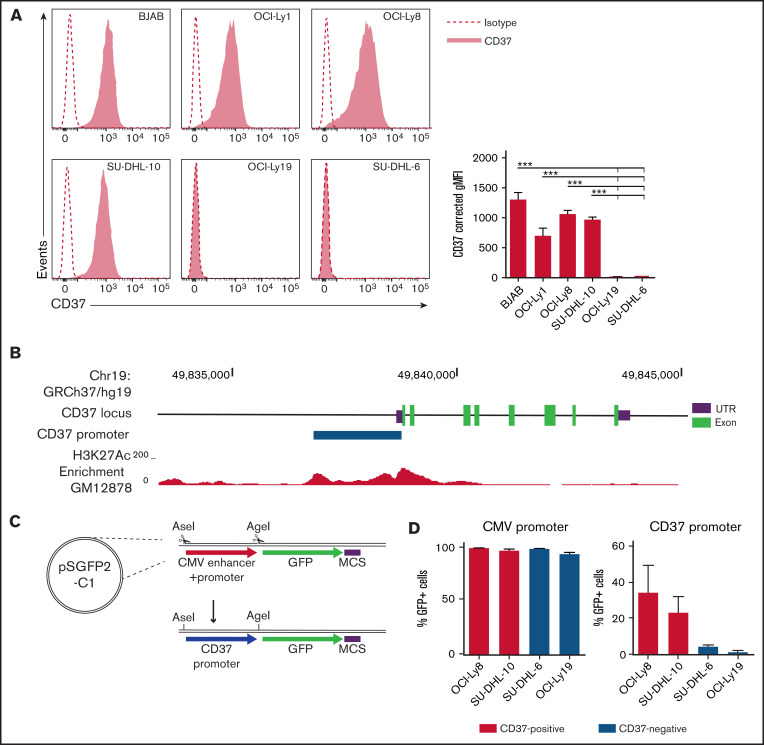
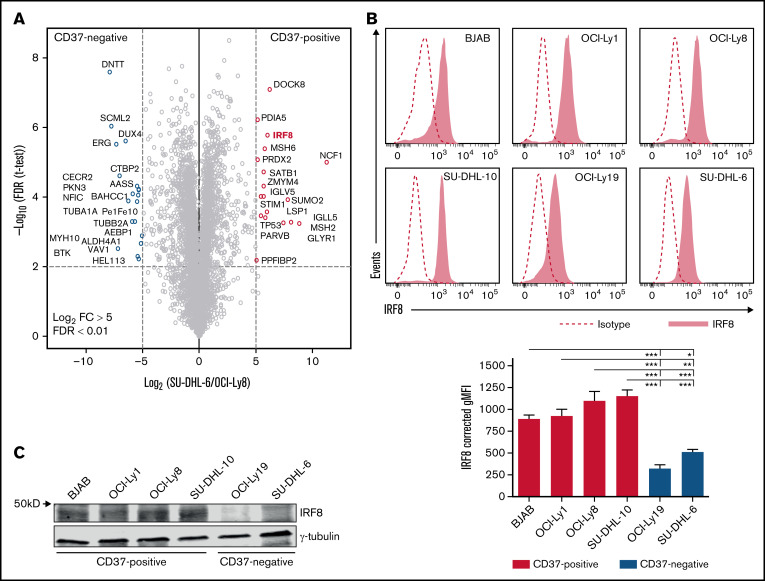
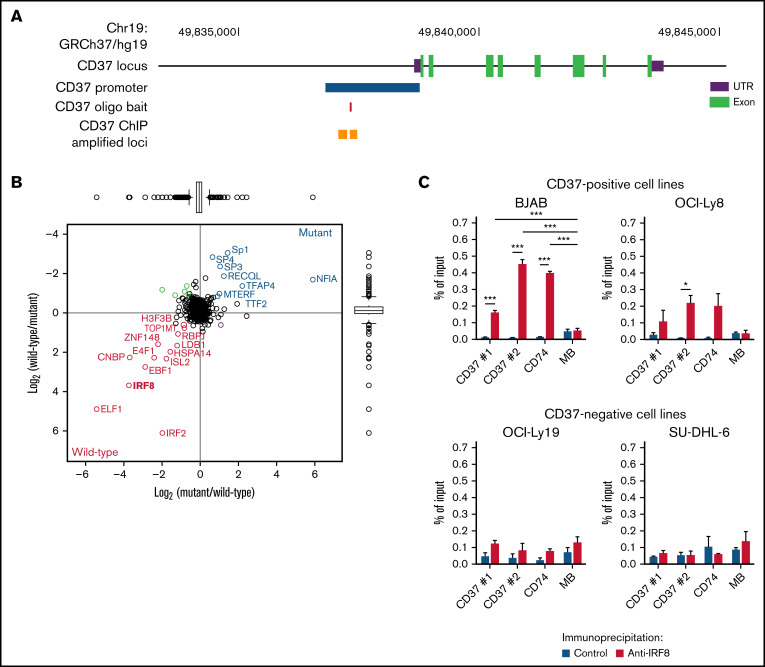
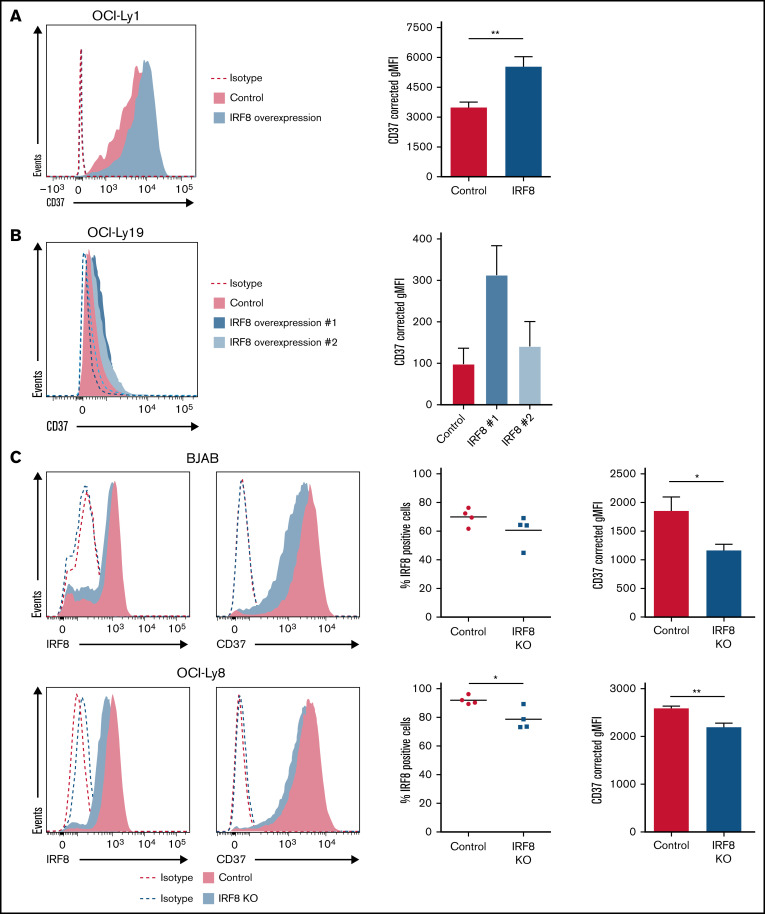
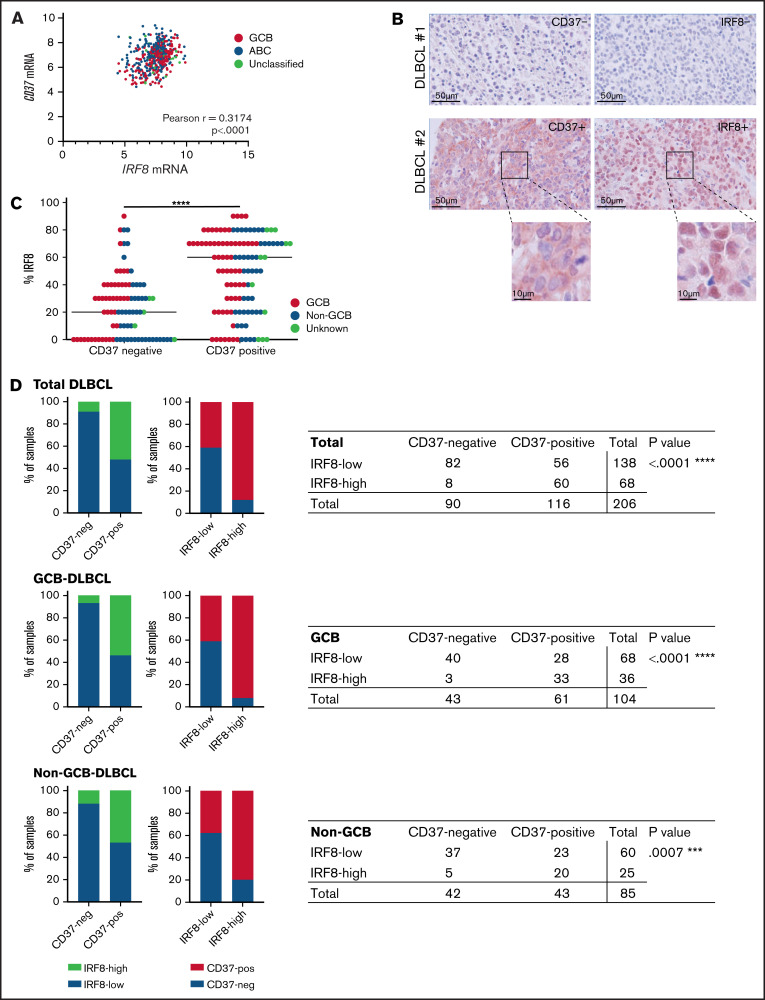
Diffuse large B-cell lymphoma (DLBCL) represents the most common form of non-Hodgkin lymphoma (NHL) that is still incurable in a large fraction of patients. Tetraspanin CD37 is highly expressed on mature B lymphocytes, and multiple CD37-targeting therapies are under clinical development for NHL. However, CD37 expression is nondetectable in ∼50% of DLBCL patients, which correlates with inferior treatment outcome, but the underlying mechanisms for differential CD37 expression in DLBCL are still unknown. Here, we investigated the regulation of the CD37 gene in human DLBCL at the (epi-)genetic and transcriptional level. No differences were observed in DNA methylation within the CD37 promoter region between CD37-positive and CD37-negative primary DLBCL patient samples. On the contrary, CD37-negative DLBCL cells specifically lacked CD37 promoter activity, suggesting differential regulation of CD37 gene expression. Using an unbiased quantitative proteomic approach, we identified transcription factor IRF8 to be significantly higher expressed in nuclear extracts of CD37-positive as compared with CD37-negative DLBCL. Direct binding of IRF8 to the CD37 promoter region was confirmed by DNA pulldown assay combined with mass spectrometry and targeted chromatin immunoprecipitation (ChIP). Functional analysis indicated that IRF8 overexpression enhanced CD37 protein expression, while CRISPR/Cas9 knockout of IRF8 decreased CD37 levels in DLBCL cell lines. Immunohistochemical analysis in a large cohort of primary DLBCL (n = 206) revealed a significant correlation of IRF8 expression with detectable CD37 levels. Together, this study provides new insight into the molecular mechanisms underlying differential CD37 expression in human DLBCL and reveals IRF8 as a transcriptional regulator of CD37 in B-cell lymphoma.


Figures

None
Graphical abstract
Figure 1.
Figure 1.
CD37-negative DLBCL cell lines lack CD37 promoter activity. (A) Representative histograms (left) and quantification (right) of flow cytometry analysis of CD37 membrane expression on human DLBCL cell lines. Corrected geometric mean fluorescence intensity (gMFI): gMFI corrected for gMFI of isotype control. One-way ANOVA analysis was followed by Tukey's multiple comparisons test. ***P < .001 represents the significance of each cell line compared with OCI-Ly19 and SU-DHL-6 separately. Data represent mean + SEM of 3 independent experiments. (B) Schematic representation of the CD37 gene locus and upstream sequence. The blue bar indicates the locus of the CD37 promoter as used in (C) and (D), based on the H3K27Ac enrichment in the lymphoblastoid GM12878 cell line (as obtained via the University of California, Santa Cruz Genome Browser, data from the Bernstein Laboratory at the Broad Institute). UTR, untranslated region. (C) Schematic representation of the GFP-reporter plasmid. GFP, green fluorescent protein; MCS, multiple cloning site. (D) Percentage of GFP-positive cells in CD37-positive and CD37-negative DLBCL cell lines transfected with CMV promoter-GFP or CD37 promoter-GFP construct. Data represent mean + SEM of 3 independent experiments.
Figure 2.
Figure 2.
Identification of IRF8 in CD37-positive DLBCL cell lines. (A) Volcano plot of the label-free quantification (LFQ) of protein abundance in the nuclear protein fractions of CD37-negative (SU-DHL-6) vs CD37-positive (OCI-Ly8) DLBCL cells. Gene names are indicated. The volcano plot presents data of n = 3 technical replicates for both SU-DHL-6 and OCI-Ly8 extract. (B) Representative histograms (top) and quantification (bottom) of flow cytometry analysis of IRF8 expression in human DLBCL cell lines. Corrected gMFI: gMFI corrected for gMFI of isotype control. One-way ANOVA analysis was followed by Tukey's multiple comparisons test. ***P < .001, **P < .01, *P < .05. Data represent mean + SEM of 3 independent experiments. (C) Representative western blot stained for IRF8 and γ-tubulin as loading control in indicated CD37-positive and CD37-negative DLBCL cell lines.
Figure 3.
Figure 3.
IRF8 binds to the upstream regulatory region of the human CD37 gene. (A) Schematic representation of the CD37 gene locus and upstream sequence. The blue bar indicates the locus of the CD37 promoter, as shown in Figure 1. The red bar indicates the sequence locus of the DNA oligo bait. Orange boxes show amplified loci in qPCR preceded by immunoprecipitation using an anti-IRF8 antibody (ChIP-seq). (B) Scatterplot showing the results of a DNA pulldown experiment with CD37 oligo bait, analyzed by liquid chromatography-mass spectrometry using dimethyl labeling for quantification. The x-axis shows the ratio of proteins labeled as mutant bait: heavy/WT CD37 bait: light, whereas the y-axis shows the label-swap experiment (WT CD37 bait: heavy/mutant bait: light). Proteins labeled in blue are specific interactors of the mutated control sequence, and proteins labeled in red are specific interactors of the WT sequence. (C) ChIP using anti-IRF8 antibody or control, followed by qPCR analysis in 2 CD37-positive (BJAB [left], OCI-Ly8 [right]) and 2 CD37-negative (OCI-Ly19 [left], SU-DHL-6 [right]) DLBCL cell lines. Two primer sets were used to analyze the CD37 upstream locus, as indicated in (A). CD74 was used as a positive control and MB as a negative control. Differences were determined using a 2-way ANOVA followed by Tukey's multiple comparisons test. *P < .05, ***P < .001. Data represent mean + SEM of 3 independent experiments.
Figure 4.
Figure 4.
IRF8 directly affects the expression of CD37 in DLBCL cell lines. (A) Representative histogram (left) and quantification (right) of flow cytometry analysis of CD37 membrane expression on GFP-positive OCI-Ly1 cells transfected with empty IRES-EGFP (control) or IRF8-IRES-EGFP expression plasmid (IRF8). **P < .01, paired t test. Data represent mean + SEM of 4 independent experiments. (B) Representative histogram (left) and quantification (right) of flow cytometry analysis of CD37 membrane expression on 2 independent batches of OCI-Ly19 cells that stably overexpress IRF8. Data represent mean + SEM of 3 independent experiments. (C) Representative histograms (left) and quantification (right) of flow cytometry analysis of BJAB (top) and OCI-Ly8 (bottom) control and IRF8 KO cells. The percentage of IRF8-positive cells was determined as the percentage of cells with IRF8 signal above isotype level: *P < .05, unpaired t test. Quantification of CD37 expression: *P < .05, **P < .01, unpaired t test. Data represent mean + SEM of 4 independent experiments. Corrected gMFI: gMFI corrected for gMFI of isotype control.
Figure 5.
Figure 5.
IRF8 expression correlates with CD37 expression in primary human DLBCL. (A) Analysis of IRF8 and CD37 mRNA levels in primary DLBCL (n = 498). Linear regression R2= 0.1007. Pearson correlation r = 0.3174; 95% CI, 0.2361-0.3943; ****P < .0001. (B) CD37 and IRF8 IHC staining (red) of 2 representative DLBCL biopsies: CD37/IRF8 double-negative (top) and CD37/IRF8 double-positive (bottom) human DLBCL. Cell nuclei were counterstained with hematoxylin (blue). (C) IHC staining of CD37 and IRF8 was scored in 206 primary DLBCL samples. The percentage indicates the percentage of IRF8-positive tumor cells per sample. Each dot represents 1 tumor sample. GCB/non-GCB status was known for 189 samples and is indicated (red: GCB; blue: non-GCB). The bar indicates the median percent IRF8 value per group. χ-square test of the absolute number of total DLBCL samples per group showed a significant association between the percentage of IRF8 and CD37 expression. ****P < .0001. (D) Samples were determined CD37-negative and IRF8-low when scoring was <10% and <60%, respectively. Data about GCB (middle) and non-GCB (bottom) status were available for 189 out of the 206 analyzed patients. P value shows the statistical significance obtained using Fisher’s exact test. ****P < .0001 (total DLBCL), ****P < .0001 (GCB), and ***P = .0007 (non-GCB).

References

    1. Martelli M, Ferreri AJM, Agostinelli C, Di Rocco A, Pfreundschuh M, Pileri SA. Diffuse large B-cell lymphoma. Crit Rev Oncol Hematol. 2013;87(2):146-171. - PubMed
    1. Sarkozy C, Sehn LH. Management of relapsed/refractory DLBCL. Best Pract Res Clin Haematol. 2018;31(3):209-216. - PubMed
    1. de Winde CM, Zuidscherwoude M, Vasaturo A, van der Schaaf A, Figdor CG, van Spriel AB. Multispectral imaging reveals the tissue distribution of tetraspanins in human lymphoid organs. Histochem Cell Biol. 2015;144(2):133-146. - PMC - PubMed
    1. Barrena S, Almeida J, Yunta M, et al. . Aberrant expression of tetraspanin molecules in B-cell chronic lymphoproliferative disorders and its correlation with normal B-cell maturation. Leukemia. 2005;19(8):1376-1383. - PubMed
    1. de Winde CM, Elfrink S, van Spriel AB. Novel Insights into membrane targeting of B cell lymphoma. Trends Cancer. 2017;3(6):442-453. - PubMed

Publication types

MeSH terms