. 2022 Jan 27;13(1):536.
doi: 10.1038/s41467-022-28191-1.

Aberrant upregulation of the glycolytic enzyme PFKFB3 in CLN7 neuronal ceroid lipofuscinosis

Affiliations

Aberrant upregulation of the glycolytic enzyme PFKFB3 in CLN7 neuronal ceroid lipofuscinosis

Irene Lopez-Fabuel et al. Nat Commun. .

Abstract

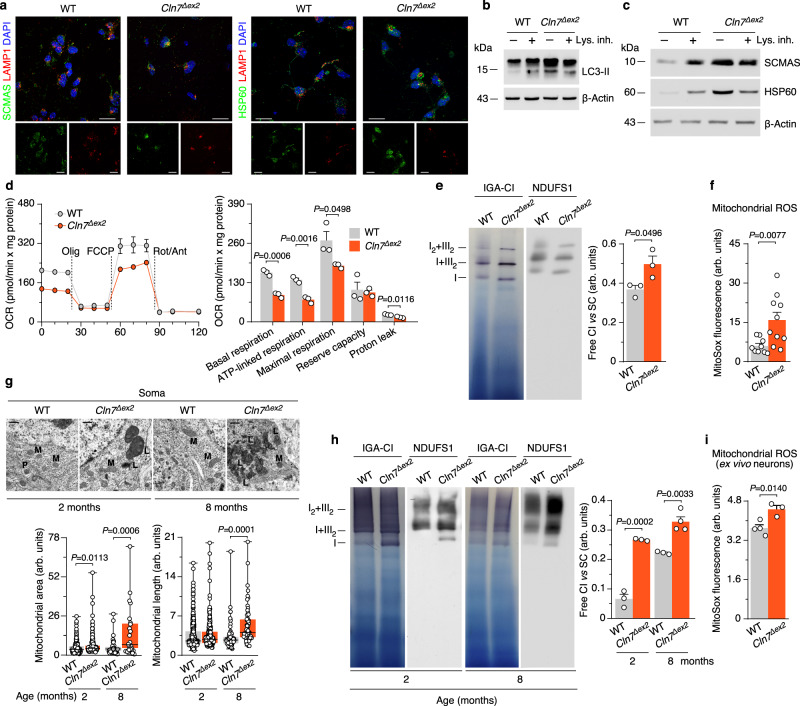
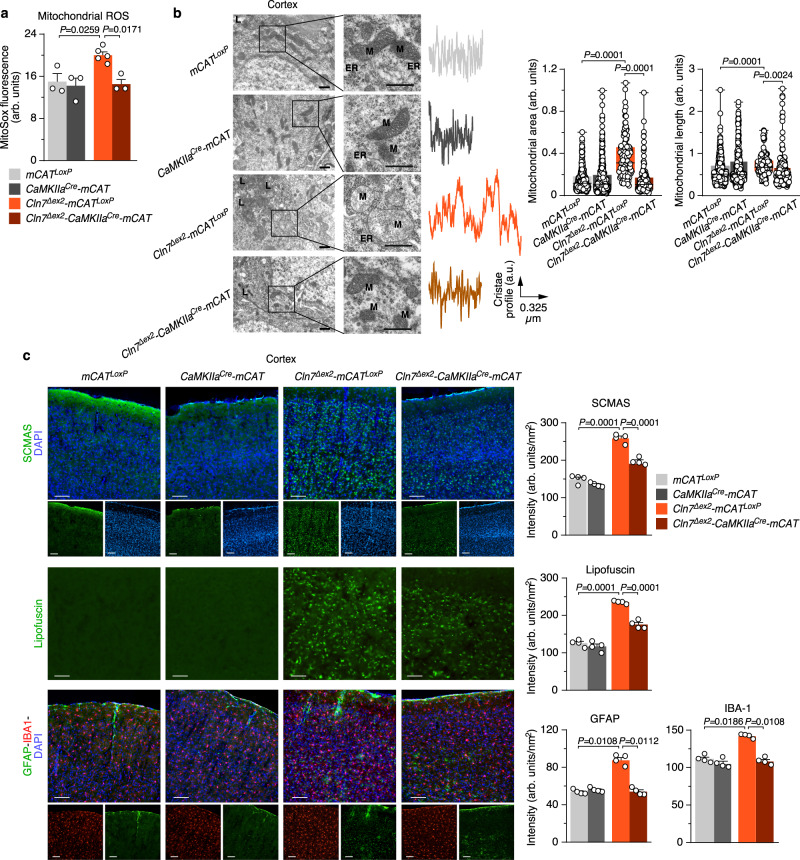
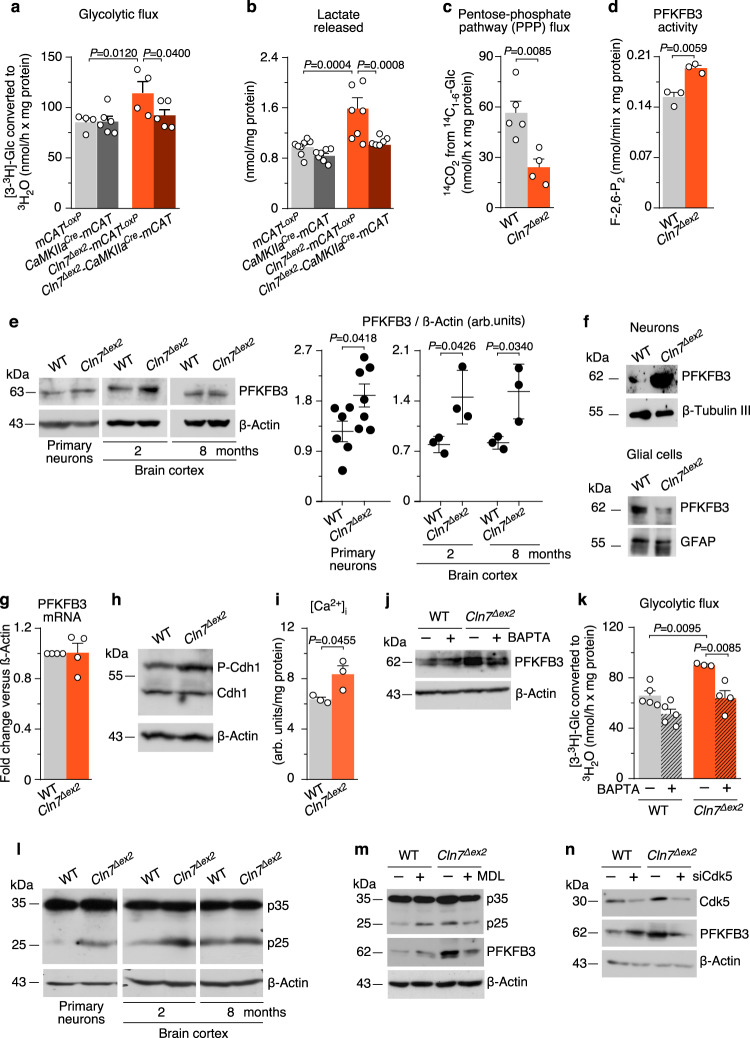
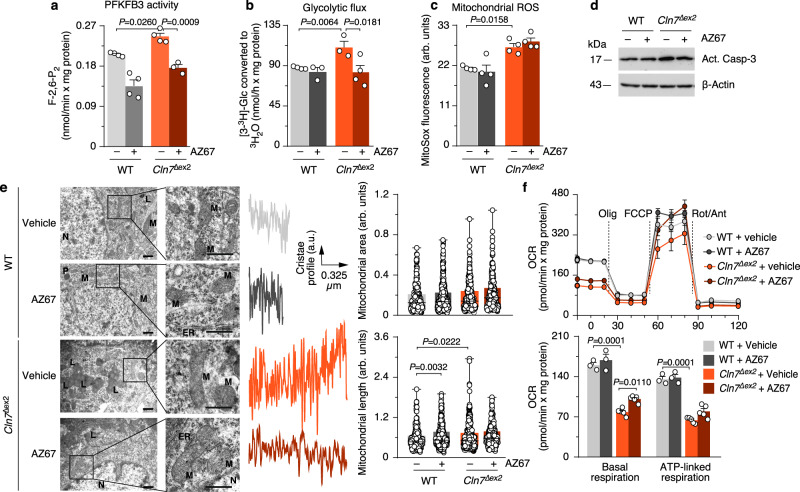
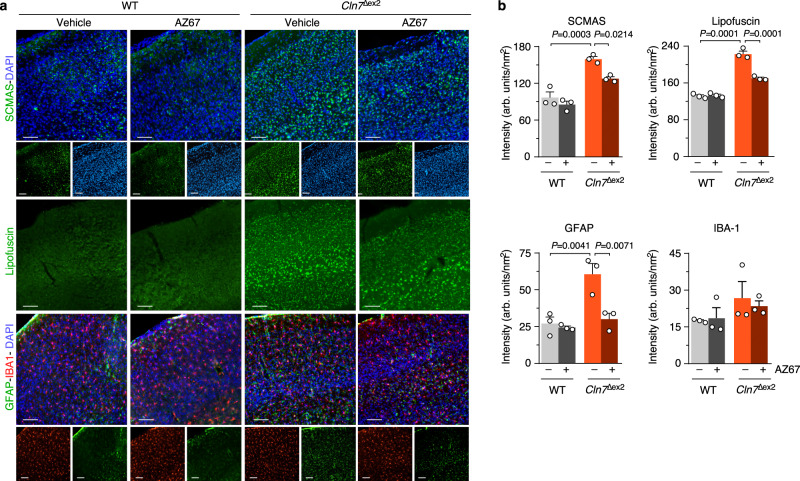
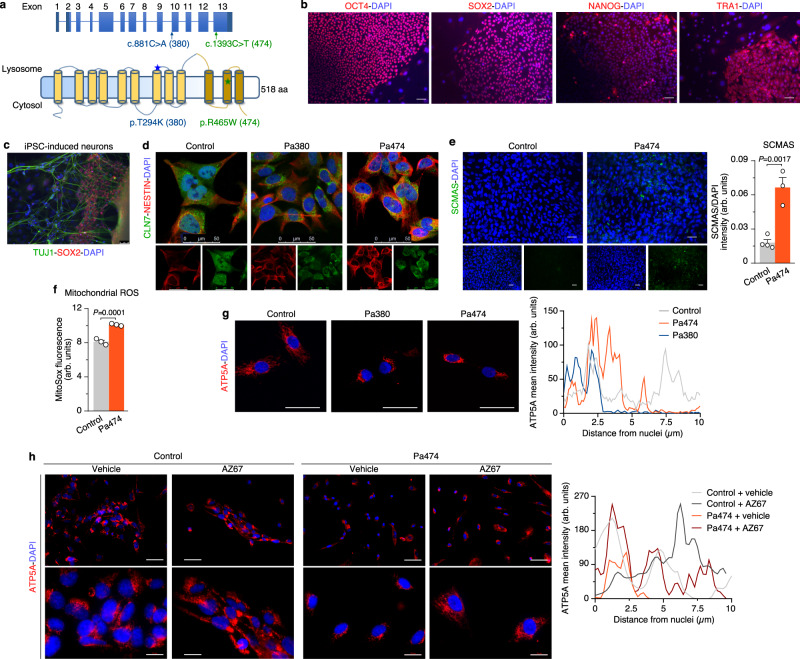
CLN7 neuronal ceroid lipofuscinosis is an inherited lysosomal storage neurodegenerative disease highly prevalent in children. CLN7/MFSD8 gene encodes a lysosomal membrane glycoprotein, but the biochemical processes affected by CLN7-loss of function are unexplored thus preventing development of potential treatments. Here, we found, in the Cln7∆ex2 mouse model of CLN7 disease, that failure in autophagy causes accumulation of structurally and bioenergetically impaired neuronal mitochondria. In vivo genetic approach reveals elevated mitochondrial reactive oxygen species (mROS) in Cln7∆ex2 neurons that mediates glycolytic enzyme PFKFB3 activation and contributes to CLN7 pathogenesis. Mechanistically, mROS sustains a signaling cascade leading to protein stabilization of PFKFB3, normally unstable in healthy neurons. Administration of the highly selective PFKFB3 inhibitor AZ67 in Cln7∆ex2 mouse brain in vivo and in CLN7 patients-derived cells rectifies key disease hallmarks. Thus, aberrant upregulation of the glycolytic enzyme PFKFB3 in neurons may contribute to CLN7 pathogenesis and targeting PFKFB3 could alleviate this and other lysosomal storage diseases.


Conflict of interest statement

P.O.F. is a shareholder and O.B. is an employee of Gero Discovery LLC, a company developing PFKFB3 inhibitors. The remaining authors declare no competing interests.

Figures

Fig. 1
Fig. 1. Failure in autophagy causes accumulation of structural and functionally impaired mitochondria in Cln7∆ex2 mouse.
a SCMAS/LAMP1 and HSP60/SCMAS colocalization confocal analyses in primary neurons. DAPI reveals nuclei. Scale bar, 20 µm. b LC3-II western blot analysis in primary neurons incubated with lysosomal inhibitors leupeptin (100 µM) plus NH4Cl (20 mM) (Lys. Inh.) for 1 h (ß-actin, loading control). c HSP60 and SCMAS western blot analysis in primary neurons incubated with lysosomal inhibitors leupeptin (100 µM) plus NH4Cl (20 mM) (Lys. Inh.) for 1 h (ß-actin, loading control). d OCR analysis (left) and calculated parameters (right) in primary neurons. Data are mean ± SEM from n = 3 independent experiments. e Free complex I (CI) and CI-containing supercomplexes (SC) analyses in primary neurons by BNGE in-gel activity (IGA-CI) and by immunoblotted PVDF membranes against CI subunit NDUFS1. Data are mean ± SEM from n = 3 independent experiments. f Mitochondrial ROS analysis in primary neurons. Data are mean ± SEM from n = 9 (WT), n = 10 (Cln7Δex2) independent experiments. g Representative electron microscopy images and analyses of mouse brain cortex mitochondria. Data are in box plots (the box extends from the 25th to 75th percentiles, the horizontal line indicates the median, and the whiskers go down to the smallest value and up to the largest) from n ≥ 27 mitochondria per condition. Scale bar, 500 nm. (M mitochondria, L lysosome, P peroxisomes). h Free CI and CI-containing SC analyses of mouse brain cortex by BNGE IGA-CI and by immunoblotted PVDF membranes against NDUFS1. Data are mean ± SEM from n = 3 or n = 4 (Cln7Δex2) 8-month old animals. i Mitochondrial ROS analysis in freshly isolated mouse brain cortex neurons. Data are mean ± SEM from n = 3 or n = 4 (WT) animals of 6-month old. Statistical analyses were performed by two-tailed Student’s t test. Representative images and western blots out of n ≥ 3 experiments are shown. See also Supplementary Fig. 1. Source data are provided as a Source Data file.
Fig. 2
Fig. 2. Increased generation of mitochondrial ROS by neurons accounts for impaired mitochondrial accumulation and hallmarks of CLN7 disease in Cln7∆ex2 mouse in vivo.
a Mitochondrial ROS analysis in primary neurons from the designed genotype. Data are mean ± SEM from n = 3 or n = 5 (Cln7Δex2-mCATLoxP) independent experiments. b Representative electron microscopy images of the mouse brain cortex displaying the cristae profile plot of intensities over the maximal axis of the magnified shown mitochondrion (left) and the analyses of mitochondrial area and length (right). Data are in box plots (the box extends from the 25th to 75th percentiles, the horizontal line indicates the median, and the whiskers go down to the smallest value and up to the largest) from n ≥ 136 mitochondria per condition of 3-month-old mice. Scale bars, 600 nm. (M mitochondria, L lysosome, ER endoplasmic reticulum). c Representative images of SCMAS, lipofuscin, GFAP and IBA-1 immunohistochemical analysis of the mouse brain cortex. Data are mean ± SEM from n = 4 animals of 3-month old (three serial slices per mouse). Scale bar, 100 µm. Statistical analyses were performed by one-way ANOVA followed by Tukey’s post hoc test. See also Supplementary Fig. 2. Source data are provided as a Source Data file.
Fig. 3
Fig. 3. Upregulation of PFKFB3 protein and activity via a Ca2+/calpain/Cdk5 pathway sustains a high glycolytic flux in Cln7∆ex2 neurons.
a Glycolytic flux in primary neurons. Data are mean ± SEM from n = 4 (mCATLoxP, Cln7Δex2-mCATLoxP), n = 6 (CaMKIIaCre-mCAT) or n = 5 (Cln7Δex2-CaMKIIaCre-mCAT) independent experiments. b Lactate released by primary neurons (n = 7–8). Data are mean ± SEM from n = 7 (CaMKIIaCre-mCAT) or n = 8 independent experiments. c PPP flux in primary neurons. Data are mean ± SEM from n = 5 (WT) or n = 4 (Cln7Δex2) independent experiments. d Rate of P-2,6-P2 formation in primary neurons. Data are mean ± SEM from n = 3 independent experiments. e Representative PFKFB3 western blot analysis in primary neurons and brain cortex (ß-actin, loading control) and the densitometric quantification of the bands (including the replicas). Data are mean ± SD from n = 6 (WT), n = 7 (Cln7Δex2) independent experiments, or n = 3 animals. f Representative western blots showing PFKFB3 protein abundances in immunomagnetically isolated neurons or glial cells (ß-tubulin III and glial-fibrillary acidic protein or GFAP, loading control for neurons and astrocytes, respectively). g PFKFB3 mRNA analysis by RT–qPCR in primary neurons. Data are mean ± SEM from n = 4 independent experiments (values normalized versus ß-actin). h Representative Cdh1 western blot analysis after PhosTag acrylamide electrophoresis in primary neurons (P-Cdh1, hyperphosphorylated Cdh1; ß-actin, loading control). i Cytosolic Ca2+ analysis in primary neurons. Data are mean ±  SEM from n = 3 independent experiments. j, k Representative PFKFB3 western blot (j) and glycolytic flux (k) analyses in primary neurons incubated with Ca2+ quelator BAPTA (10 µM; 1 h) (ß-actin, loading control). Data are mean ± SEM from n = 5 (WT), n = 4 (Cln7Δex2) independent experiments. l Representative p35 western blot revealing p35 and its cleavage product p25 in primary neurons and brain cortex (ß-actin, loading control). m Representative p35 and PFKFB3 western blot analyses in primary neurons incubated with calpain inhibitor MDL-28170 (MDL) (100 µM; 24 h) (ß-actin, loading control). n Representative Cdk5 and PFKFB3 western blot analyses in primary neurons transfected with Cdk5 siRNA (siCdk5) or scrambled siRNA (–) (9 nM; 3 days) (ß-actin, loading control). Statistical analyses performed by one-way ANOVA followed by DMS’s (a) or Tukey’s (b, k) post hoc tests or two-tailed Student’s t test (c, d, e, g, i). See also Supplementary Fig. 3. Source data are provided as a Source Data file.
Fig. 4
Fig. 4. Pharmacological targeting PFKFB3 restores mitochondrial alterations of Cln7∆ex2 disease in vivo.
ad Analysis of PFKFB3 activity (a), glycolytic flux (b), mitochondrial ROS (c), and a representative active caspase-3 by western blot (d), in primary neurons incubated with the PFKFB3 inhibitor AZ67 (10 nM, 24 h). (ß-actin, loading control). Data are mean ± SEM from n = 4 independent experiments. e Representative electron microscopy images of the mouse brain cortex, after 2 months of a daily intracerebroventricular administration of PFKFB3 inhibitor AZ67 (1 nmol/mouse), displaying the cristae profile plot of intensities over the maximal axis of the magnified shown mitochondrion (left) and the analyses of mitochondrial area and length (right). Data are in box plots (the box extends from the 25th to 75th percentiles, the horizontal line indicates the median, and the whiskers go down to the smallest value and up to the largest) from n ≥ 179 mitochondria per condition of 5-month-old mice. Scale bars, 600 nm. (M mitochondria, L lysosome, ER endoplasmic reticulum, N nucleus). f OCR analysis (up) and calculated parameters (down) in primary neurons incubated with the PFKFB3 inhibitor AZ67 (10 nM, 24 h). Data are mean ±  SEM from n = 3 (WT), n = 5 (Cln7Δex2) independent experiments. Statistical analyses performed by one-way ANOVA followed by Tukey’s (a, c, e, f) or DMS’s (b) post hoc tests. See also Supplementary Figs. 4 and 5. Source data are provided as a Source Data file.
Fig. 5
Fig. 5. Pharmacological targeting PFKFB3 restores hallmarks of Cln7∆ex2 disease in vivo.
a Representative images of SCMAS, lipofuscin, GFAP, and IBA-1 immunohistochemical analysis of the mouse brain cortex after 2 months of a daily intracerebroventricular administration of PFKFB3 inhibitor AZ67 (1 nmol/mouse). b Quantification of the images shown in panel a. Data are mean ± SEM from n = 3 animals of 5-month old (three serial slices per mouse). Scale bar, 100 µm. Statistical analyses performed by one-way ANOVA followed by Tukey’s post hoc test. See also Supplementary Figs. 4 and 5. Source data are provided as a Source Data file.
Fig. 6
Fig. 6. PFKFB3 inhibition in CLN7 patient-derived neural precursor cells restores mitochondrial condensation.
a Schematic representation of the locations of the CLN7 mutations found in patient 380 (Pa380, c.881 C > A; pT294K) and patient 474 (Pa474, c.1393 C > T; p.R465W). b iPSC characterization in Pa474 with the pluripotency markers OCT4, SOX2, Nanog, and Tra-1-60. Scale bar, 50 µm. c Characterization of differentiated neurons derived from iPSC in Pa474. Scale bar, 50 µm. d NPCs characterization in Pa380, Pa474, and a healthy, age-matched control individual. Scale bar, 50 µm. e Immunocytochemical analysis of SCMAS abundance in NPCs derived from Pa474 iPSC. Data are the mean ± SEM values from n = 4 (control), n = 3 (Pa474) independent samples (two-tailed Student’s t test). Scale bar, 50 µm. f Mitochondrial ROS analysis in NPCs. Data are the mean ± SEM values from n = 3 independent samples (two-tailed Student’s t test). g Immunocytochemical analysis of mitochondrial marker ATP5A in NPCs derived from Pa380, Pa474, and healthy-matched control patients. Scale bar, 50 µm. The right panel shows a representative pixel intensity profile of ATP5A across the maximal axis of the cell that departs from the nucleus. h Representative image of NPCs derived from Pa474 iPSC incubated with AZ67 for 24 h, fixed and subjected to immunocytochemical analysis for ATP5A. Scale bars, 60 µm (upper images of each condition) and 20 µm (lower images of each condition). The right panel shows a representative pixel intensity profile of ATP5A across the maximal axis of the cell that departs from the nucleus. Source data are provided as a Source Data file.

References

    1. Mole SE, et al. Clinical challenges and future therapeutic approaches for neuronal ceroid lipofuscinosis. Lancet Neurol. 2019;18:107–116. - PubMed
    1. Mole SE, Cotman SL. Genetics of the neuronal ceroid lipofuscinoses (Batten disease) Biochim Biophys Acta. 2015;1852:2237–2241. - PMC - PubMed
    1. McBride JL, et al. Discovery of a CLN7 model of Batten disease in non-human primates. Neurobiol. Dis. 2018;119:65–78. - PMC - PubMed
    1. Siintola E, et al. The novel neuronal ceroid lipofuscinosis gene MFSD8 encodes a putative lysosomal transporter. Am. J. Hum. Genet. 2007;81:136–146. - PMC - PubMed
    1. Aiello C, et al. Mutations in MFSD8/CLN7 are a frequent cause of variant-late infantile neuronal ceroid lipofuscinosis. Hum. Mutat. 2009;30:E530–E540. - PubMed

Publication types

MeSH terms

Supplementary concepts