. 2022 Jan 27;12(1):1526.
doi: 10.1038/s41598-022-05333-5.

Infection dynamics of COVID-19 virus under lockdown and reopening

Affiliations

Infection dynamics of COVID-19 virus under lockdown and reopening

Jakub Svoboda et al. Sci Rep. .

Abstract

Motivated by COVID-19, we develop and analyze a simple stochastic model for the spread of disease in human population. We track how the number of infected and critically ill people develops over time in order to estimate the demand that is imposed on the hospital system. To keep this demand under control, we consider a class of simple policies for slowing down and reopening society and we compare their efficiency in mitigating the spread of the virus from several different points of view. We find that in order to avoid overwhelming of the hospital system, a policy must impose a harsh lockdown or it must react swiftly (or both). While reacting swiftly is universally beneficial, being harsh pays off only when the country is patient about reopening and when the neighboring countries coordinate their mitigation efforts. Our work highlights the importance of acting decisively when closing down and the importance of patience and coordination between neighboring countries when reopening.


Conflict of interest statement

The authors declare no competing interests.

Figures

Figure 1
Figure 1
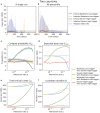
The disease spread without an intervention. (a) Two days after being exposed to the disease (E), the individual becomes infectious (I) as they develop mild condition. If a critical condition develops (C), the individual is hospitalized and isolated. We assume that all surviving individuals (R) acquire immunity. (b) A population of N individuals. Each day, an individual meets k other individuals. During a single meeting with an infectious person, a susceptible individual contracts a disease with a transmission probability p. (c) Without intervention, the disease surges through the community and the critical cases (curve) at its peak Cmax exceed the available hospital bed capacity c (dashed lines,). Here N=1000k=15p=2%, thus the effective reproductive rate Re is roughly Re2.9.
Figure 2
Figure 2
Basic policies. (a) Under a policy P(τ,k,d), the country locks down to k<k0 daily contacts whenever the number C(t) of critical cases exceeds a trigger threshold τ. It reopens (to k0 daily contacts) once the number of critical cases stays below τ for d consecutive days. (b) We consider four different policies given by a combination of a trigger threshold (low trigger τlow=3, high trigger τhigh=12) and a lockdown severity (severe klow=1.25, moderate khigh=6), and common patience d=10 days. (c) Representative runs under the four policies (for 800 days). While with the severe high-trigger policy PSH (top left) all peaks are similar in shape, with the moderate low-trigger policy PML (bottom right) all subsequent peaks are much smaller than the first one. With the moderate high-trigger policy PMH (top right) the capacity is exceeded and with the severe low-trigger policy PSL (bottom left) the disease is quickly eradicated.
Figure 3
Figure 3
Performance of low-trigger and high-trigger policies. The four performance measures: (a) average peak size Cmax, (b) overflow probability pfail, (c) total critical cases Call, and (d) lockdown duration D (105 runs). In each panel, we vary the number k of daily contacts (x-axis) and consider the performance (cost) of the low-trigger policies (τlow=3, blue) and of the high-trigger policies (τhigh=12, green), when the patience parameter is low (d=7 days, left column) and high (d=70, right column). The dotted red line shows the number k of daily contacts that corresponds to the effective reproductive rate Re equal to 1 (when no individuals have yet recovered). Generally speaking, it is beneficial to have the trigger value τ low (blue curves are below green ones), to impose severe rather than moderate lockdown (all curves are increasing functions of k for kk), and to be patient (the curves in the right panels are lower). For Cmax and pfail, the key is to have the trigger value τ low. For Call and D, the key is to have the patience d high.
Figure 4
Figure 4
Two countries. (a) When two countries interact with a positive rate q they might reinfect each other. Here q=5·10-4, and the countries employ different policies: PML (blue) and PSH (yellow). (b) A 90% percentile: on any given day, 90% of the runs are below the respective curves (105 runs). (cf) The performance of a PML policy against a PSH policy (blue), PSH vs. PML (green), PML vs. PML (yellow) and PSH vs. PSH (red), averaged over 104 runs. We vary the interaction rate q on a log-scale and measure: (c) the overflow probability pfail (95% confidence intervals are shaded); (d) the expected peak size Cmax; (e) the total number Call of critical cases; and (f) the lockdown duration D. A country employing PSH does great when its neighbor employs PSH (red) but bad when the neighbor employs PML (green). A country employing PML does comparably well, regardless of whether the neighbor employs PML (yellow) or PSH (blue).

References

    1. Bernoulli D, Blower S. An attempt at a new analysis of the mortality caused by smallpox and of the advantages of inoculation to prevent it. Rev. Med. Virol. 2004;14:275–288. - PubMed
    1. Hamer WH. Epidemic Disease in England: The Evidence of Variability and of Persistency of Type. Bedford Press; 1906.
    1. Kermack WO, McKendrick AG. A contribution to the mathematical theory of epidemics. Proc. R. Soc. Lond. Ser. A Contain. Pap. Math. Phys. Character. 1927;115:700–721.
    1. Bailey NT, et al. The Mathematical Theory of Infectious Diseases and Its Applications. Charles Griffin & Company Ltd; 1975.
    1. Diekmann O, Heesterbeek JAP, Metz JA. On the definition and the computation of the basic reproduction ratio r0 in models for infectious diseases in heterogeneous populations. J. Math. Biol. 1990;28:365–382. - PubMed

Publication types