. 2022 Jan 27;9(1):27.
doi: 10.1038/s41597-022-01118-7.

p3k14c, a synthetic global database of archaeological radiocarbon dates

Affiliations

p3k14c, a synthetic global database of archaeological radiocarbon dates

Darcy Bird et al. Sci Data. .

Abstract

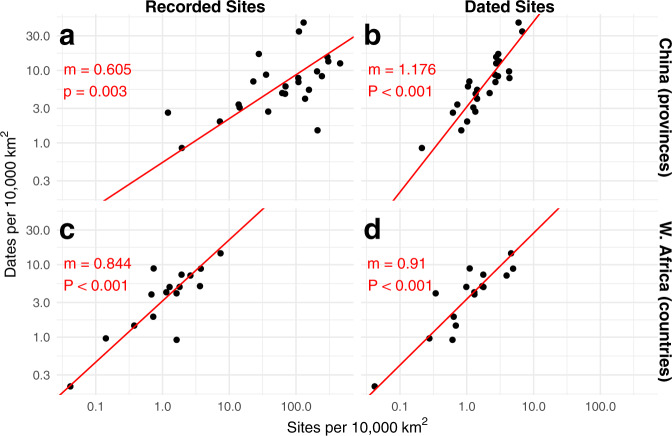
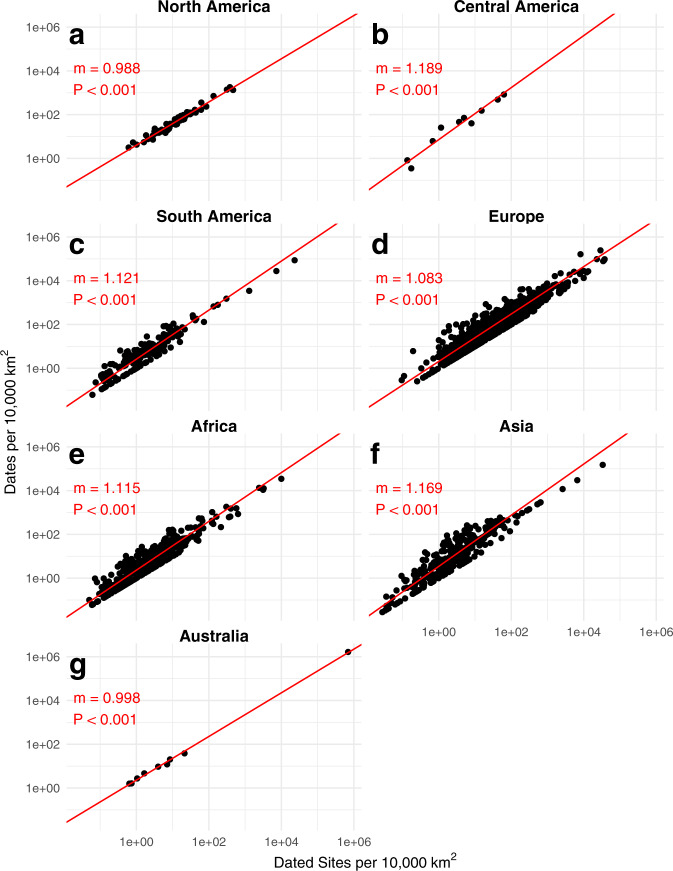
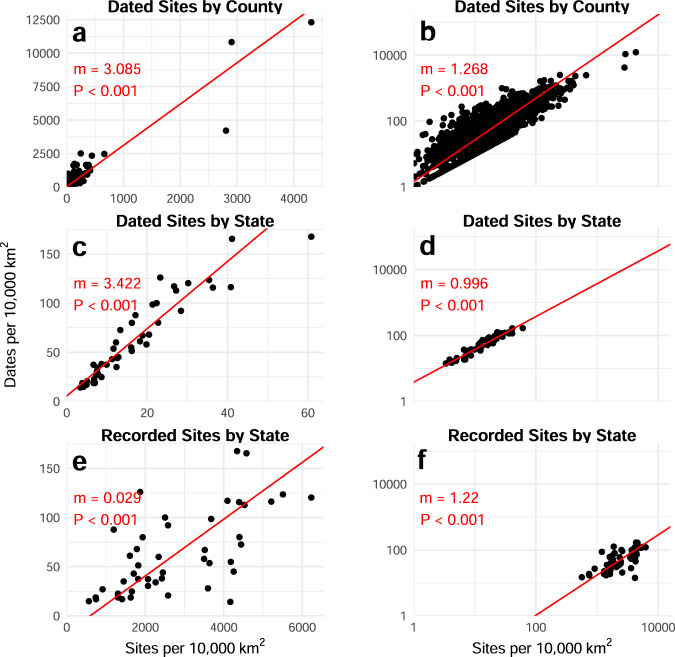
Archaeologists increasingly use large radiocarbon databases to model prehistoric human demography (also termed paleo-demography). Numerous independent projects, funded over the past decade, have assembled such databases from multiple regions of the world. These data provide unprecedented potential for comparative research on human population ecology and the evolution of social-ecological systems across the Earth. However, these databases have been developed using different sample selection criteria, which has resulted in interoperability issues for global-scale, comparative paleo-demographic research and integration with paleoclimate and paleoenvironmental data. We present a synthetic, global-scale archaeological radiocarbon database composed of 180,070 radiocarbon dates that have been cleaned according to a standardized sample selection criteria. This database increases the reusability of archaeological radiocarbon data and streamlines quality control assessments for various types of paleo-demographic research. As part of an assessment of data quality, we conduct two analyses of sampling bias in the global database at multiple scales. This database is ideal for paleo-demographic research focused on dates-as-data, bayesian modeling, or summed probability distribution methodologies.


Conflict of interest statement

The authors declare no competing interests.

Figures

Fig. 1
Fig. 1
Flowchart demonstrating the decision-making process for verifying the location and modifying the LocAccuracy variable accordingly.
Fig. 2
Fig. 2
Flowchart used to locate archaeological sites without locational information. Note this method worked best for famous sites.
Fig. 3
Fig. 3
Global map showing locations of all radiocarbon records after the data cleaning process, color-coded by continent. Individual sites are translucent to illustrate site density.
Fig. 4
Fig. 4
Kernel density estimate highlighting clustering and gaps in different regional/continental records. (a,b) Kernel density estimates for (a) North-Western continental Europe and (B) the Contiguous United States of America. (c,d) Kernel density estimates weighted by the number of 14C dates per site for (c) North-Western continental Europe and (d) for the Contiguous United States of America. (e,f) Risk surface analysis for (e) North-Western continental Europe and for (f) the Contiguous United States of America. North-Western continental Europe shows significant oversampling of dates in Belgium, the Netherlands, and portions of eastern France, and undersampling across much of eastern Germany; the Contiguous United States shows oversampling across the Great Basin, central Rocky Mountain, central Plains, and New England regions, and undersampling across the Northwest and northern California, southern Southwest, Texas, the American Bottom, and southern Florida regions.
Fig. 5
Fig. 5
The density of sites versus dates for China (provinces) and Western Africa (countries). Each plot is log-log transformed. The relationship between the spatial density of recorded archaeological sites and dates across each region is sub-linear, indicating that enhanced recording of archaeological resources does not produce a higher density of dates. China shows a super-linear relationship between the density of dated sites and dates, suggesting over-sampling of dates in provinces with higher densities of dated sites; this relationship in Western Africa remains slightly sub-linear.
Fig. 6
Fig. 6
The density of dated sites versus dates at continental scale. Each point represents an Administrative Level 1 region (state/province) within the continent. Each plot is log-log transformed. North America and Australia demonstrate an effectively linear relationship between dated site density and date density, while Central America, South America, Europe, Africa, and Asia have super-linear relationships such that regions with a higher density of dated sites have an enhanced number of dates for those sites.
Fig. 7
Fig. 7
Focused case study of data in the United States, graphed linearly (left column) or logarithmically (right column). (a,b) Dated sites by county; (c,d) Dated sites by state; (e,f) Recorded Sites by state.

References

    1. Freeman, J., Byers, D. A., Robinson, E. & Kelly, R. L. Culture process and the interpretation of radiocarbon data. Radiocarbon (2018).
    1. Rick JW. Dates as Data: An Examination of the Peruvian Preceramic Radiocarbon Record. Am. Antiq. 1987;52:55–73.
    1. Berry, M. S. Time, Space, and Transition in Anasazi Prehistory. (University of Utah Press, 1982).
    1. Bird, D. et al. A first empirical analysis of population stability in North America using radiocarbon records. Holocene 0959683620919975 (2020).
    1. Freeman J, et al. Synchronization of energy consumption by human societies throughout the Holocene. Proceedings of the National Academy of Sciences. 2018;115:9962–9967. - PMC - PubMed

Publication types