. 2022 Jan 27;6(1):9.
doi: 10.1038/s41698-022-00251-1.

Single-cell analysis of gastric pre-cancerous and cancer lesions reveals cell lineage diversity and intratumoral heterogeneity

Affiliations

Single-cell analysis of gastric pre-cancerous and cancer lesions reveals cell lineage diversity and intratumoral heterogeneity

Jihyun Kim et al. NPJ Precis Oncol. .

Abstract

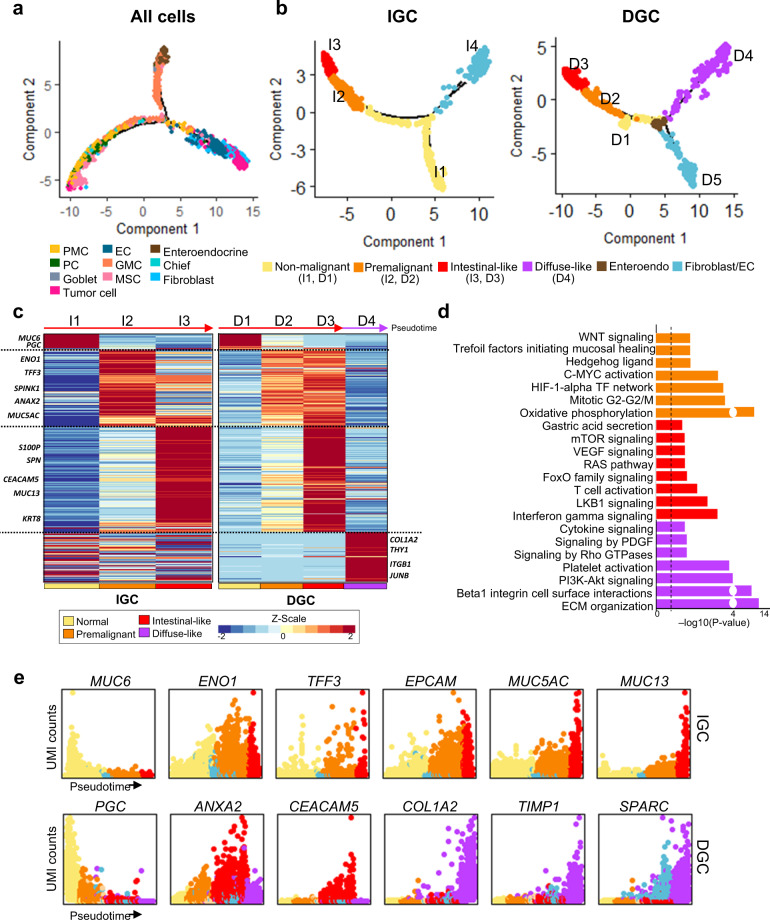
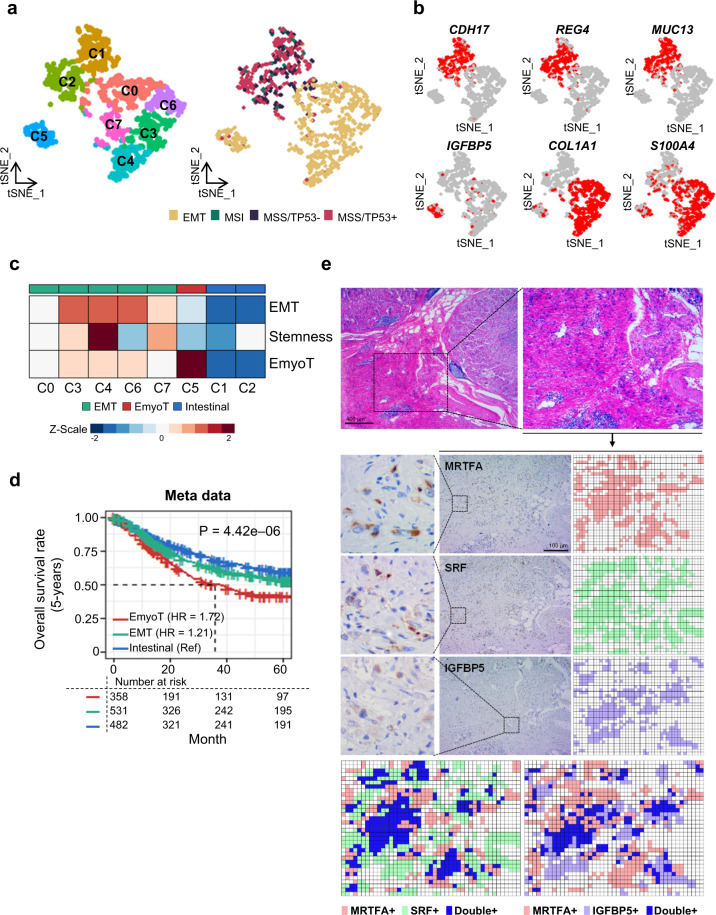
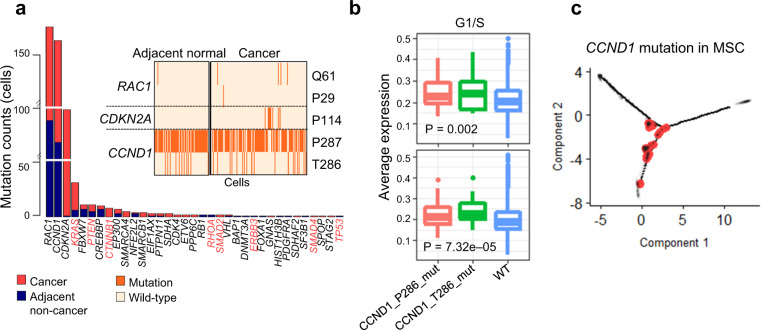
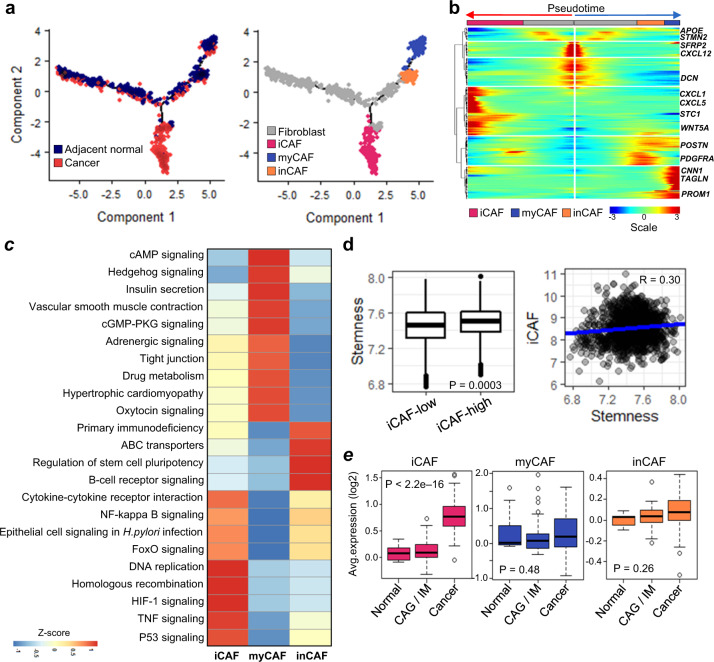
Single-cell transcriptomic profiles analysis has proposed new insights for understanding the behavior of human gastric cancer (GC). GC offers a unique model of intratumoral heterogeneity. However, the specific classes of cells involved in carcinogenetic passage, and the tumor microenvironment of stromal cells was poorly understood. We characterized the heterogeneous cell population of precancerous lesions and gastric cancer at the single-cell resolution by RNA sequencing. We identified 10 gastric cell subtypes and showed the intestinal and diffuse-type cancer were characterized by different cell population. We found that the intestinal and diffuse-type cancer cells have the differential metaplastic cell lineages: intestinal-type cancer cells differentiated along the intestinal metaplasia lineage while diffuse-type cancer cells resemble de novo pathway. We observed an enriched CCND1 mutation in premalignant disease state and discovered cancer-associated fibroblast cells harboring pro-stemness properties. In particular, tumor cells could be categorized into previously proposed molecular subtypes and harbored specific subtype of malignant cell with high expression level of epithelial-myofibroblast transition which was correlated with poor clinical prognosis. In addition to intratumoral heterogeneity, the analysis revealed different cellular lineages were responsible for potential carcinogenetic pathways. Single-cell transcriptomes analysis of gastric pre-cancerous lesions and cancer may provide insights for understanding GC cell behavior, suggesting potential targets for the diagnosis and treatment of GC.


Conflict of interest statement

The authors declare no competing interests.

Figures

Fig. 1
Fig. 1. Single-cell profiling of adjacent normal and gastric cancer tissues.
a Overview of single-cell RNA-seq analysis of the adjacent non-cancer (n = 24) and gastric cancer (GC) tissue (n = 24) from 24 patients. b t-Stochastic neighbor embedding (t-SNE) map of filtered 13,022 single cells in the adjacent non-cancer and cancer tissues. Colors represent cell types based on the expression of known marker genes: endothelial cell (EC), enteroendocrine, fibroblast, gland mucous cell (GMC), intestinal metaplasia (IM), tumor cell, pit mucous cell (PMC). c t-SNE plot showing the expression of marker genes for seven cell types. d t-SNE plot showing sub-clustering of IM cells: chief cells, goblet cells, metaplastic stem-like cells (MSCs), PMC, proliferative cell 1 (PC1), and proliferative cell 2 (PC2). e t-SNE plot showing the expression of marker genes for three cell types. PGC was highly expressed in chief cell (Supplementary Fig. 5b). f Pie charts represent the distribution of ten cell types in the adjacent normal tissue and cancer lesion (left). Bar plots show the frequency of specific cell types in different tissue comparisons (right). Points on the bar plots represent individual samples; P values were calculated by the t test.
Fig. 2
Fig. 2. Tumor cell types determined by pathological classification and functional features.
a Trajectory plot of a total of 13,022 cells. In the trajectory trees, colors represent ten cell types. b Trajectory plots for intestinal gastric cancer (IGC) and diffuse gastric cancer (DGC). Colors represent the malignant process (yellow: non-malignant, orange: premalignant, red: intestinal-like, and purple: diffuse-like) and other cell types (e.g., fibroblasts/ECs and enteroendocrine). The pseudotime increased from the non-malignant (I1 and D1) to the malignant state (I3, D3, and D4), except for fibroblasts and ECs. c Heatmap of differentially expressed genes (DEGs) derived from the malignant process-related states in IGC (I1–I3) and DGC (D1–D3 or D1– D4). Rows of the heatmap show dynamic expression changes of DEGs along the pseudotime, and known marker genes represent both sides in the heatmap. d Bar plots of significant pathways with DEGs enriched in specific cell states (threshold P < 0.05, black dotted line). P values were calculated by a gene enrichment test. Colors represent the malignant process (orange: premalignant, red: intestinal-like, and purple: diffuse-like). e Expression patterns of known marker genes related to the malignant process. The colors correspond to the malignant process states (orange: premalignant, red: intestinal-like, and purple: diffuse-like). The pseudotime is plotted along the x axis, and UMI gene counts are shown on the Y axis.
Fig. 3
Fig. 3. Tumor cell subgroups have distinct clinical outcomes.
a t-Stochastic Neighbor Embedding (t-SNE) plot for the 1003 tumor cells. The left panel is the t-SNE plot for eight sub-clusters of tumor cells. On the right, all tumor cells were classified into four GC subtypes in ACRG. b t-SNE plot showing expression patterns of marker genes. c Functional characterization for eight sub-clusters. Average expression of cancer-associated signatures, including EMT, EmyoT and stemness within eight sub-clusters; the signature pattern shows three molecular subtypes (intestinal: blue, EMT: green, and EmyoT: red). d Five-year survival rates of three molecular subtypes based on bulk RNA metadata (n = 1378). Hazard ratios and p values were calculated by Cox regression; the intestinal group was used as the reference group. e Hematoxylin and eosin (H&E) and immunohistochemistry staining for SRF, IGFBP5, and MRTFA. Digital images constructed of staining results of each marker; overlapped location in digital images are represented at the bottom.
Fig. 4
Fig. 4. Association between CCND1 mutation and the intestinal tumor cell lineage.
a Mutation counts for 35 pan-cancer hotspot genes. Genes denoted in red along the x axis harbor mutations according to a TCGA gastric cancer study. Inset plot represents the cells with mutations in RAC1, CDKN2A, and CCND1 in the adjacent non-cancer tissue and cancer samples. b G1/S gene scores for cells with CCND1 hotspot mutations in premalignant cells (upper) and tumor cells (bottom). P values were calculated by ANOVA. c Cells with mutations in CCND1, especially MSCs, mapped on a trajectory tree of IM and tumor cells. Red dots indicate mutated cells.
Fig. 5
Fig. 5. Cancer-associated fibroblast (CAF) heterogeneity and pro-stemness in gastric cancer.
a Trajectory trees of CAF reconstructed using annotated fibroblasts and endothelial cells. Colors correspond to the malignancy (left) and CAF types (right). b Heatmap plot showing expression of significantly variable genes (P < 1.0e–05; likelihood ratio test) and known CAF markers. Collected cells (columns) are sorted by pseudotime, and the genes (rows) are clustered by hierarchical clustering. c Hallmark pathways of the CAF subtypes determined by enrichment analysis. Significance was determined by the R package limma (adjusted P < 0.05). d Box plot of the stemness score in bulk RNA metadata (left), and correlation between iCAFs and the stemness scores (right). e Boxplots of CAF marker gene expression patterns plotted using bulk RNA data (GSE2669), according to the gastric diseases progression cascade (i.e., normal, premalignant, Intestinal Metaplasia (IM) or chronic atrophic gastritis (CAG), and cancer). P values were calculated by ANOVA.

References

    1. Piazuelo MB, Correa P. Gastric cancer: overview. Colomb. Med. (Cali) 2013;44:192–201. - PMC - PubMed
    1. Correa P. Gastric cancer: two epidemics? Dig. Dis. Sci. 2011;56:1585–1586. - PubMed
    1. Ferlay J, et al. Cancer incidence and mortality worldwide: sources, methods and major patterns in GLOBOCAN 2012. Int. J. Cancer. 2015;136:E359–E386. - PubMed
    1. Uemura N, et al. Helicobacter pylori infection and the development of gastric cancer. N. Engl. J. Med. 2001;345:784–789. - PubMed
    1. Cancer Genome Atlas Research, N. Comprehensive molecular characterization of gastric adenocarcinoma. Nature. 2014;513:202–209. - PMC - PubMed