. 2022 Feb;7(2):262-276.
doi: 10.1038/s41564-021-01050-3. Epub 2022 Jan 27.

Multi-omics analyses of the ulcerative colitis gut microbiome link Bacteroides vulgatus proteases with disease severity

Affiliations

Multi-omics analyses of the ulcerative colitis gut microbiome link Bacteroides vulgatus proteases with disease severity

Robert H Mills et al. Nat Microbiol. 2022 Feb.

Abstract

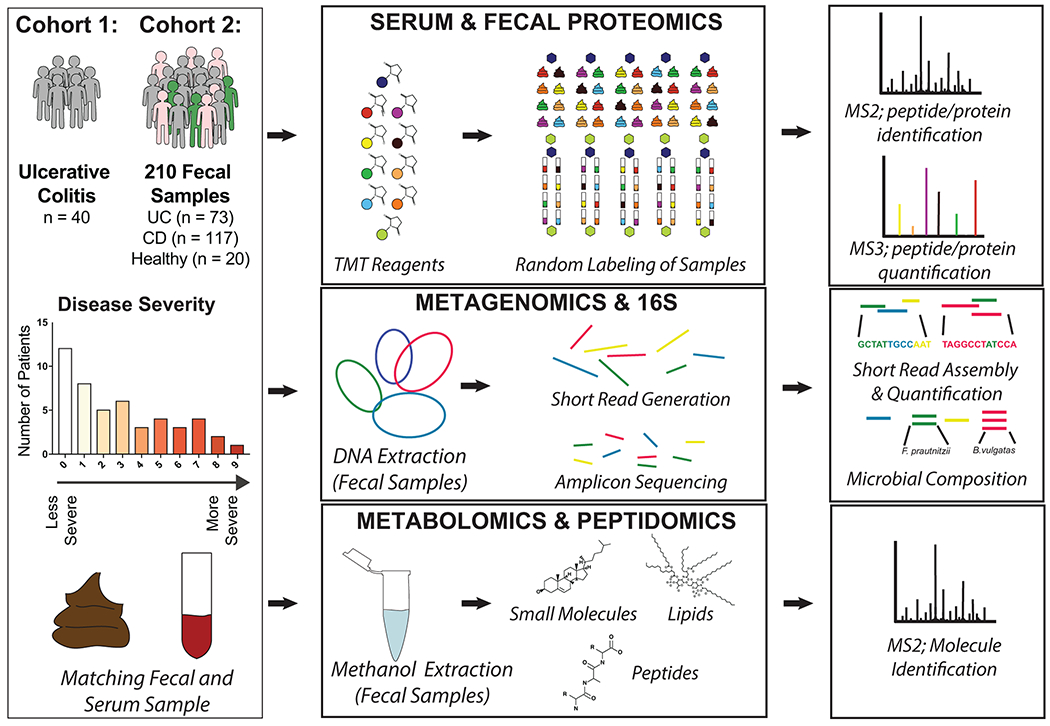
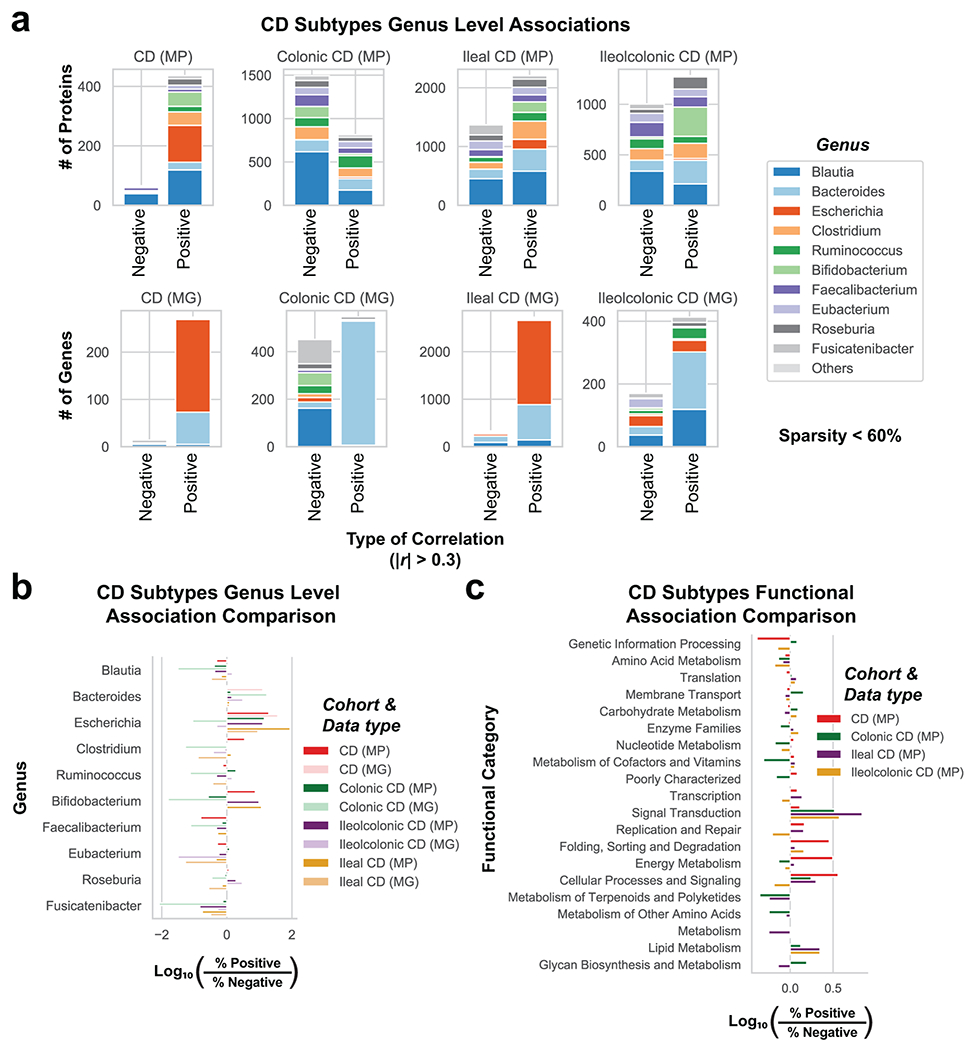
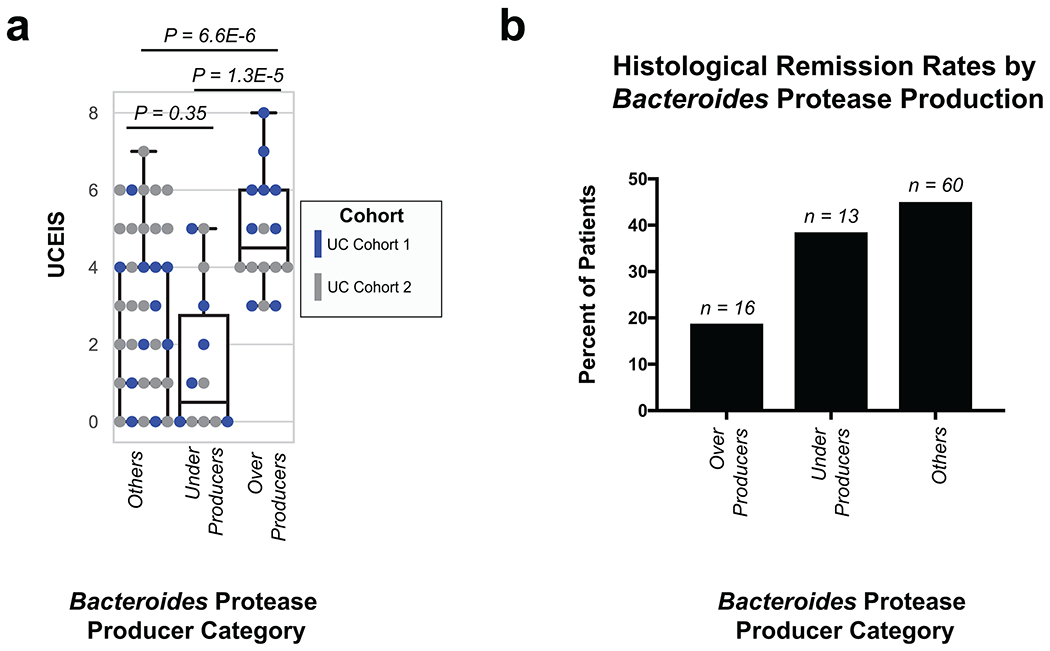
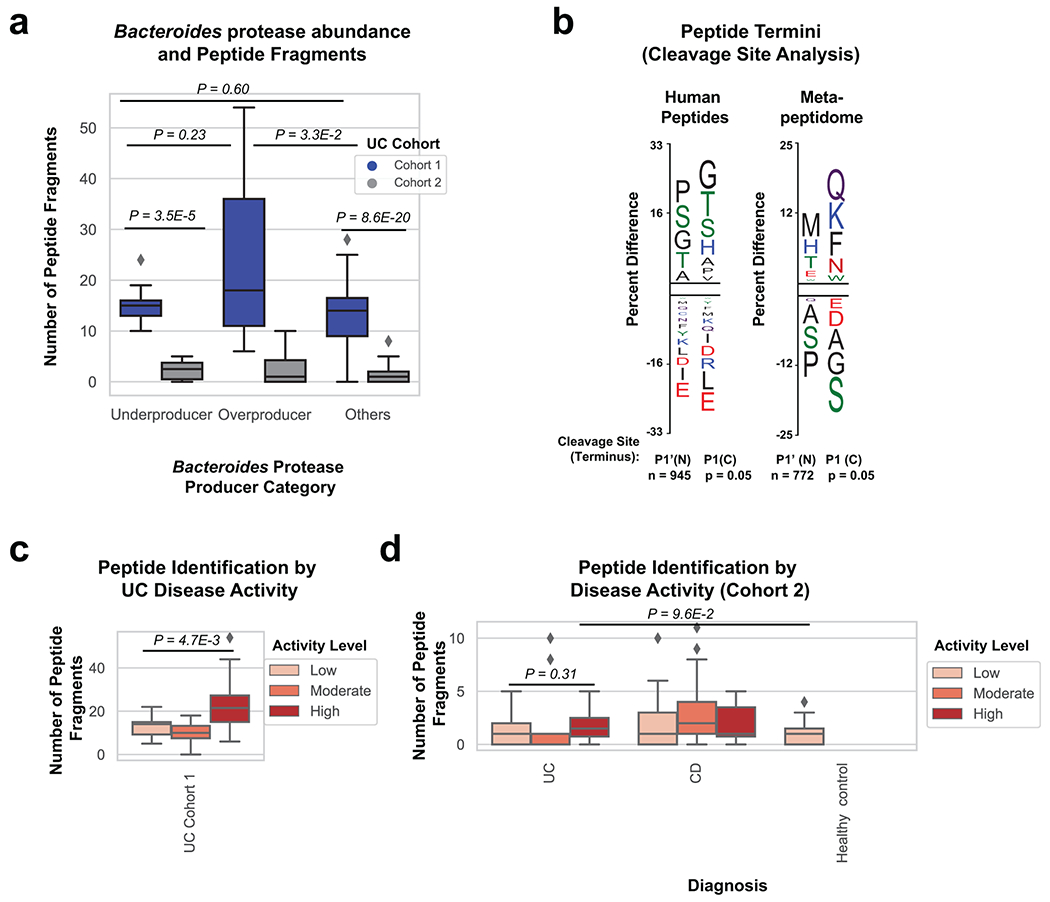
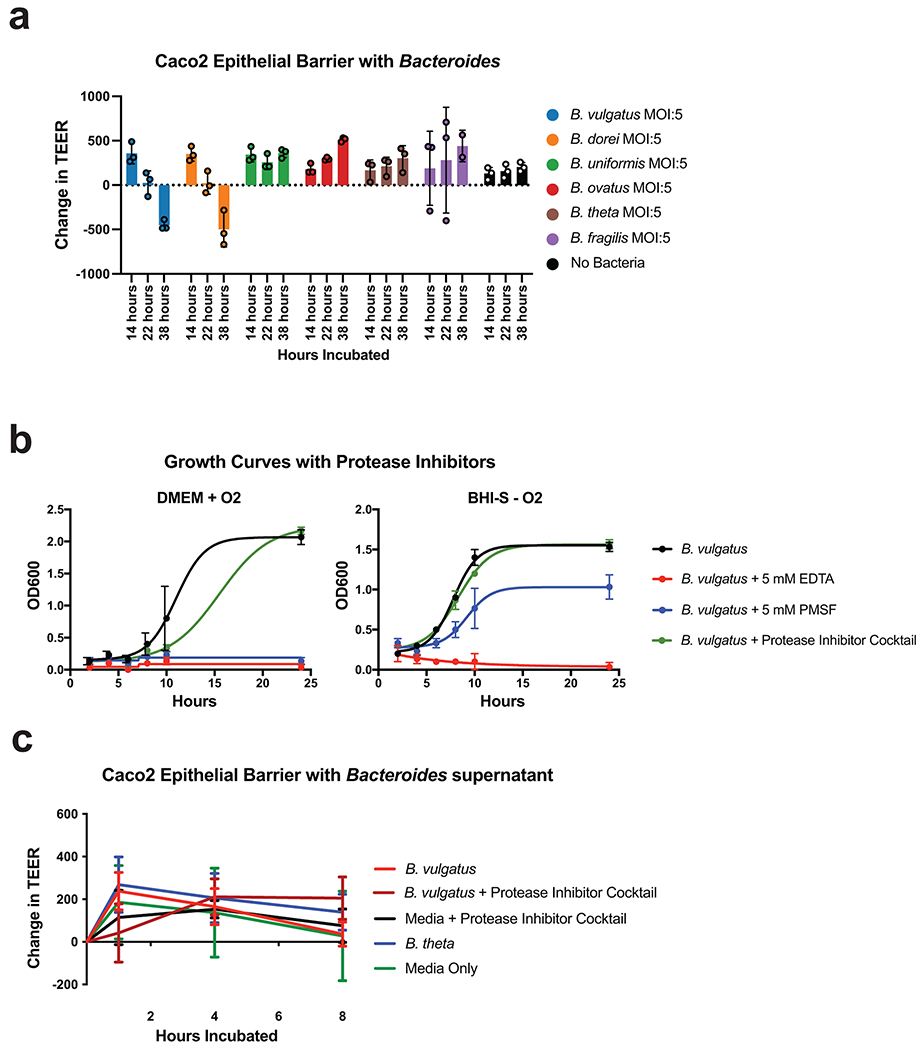
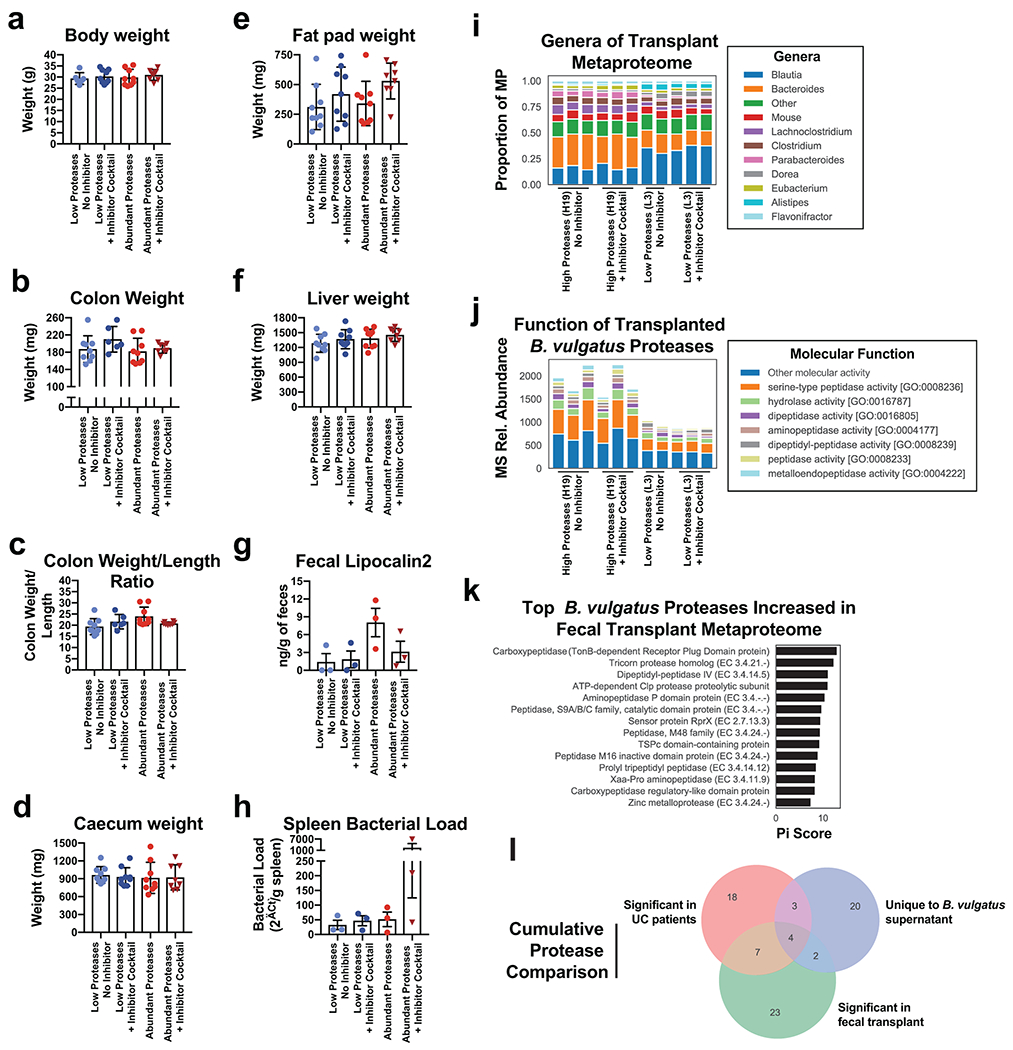
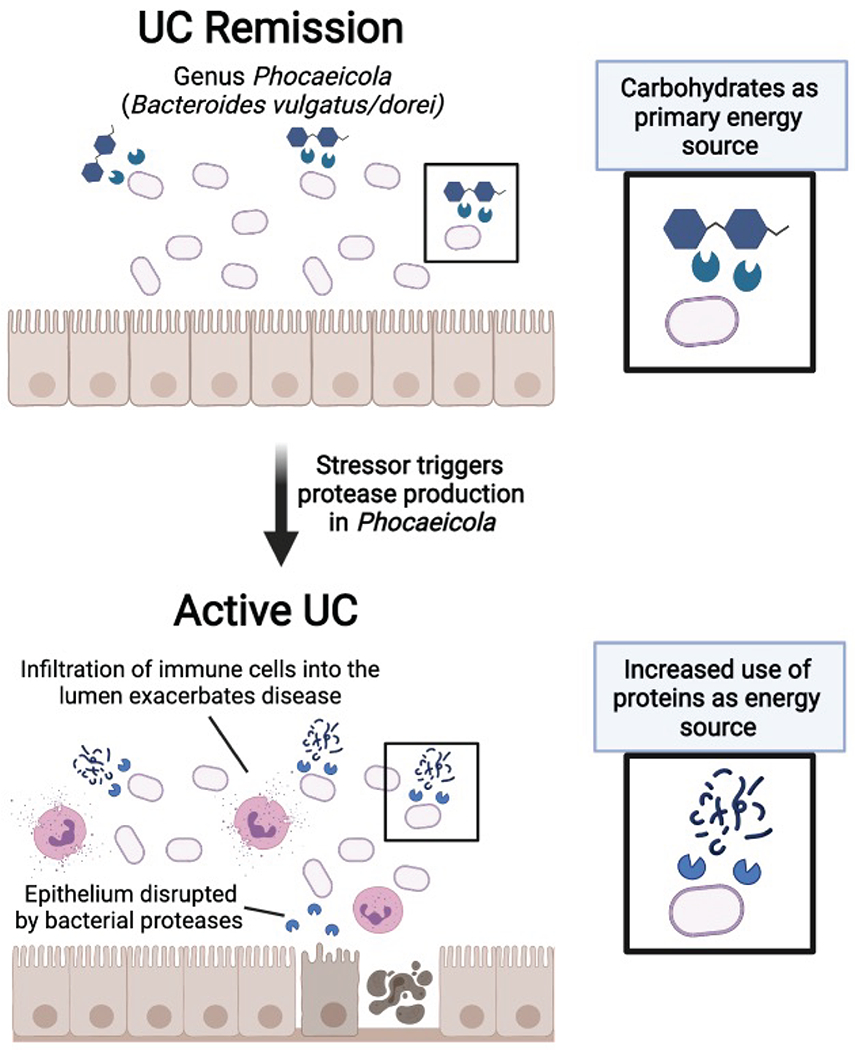
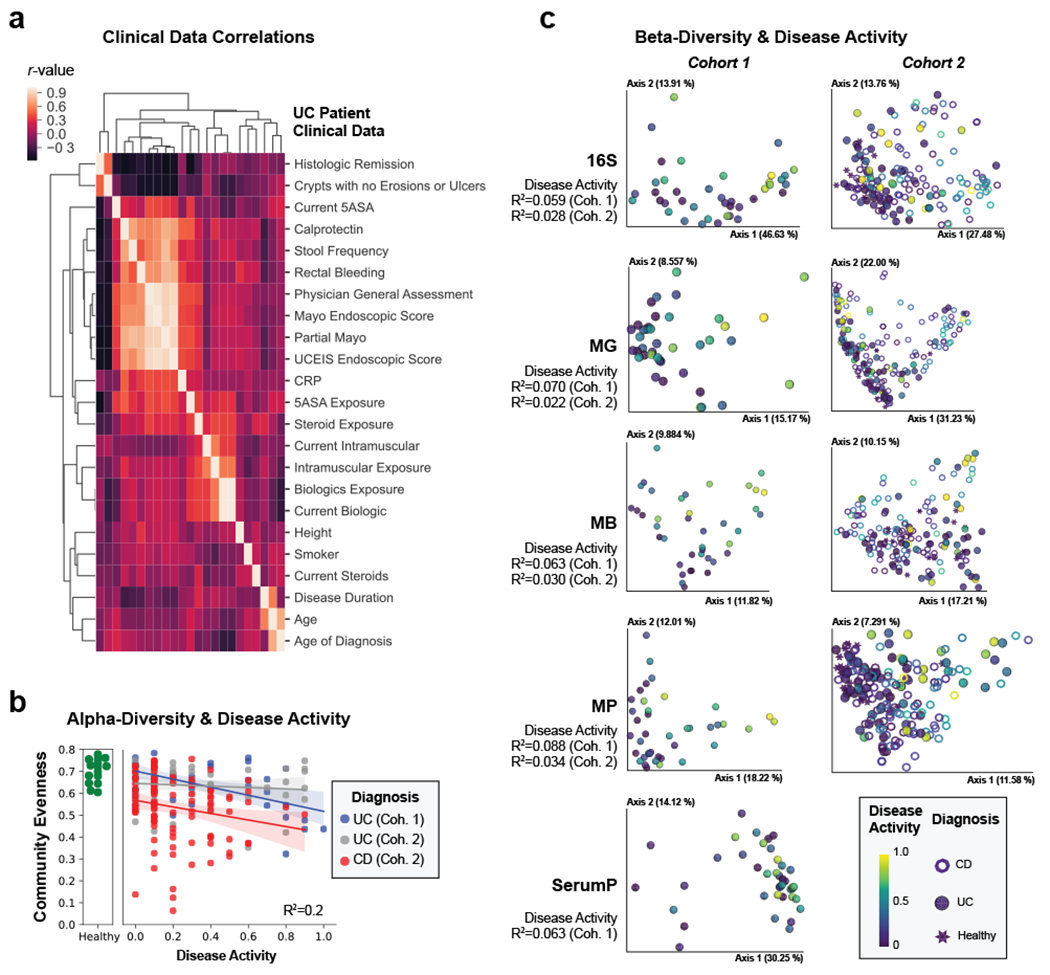
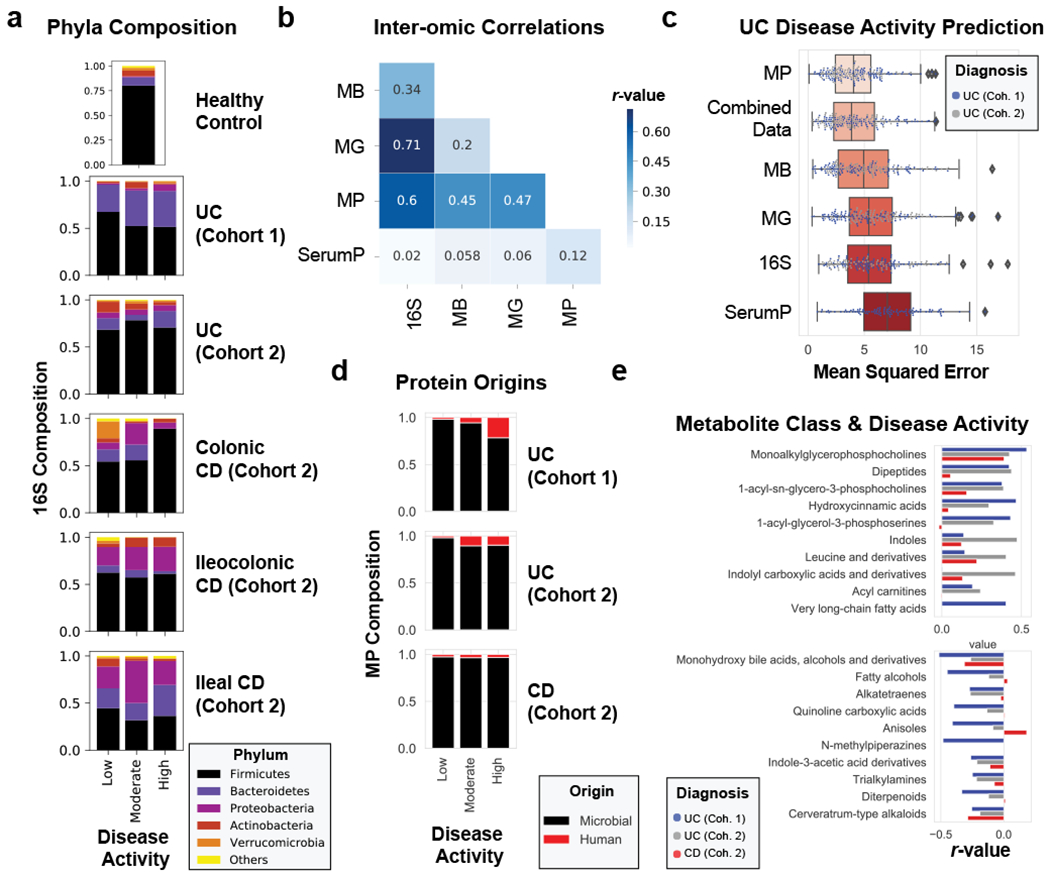
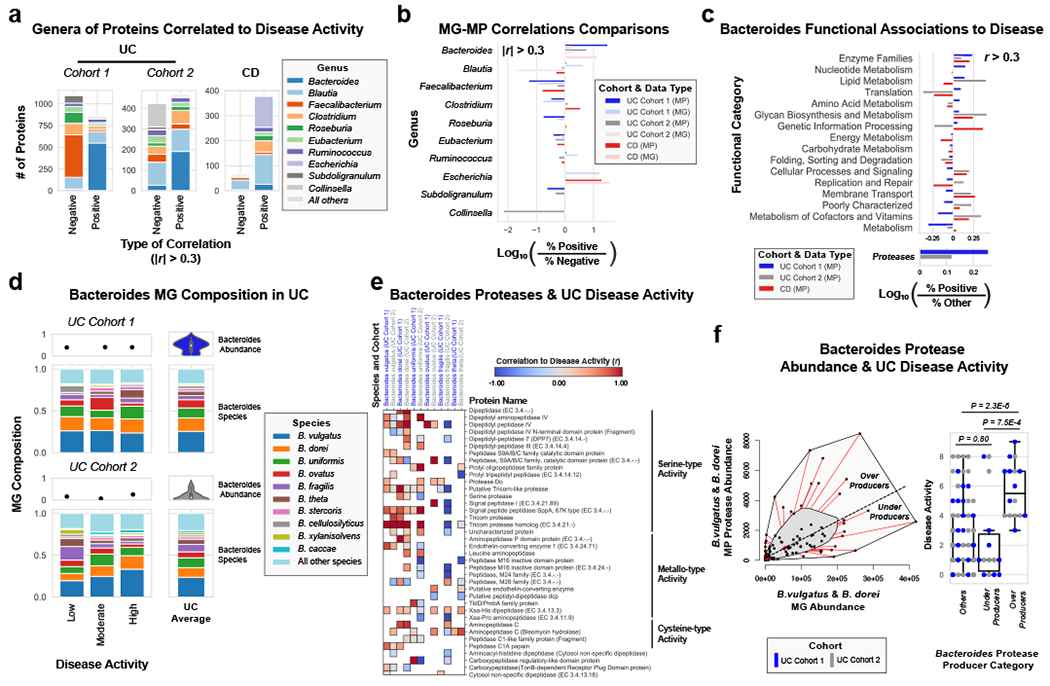
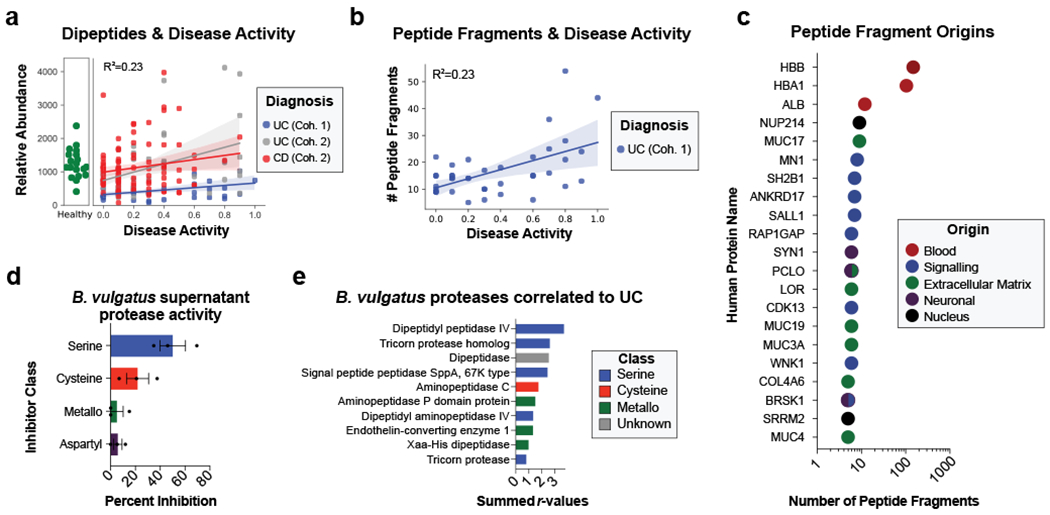
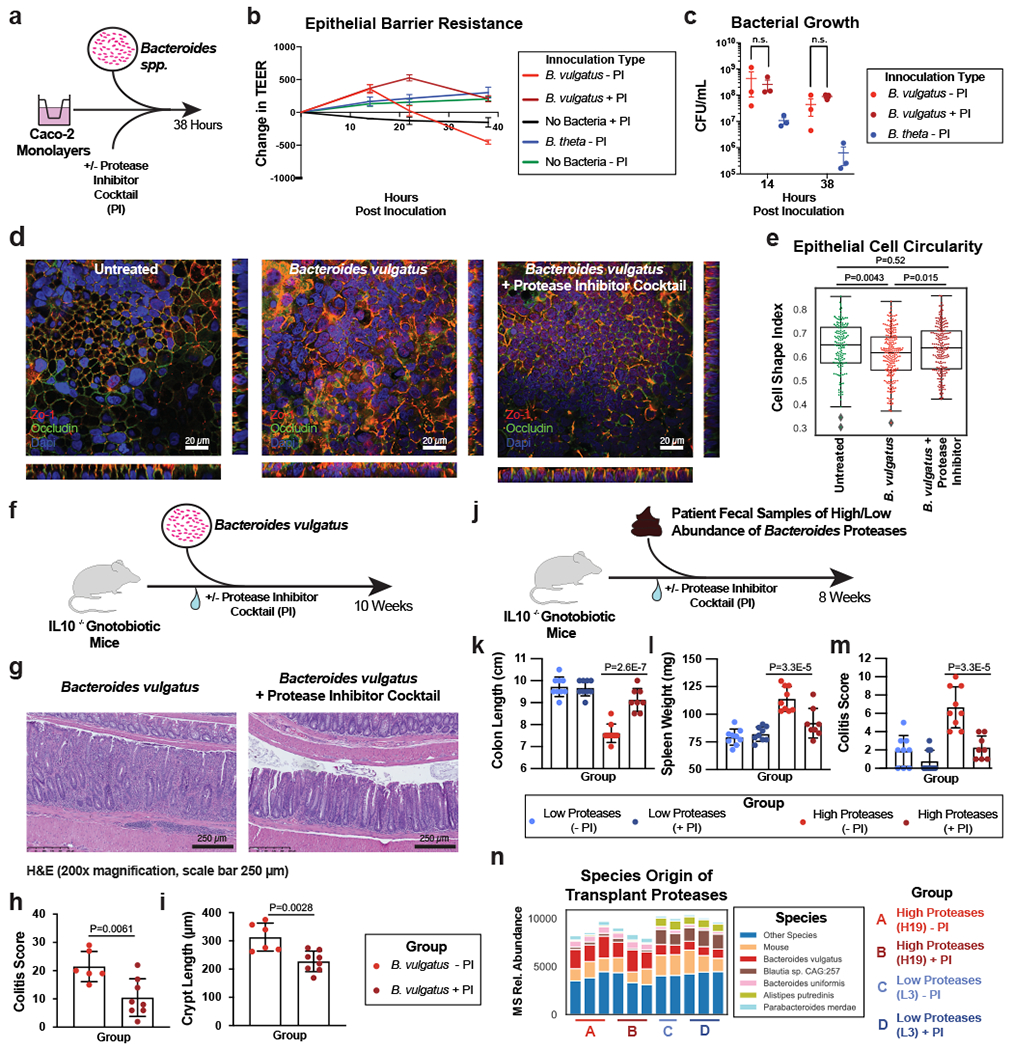
Ulcerative colitis (UC) is driven by disruptions in host-microbiota homoeostasis, but current treatments exclusively target host inflammatory pathways. To understand how host-microbiota interactions become disrupted in UC, we collected and analysed six faecal- or serum-based omic datasets (metaproteomic, metabolomic, metagenomic, metapeptidomic and amplicon sequencing profiles of faecal samples and proteomic profiles of serum samples) from 40 UC patients at a single inflammatory bowel disease centre, as well as various clinical, endoscopic and histologic measures of disease activity. A validation cohort of 210 samples (73 UC, 117 Crohn's disease, 20 healthy controls) was collected and analysed separately and independently. Data integration across both cohorts showed that a subset of the clinically active UC patients had an overabundance of proteases that originated from the bacterium Bacteroides vulgatus. To test whether B. vulgatus proteases contribute to UC disease activity, we first profiled B. vulgatus proteases found in patients and bacterial cultures. Use of a broad-spectrum protease inhibitor improved B. vulgatus-induced barrier dysfunction in vitro, and prevented colitis in B. vulgatus monocolonized, IL10-deficient mice. Furthermore, transplantation of faeces from UC patients with a high abundance of B. vulgatus proteases into germfree mice induced colitis dependent on protease activity. These results, stemming from a multi-omics approach, improve understanding of functional microbiota alterations that drive UC and provide a resource for identifying other pathways that could be inhibited as a strategy to treat this disease.


Conflict of interest statement

Code Availability

The code used in analysis and visualization of data is available at https://github.com/knightlab-analyses/uc-severity-multiomics.

Statistics & Reproducibility

Multi -omic data was collected and analyzed in two independent experiments to increase the likelihood of reproducibility. Sample sizes from each cohort were largely driven by technical and financial constraints as opposed to power analysis, but our sample sizes are similar to those reported in previous publications,,. Several samples were removed after the identification of bacterial blooms or red blood cell contamination as indicated in the metadata. Experiments were randomized during sample processing.

COMPETING INTERESTS

R.H.M., P.S.D and D.J.G. have jointly filed for a patent based on this work (International Application No. PCT/US2020/057784). Over the course of the publication process, R.H.M. started employment at Precidiag Inc., a company which has licensed the patent based on this work. All other authors declare no competing interests.

Figures

Extended Data Fig. 1
Extended Data Fig. 1. Study Design and Database Generation.
Paired fecal and serum samples were collected from 40 patients with varying severity of Ulcerative Colitis. A separately analyzed cohort of fecal samples was also collected on 210 samples with 73 UC, 117 CD and 20 healthy controls. Samples were processed for proteomics using a Tandem Mass Tag multiplexing workflow. Fecal samples were also subjected to both 16S and shotgun metagenomic analyses for microbial composition and gene quantification respectively. In parallel, a metabolomics workflow was performed on fecal samples where collected MS2 spectra were analyzed for both metabolites and peptides in two separate computational pipelines. A custom database was compiled from the metagenome of fecal samples to mediate a comparative analysis between shotgun metagenomic and metaproteomic data sets. This eliminated database dependent bias and the shared reference was used for estimating copy number.
Extended Data Fig. 2
Extended Data Fig. 2. A multiplexing approach improves the depth and sparsity of metaproteomics data.
a, Multiplexed metaproteomic methods increase the total number of proteins quantified. Shown is a bar graph showing the total number of proteins identified when using identical database methodology between the 102 UC samples from the IBD multiomics database, the 40 UC samples from cohort 1 of this study, and the 205 samples from cohort 2 of this study. b, Multiplexed metaproteomic methods improve the number of proteins quantified per sample. Displayed are the mean +/− SD of the proteins identified per sample from studies shown in (a). Data derived from n=102, 40, 205 biologically independent samples as described for (a). One-way ANOVA p-values adjusted for multiple comparisons are shown (P < 0.0001). c, Multiplexed metaproteomic methods decrease the sparsity of metaproteomic studies. The percentage of missing quantification values for proteins in each data set is shown.
Extended Data Fig. 3
Extended Data Fig. 3. Characterizing uneven samples.
a, Alpha diversity (using Pielou’s evenness metric) by disease activity as shown in Figure 1b, but highlighting classification of samples as uneven when below Pielou Evenness of 0.5. Best-fit linear regression lines with 95% confidence intervals are shown and an R2 statistic is reported from an ordinary least-squares regression using the formula (Disease Activity + Diagnosis + Disease Activity:Diagnosis). b, 16S beta-diversity is strongly influenced by community evenness. The weighted UniFrac distance metric was used and each sample was classified by community evenness, diagnosis and whether the most abundant 16S feature was from the family Enterobacteriaceae. c, Characterizing the most abundant 16S features. Each sample was classified as either “Uneven” (Pielou Evenness < 0.5) or “Other” as shown in (a). Abundances of each amplicon sequence variant were summed by their highest resolution taxonomic annotation and the most abundant feature of samples are represented in a donut plot. The inside ring represents the fractional composition of each patient subgroup and the outside rings represents the number of patients within each subgroup whom share a similar most abundant feature. Less common features for each patient subgroup are counted as “Other”.
Extended Data Fig. 4
Extended Data Fig. 4. Comparison of genera annotations from genes and proteins correlated to disease severity.
The genus composition of genes and proteins correlated to disease activity were compared with different levels of sparsity as a requirement for being deemed “correlated”. Stacked bar charts summarize the number of genes or proteins from the 10 most common genus assignments when correlated to either partial Mayo severity in UC cohorts or CDAI in CD patients. Only genes or proteins with |r| > 0.3 from linear regression were included. a, Genus composition of significant positively and negatively correlated genes from the MG with no sparsity requirement. b, Genus composition of significantly positively and negatively correlated proteins from the MP with no sparsity requirement. c, Genus composition of associated proteins as in Fig. 3a, but without removing host proteins (genus Homo). d, Genes correlated to disease activity from the MG when filtering out genes appearing in less than 40% of patients within each category. e, Summary of comparing the portions of positively and negatively correlated genes and proteins from each patient cohort when examining the top 10 genera identified in the MG. This analysis is analogous to Fig. 3b, but displaying the top MG genera.
Extended Data Fig. 5
Extended Data Fig. 5. Comparison of genera and functional annotations from genes and proteins correlated to disease severity in CD subtypes.
a, Genus level barcharts of significantly correlated genes or proteins stratified by CD subtype. The genus composition of genes and proteins from either the MG or MP were correlated to CDAI and shown in stacked bar charts. Only genes or proteins with |r| > 0.3 from linear regression were included, and the top 10 genera are displayed with other genera compiled into an “Others” category. b, CD subtypes genus level association comparison. The portion of genes or proteins correlated with disease activity from (a) are plotted by a Log10 comparison between the proportion of positive to negative correlations. Genes correlated to disease activity from the MG when filtering out genes appearing in less than 40% of patients within each category. c, CD subtypes functional association comparison. This analysis is analogous to (b) but summarizing the associations to KEGG functional category annotations in the MP.
Extended Data Fig. 6
Extended Data Fig. 6. Patients with overproduction of Bacteroides vulgatus proteases have increased endoscopic and histological severity.
a, Bacteroides protease production corresponds to increased endoscopic severity. The disease activity of overproducers, underproducers, and other patients are individually plotted over boxplots. Two-tailed, t-test p-values are displayed above the boxplots. Sample sizes include n=16, 14 and 71 for overproducers, underproducers and others respectively. Boxplots are defined by the median, quartiles and 1.5x inter-quartile range. b, Bacteroides protease production corresponds to a patient population with a decreased proportion of patients in histological remission. Each UC patient sample was categorized by Bacteroides vulgatus protease production category and the percent of patients in histological remission is shown in a bargraph with the number of samples in each category displayed above each bar. Histological remission is defined here as Geboes Grade 3 = 0.
Extended Data Fig. 7
Extended Data Fig. 7. Peptide fragments are increased in active UC patients and Bacteroides protease enriched patients.
a, Comparison of peptide fragments identified in patients with varying abundance of Bacteroides proteases. Overproducers from UC cohort 1 had increased peptide fragments in comparison to other patients (Two-tailed t-test P=3.5E-2). Data was derived from n=8, 9, 23 UC cohort 1 samples and n=6, 6, 49 UC cohort 2 samples from patients classified as underproducer, overproducer and other respectively. b, Peptide termini indicate unique proteolysis of human and microbial proteins. The frequency of each amino acid within the N and C terminus of human and de-novo peptides was compared to either the human proteome or the total amino acid content of de novo peptides. The Y-axis represents the percent difference of each residue and the letter indicates the amino acid associated with the difference. The N and C terminus are shown separately and each residue is colored by chemical property (Green = polar, Black = Hydrophobic, Red = Acidic, Blue = Basic, Purple = Neutral). c, Peptide fragment identification comparison by disease activity in UC cohort 1. Boxplots with a two-tailed t-test p-value is shown (P=4.7E-3). Data was derived from n=18, 12, 10 patient samples with low moderate or high disease activity respectively. d, Peptide fragment identification comparison by disease and disease activity state for cohort 2 samples. Boxplots are shown with overlaid two-tailed t-test p-values. Data was derived from n=19 healthy controls, n=39, 30, 12 UC samples, and n=64, 30, 8 CD samples from patients of low, moderate and high activity respectively. Boxplots in (a,c,d) are defined by the median, quartiles and 1.5x inter-quartile range.
Extended Data Fig. 8
Extended Data Fig. 8. Determining the impact of Bacteroides species on TEER using co-culture, supernatants and protease inhibitors.
a, Bacteroides vulgatus and Bacteroides dorei, but not other Bacteroides species disrupt Caco-2 epithelial barriers. Barplots are showing the mean and standard deviation of the change in TEER at different time points. Data was derived from n=3 independent cultures collected over n=2 independent experiments. b, Growth curves of Bacteroides vulgatus with protease inhibitors under different growth conditions. OD600 was measured at indicated time points and a non-linear fit is shown. Data was derived from n=3 independent cultures collected over n=1 independent experiments. c, Supernatants from Bacteroides in mid-log phase growth do not significantly impact TEER. B. vulgatus and B. theta were grown to mid-log phase, and their supernatants were concentrated and added to Caco-2 monolayers. TEER was measured at the initial time-point and compared to TEER measured after 1, 4, and 8 hours of incubation. Plotted are the mean and SEM from n=3 independent experiments each representing the mean of n=3 independent wells/experiment (n=4 wells/experiment for B. vulgatus group). No significant differences were found at any timepoint.
Extended Data Fig. 9
Extended Data Fig. 9. Additional measurements from fecal transplant experiments.
a-f Barplots showing the mean +/− SD of macroscopic organ measurements from fecal transplant of UC patients samples in IL10−/− mice with or without administration of a protease inhibitor. Dots represent one mouse, with each group representing results from 3 UC patient fecal samples with each sample given to 3 co-housed mice. Measurements include final weight of the mice (a), colon weight (b), ratios of the colon weight to length (c), caecum weight (d), fat pad weight (e), liver weight (f). g-h Barplots showing the mean +/− SEM for the concentration of an intestinal inflammatory marker, fecal lipocalin2 (g), and amount of 16S rRNA in the spleen of mice for an estimate of the splenic bacterial load (h). Each dot in g-h represents the mean of n=3 mice transplanted with the same UC fecal sample (with the exception of a mean from n=2 mice for one patient sample in the Abundant Proteases + Inhibitor Cocktail group) from n=2 independent experiments. i, Metaproteome genera composition of mice transplanted with UC fecal samples. Fecal samples taken at 8-weeks from mice transplanted with one high protease containing sample (H19) and one control patient sample (L3) were analyzed by mass spectrometry based metaproteomics. Stacked barplots are shown for each mouse displaying the proportion of protein signal derived from the most common genera. j, Molecular function of B. vulgatus proteases identified in mice receiving UC fecal samples. The relative abundance of each B. vulgatus protease is shown in stacked barplots grouped by the Gene Ontology molecular function associated with each protein. k, Top B. vulgatus or B. dorei proteases associated with the fecal samples of mice receiving the H19 sample. Each protein is ranked by pi-score, which combines two-sided t-test p-values and the fold-change difference between all H19 and L3 samples. l, Cumulative protease comparisons. A venndiagram is shown comparing the protein names of B. vulgatus or B. dorei proteases from four independent proteomics experiments performed in this study. A full list of the Bacteroides proteases identified in this analysis can be found in Supplementary Table 4.
Extended Data Fig. 10
Extended Data Fig. 10. Working hypothesis
The results of our study may indicate that certain species from the genus Bacteroides, particularly those recently reclassified under the genus Phocaeicola (e.g. Bacteroides vulgatus & Bacteroides dorei), may be implicated in the transition from remission to active disease in UC. We hypothesize that a stressor in the UC gut such as nutrient deprivation or cell-to-cell competition may increase protease production, and a switch in the utilization of carbohydrates to proteins as a nutrient source. Some of these proteases may be involved in the disruption of the epithelial barrier, allowing an influx of innate immune cells which further exacerbate disease.
Figure 1.
Figure 1.. Multi-omic diversity correlates with IBD disease activity.
a, Heatmap of the correlation between clinical data. Hierarchical clustering was performed on spearman correlation values between each clinical metric for UC patients identifying groups of closely related clinical measurements. Each metric is represented in the same order on x- and y-axes and only y-axis labels are shown. b, Alpha-diversity decreases with active IBD. Pielou evenness based on 16S data is plotted for each patient with linear regression best-fit lines and 95% confidence intervals per patient group. An R2 value is indicated based on the disease activity, diagnosis and their interaction. c, Beta-diversity correlates with active IBD. Each collected -omic dataset is displayed by a principal coordinate analysis showing the first two axes. Each sample is colored by the disease activity state and has a shape corresponding to diagnosis. Adonis R2 values are shown to demonstrate the effect size of disease activity when accounting for disease activity, diagnosis and their interaction. Distance matrices best separating disease activity are displayed. Distance matrices shown are weighted UniFrac for each dataset other than proteomic datasets, which use the Bray-Curtis distance metric, and the metagenome of UC cohort 1 which uses unweighted UniFrac.
Figure 2.
Figure 2.. Multi-omic analysis of IBD disease activity.
a, 16S phyla composition by disease activity states. The average phyla compositions of groups of patient samples are shown in bar plots. Barplots represent sample sizes of n=18, 12, 10 for UC Cohort 1; n=34, 9, 13 for UC Cohort 2; n=19, 8, 1 for Colonic CD; n=22, 7, 3 for Ileocolonic CD; n=19, 4, 2 for Ileal CD (each ordered low, moderate, high activity respectively); n=15 samples for healthy controls. b, Data type correlations. Pearson correlations between data types are displayed in a heat map. The Bray-Curtis distance metric was used for all data types and correlations were performed on distance matrices through Mantel’s test. c, Evaluating meta –omic performance in predicting UC disease activity. The mean squared error from n=100 iterations of random forest analyses on each UC cohort trained to predict the partial Mayo disease activity (ranging from 0-9) are displayed in boxplots ordered from the strongest predictive capability (metaproteome) to the least predictive capability (serum proteome). d, Metaproteome composition by disease activity states. The relative abundances of human and microbial proteins were averaged by disease activity states and plotted by different patient categories. Barplots represent sample sizes of n=18, 12, 10 for UC Cohort 1; n=38, 11, 14 for UC Cohort 2; n=66, 31, 9 for CD (each ordered low, moderate, high activity respectively). e, Top metabolite classes correlated with UC disease activity. Metabolite abundances summed by chemical class were averaged and linear regressions were performed to disease activity. The r-values of the top 10 positively and negatively correlated classes of chemicals are plotted by diagnosis and cohort, and displayed in order of the summed r-values from UC cohorts. Boxplots in (c) are defined by the median, quartiles and 1.5x inter-quartile range.
Figure 3.
Figure 3.. Integrated metagenomic-metaproteomic analyses reveal Bacteroides proteases distinguishing a subset of active UC patients.
a, Taxonomic biases among proteins correlated to disease activity. Linear regressions against disease activity were performed for each protein quantified and the taxonomic origins of all highly associated proteins (Pearson’s r > 0.3 or r < −0.3) are plotted per patient cohort. b, Comparison of biases in the taxonomic origins of highly associated microbial open-reading frames at the MG or MP level. Linear regressions were performed as in (a), and the percent representation of taxa in positive correlations (r > 0.3) and negative correlations (r < −0.3) are plotted by Log10 transformation. c, Functional shifts in Bacteroides during active IBD. The Bacteroides proteins associated with disease activity (r > 0.3) from (a) were compared to remaining identified Bacteroides proteins to identify putative functional shifts related to UC disease activity. d, Species-level investigation of Bacteroides in MG of UC patients. Bacteroides species composition plots are shown for categories of UC disease activity, as well as the average within each cohort. Above each composition plot are dot plots indicating the average abundance of Bacteroides reads in the MG, or a violin plot showing the kernel density estimate of the general distribution in the UC cohort. Data was compiled from sample sizes of n=18, 12, 10 for UC Cohort 1 and n=38, 13, 13 for UC Cohort 2 (each ordered low, moderate, high activity respectively). e, Correlation of Bacteroides proteases and enzymes to UC disease activity. The species level annotation of proteases identified in different Bacteroides species was compared in a heatmap showing the correlations of each enzyme to UC activity per species. f, Patients with Bacteroides protease overproduction correlates with increased disease activity. An outlier approach comparing B. vulgatus and B. dorei metagenomic abundance to the summed protein abundances from B. vulgatus and B. dorei proteases was taken to identify groups of UC patients with higher or lower than metagenomically expected protease presence. A bagplot is shown with a best-fit line and over or under-producer status was determined by outlier status above or below the best-fit line. The disease activity of overproducers, underproducers, and other UC patients are individually plotted over boxplots. Two-tailed, t-test p-values are displayed above the boxplots. Sample sizes include n=16, 14 and 77 for Over Producers, Under Producers and Others respectively. Boxplots are defined by the median, quartiles and 1.5x inter-quartile range.
Figure 4.
Figure 4.. Assessing proteolysis in UC patients and Bacteroides supernatant.
a, Abundances of dipeptides increases with disease activity. The average relative abundance of metabolomic features annotated as dipeptides per sample is plotted according to disease activity with linear regression best-fit lines and 95% confidence intervals shown per patient cohort. b, Peptide fragments are more abundant during active UC. The number of peptides identified through a de-novo peptidomic workflow is plotted alongside UC disease activity. The linear regression best-fit line with a 95% confidence interval is shown for UC cohort 1. c, The number of peptide fragments from human proteins indicates potential targets of UC proteolysis. The gene symbol for the human proteins with the most number of short peptides present are shown on the y-axis and the quantity of peptides is shown on a log10 transformed x-axis. The proteins are colored by common categories of the observed proteins. d, Class of protease activity in B. vulgatus supernatant. Concentrated supernatant from overnight cultures of B. vulgatus was subjected to a protease activity assay in the presence of different classes of protease inhibitors. Vehicle controls were used to determine the percent inhibition from each inhibitor and the mean +/− SEM from n=11 wells per-condition from n=3 independent experiments are displayed. Protease inhibitors included 10 mM AEBSF (Serine), 100 μM E-64 (Cysteine), 2.5 mM GM6001 (Metallo) and 180 μM Pepstatin A (Aspartyl). e, Ranking of B. vulgatus proteases by summed correlations to UC disease activity. The correlation values (r) between UC disease activity and B. vulgatus and B. dorei proteases were summed. The sums from the top-10 ranked proteases are shown with the colors of each bar representing protease class.
Figure 5.
Figure 5.. Protease inhibition protects from Bacteroides vulgatus and fecal transplant induced pathology in vitro and in vivo.
a, Schematic describing the in vitro studies using Caco-2 cell monolayers and Bacteroides spp. b, Protease inhibition significantly restores the Caco-2 epithelial barrier when co-cultured with B. vulgatus. A timeseries of the change in transepithelial electrical resistance (TEER) is plotted with the mean and standard error of the mean (SEM). c, Protease inhibitor cocktail does not significantly influence the number of CFUs during Caco-2 co-culturing with B. vulgatus. Plotted are the mean CFUs +/− SEM from each independent experiment. Two-way ANOVA adjusted for multiple comparisons performed at 14 hours (P=0.69) and 38 hours (P=0.97). Data from (b, c) derived from n=3 independent experiments containing n=3 biological replicates per condition. d, Representative images from confocal microscopy of the transwell experiments. A representative image from untreated, B. vulgatus, and B. vulgatus with a protease inhibitor cocktail are shown. Immunofluorescence of tight junction proteins, Zo-1 and Occludin along with dapi are shown. Below and to the right of each image are the XZ and YZ slices. Scale bars are 20 μm. e, Quantification of cell circularity in the images from panel d. Two-tailed t-test p-values are shown between groups. Statistics were derived from n=151, 221, 198 untreated, B. vulgatus - PI and B. vulgatus + PI cells examined over 1 independent experiment. Boxplots are defined by the median, quartiles and 1.5x inter-quartile range. f, Experimental design of monocolonized IL10−/− mouse study. Mice were inoculated with B. vulgatus. During 10-weeks of colonization, a protease inhibitor cocktail was continuously administered through the drinking water of B. vulgatus mice. g, Representative H&E-stained colon sections of monocolonized mice with a 250 μm scale bar for scale. h, Colitis scores from histological assessment of monocolonized mice. Between group two-tailed t-test P=0.0061. i, Crypt lengths of monocolonized mice. Between group two-tailed t-test P=0.0028. Data from h-j displayed as barplots with mean values +/− SD from n=6 animals for B. vulgatus - PI and n=8 B. vulgatus + PI groups conducted in n=2 independent experiments. j, Experimental design of humanized IL10−/− mouse study. A total of n=9 animals per group (with the exception of n=8 mice for High Proteases + PI group) representing n=3 UC patient samples per group were examined over 2 independent experiments. k-m Protease inhibition improves colitis measurements induced by UC stool. Barplots showing the mean +/− SD are shown with overlaid p-values from one-way ANOVA adjusted for multiple comparisons between groups are for colon length (P=2.6E-7) (k), spleen weight (P=3.3E-5) (l) and histopathological scoring of colonic sections (P=3.3E-5) (m). n, Species representation of proteases in the fecal metaproteome of humanized mice. The fecal samples from one group of humanized mice with abundant Bacteroides proteases and one group without abundant proteases was subjected to LC-MS3 based metaproteomics. The relative abundance from identified proteases is shown based on the species annotation of each protease.

References

    1. Fumery M et al. Natural History of Adult Ulcerative Colitis in Population-based Cohorts: A Systematic Review. Clin Gastroenterol Hepatol 16, 343–356 e343, doi:10.1016/j.cgh.2017.06.016 (2018). - DOI - PMC - PubMed
    1. Dulai PS, Siegel CA, Colombel JF, Sandborn WJ & Peyrin-Biroulet L Systematic review: Monotherapy with antitumour necrosis factor alpha agents versus combination therapy with an immunosuppressive for IBD. Gut 63, 1843–1853, doi:10.1136/gutjnl-2014-307126 (2014). - DOI - PubMed
    1. Sartor RB & Wu GD Roles for Intestinal Bacteria, Viruses, and Fungi in Pathogenesis of Inflammatory Bowel Diseases and Therapeutic Approaches. Gastroenterology 152, 327–339 e324, doi:10.1053/j.gastro.2016.10.012 (2017). - DOI - PMC - PubMed
    1. Schirmer M et al. Compositional and Temporal Changes in the Gut Microbiome of Pediatric Ulcerative Colitis Patients Are Linked to Disease Course. Cell Host Microbe 24, 600–610 e604, doi:10.1016/j.chom.2018.09.009 (2018). - DOI - PMC - PubMed
    1. Shen ZH et al. Relationship between intestinal microbiota and ulcerative colitis: Mechanisms and clinical application of probiotics and fecal microbiota transplantation. World J Gastroentero 24, 5–14, doi:10.3748/wjg.v24.i1.5 (2018). - DOI - PMC - PubMed

Publication types

MeSH terms

Supplementary concepts