. 2022 Feb;23(2):330-340.
doi: 10.1038/s41590-021-01101-1. Epub 2022 Jan 27.

Intravital three-photon microscopy allows visualization over the entire depth of mouse lymph nodes

Affiliations

Intravital three-photon microscopy allows visualization over the entire depth of mouse lymph nodes

Kibaek Choe et al. Nat Immunol. 2022 Feb.

Abstract

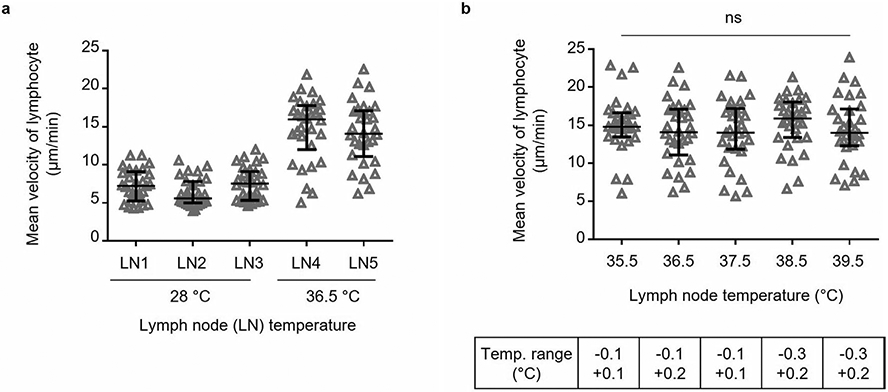
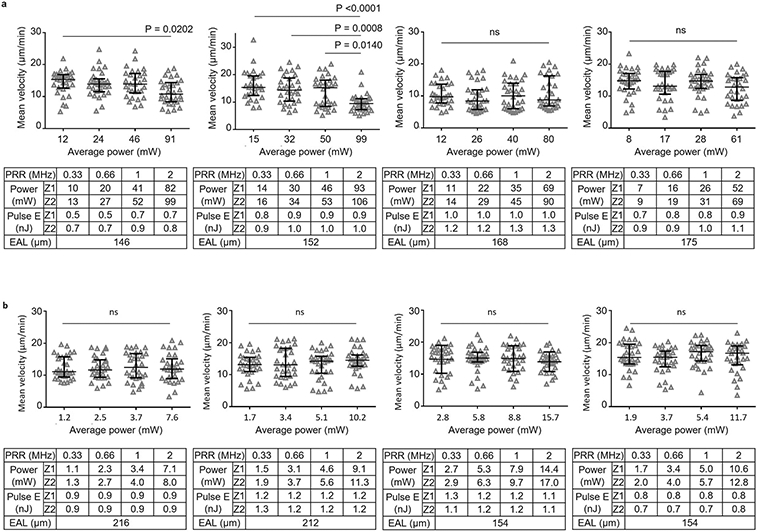
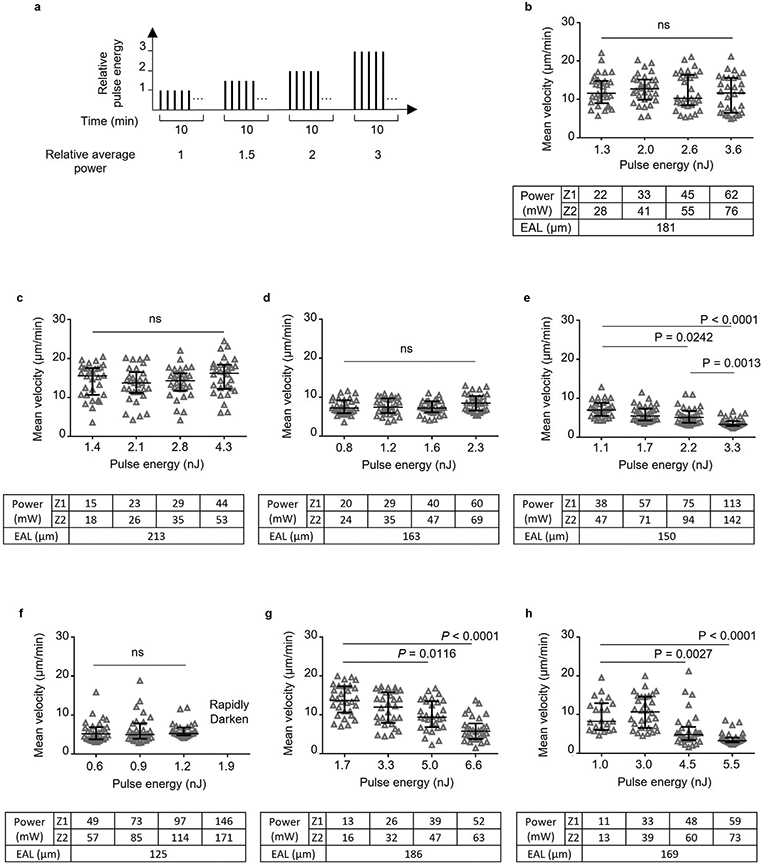
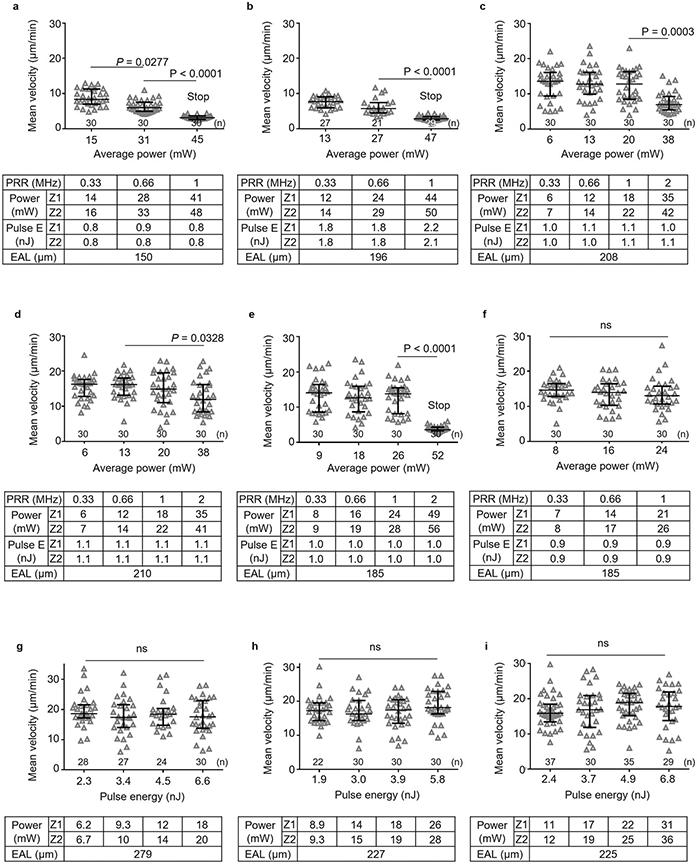
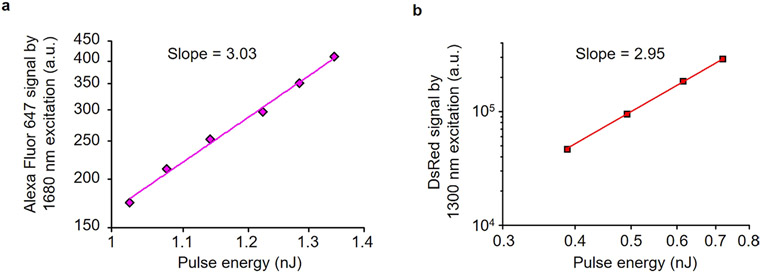
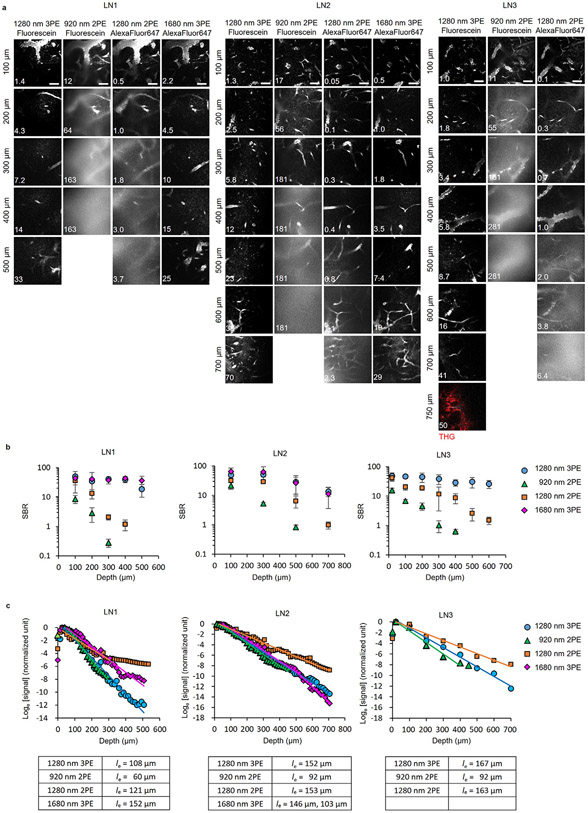
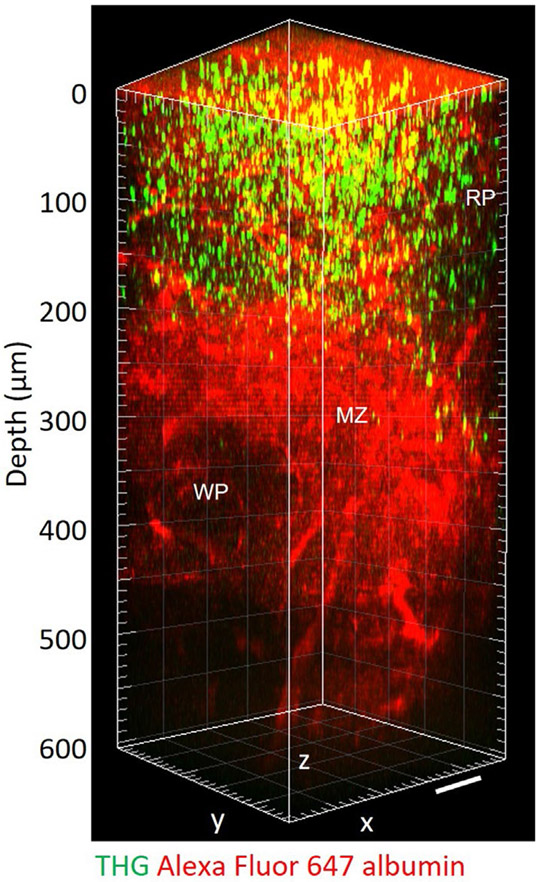
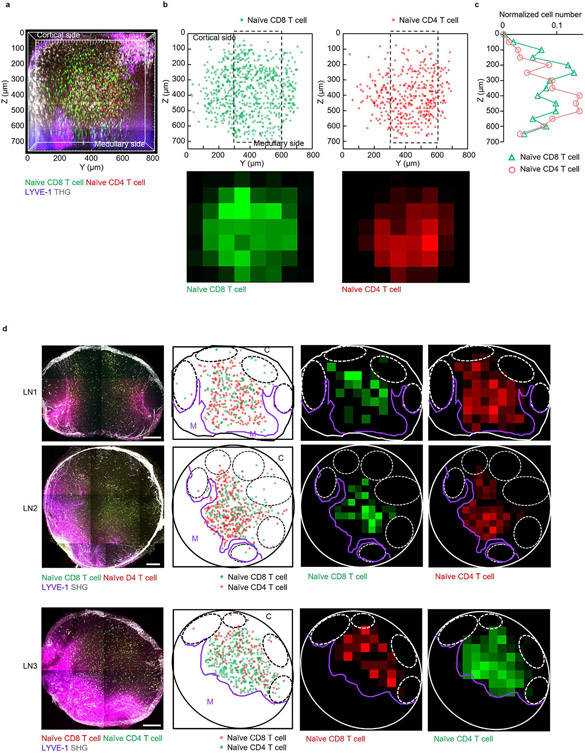
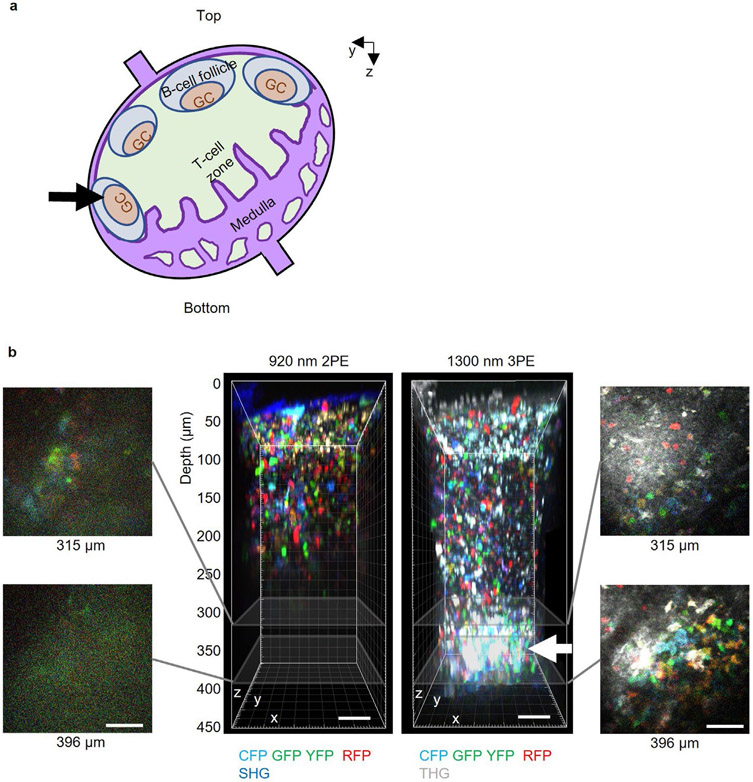
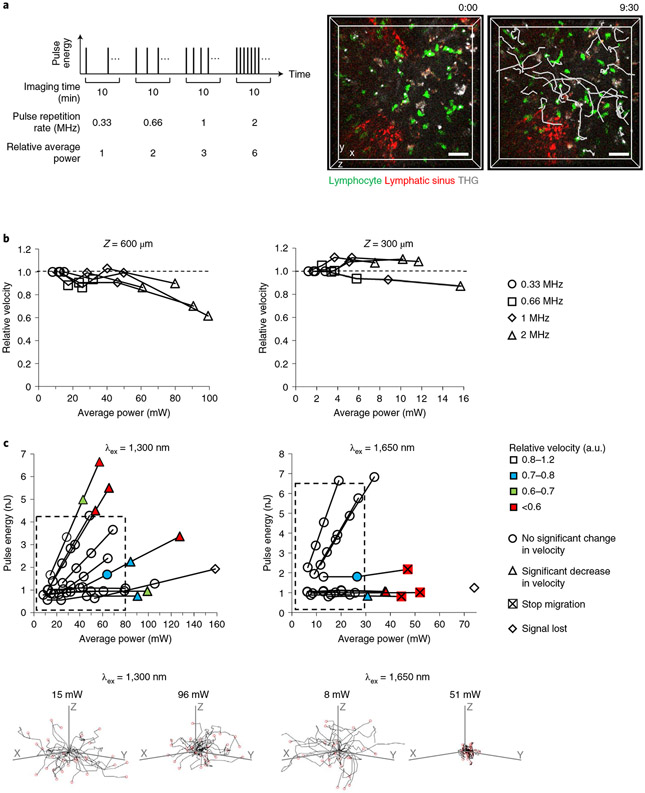
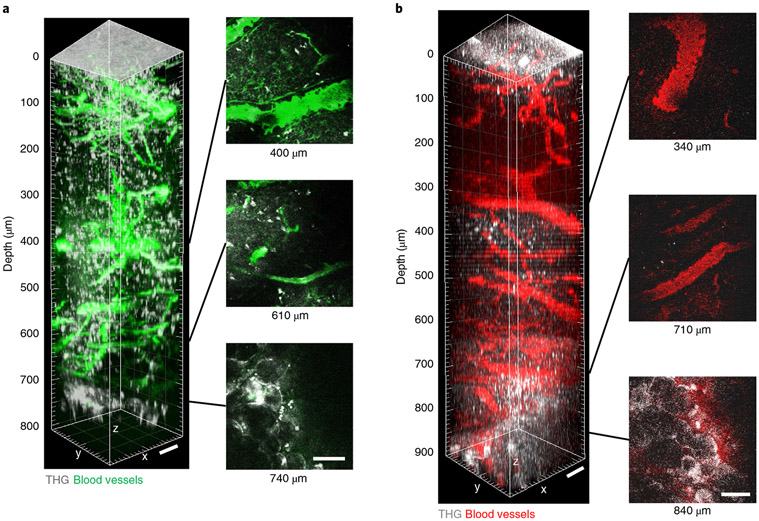
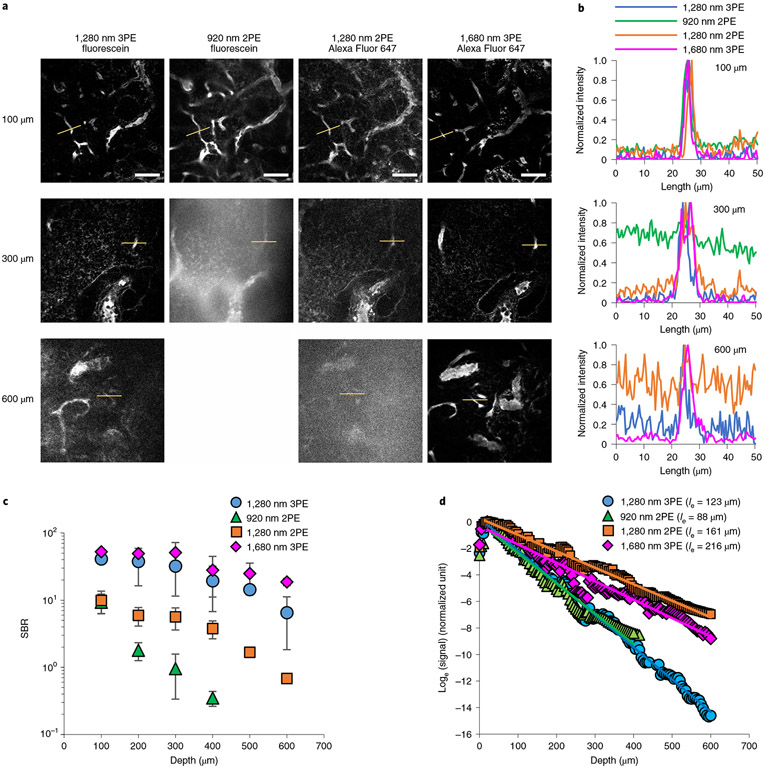
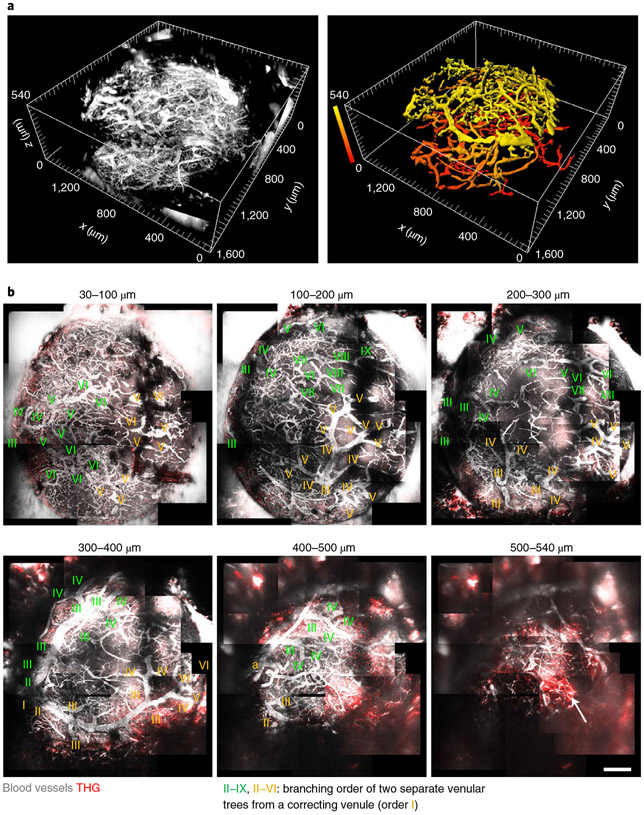
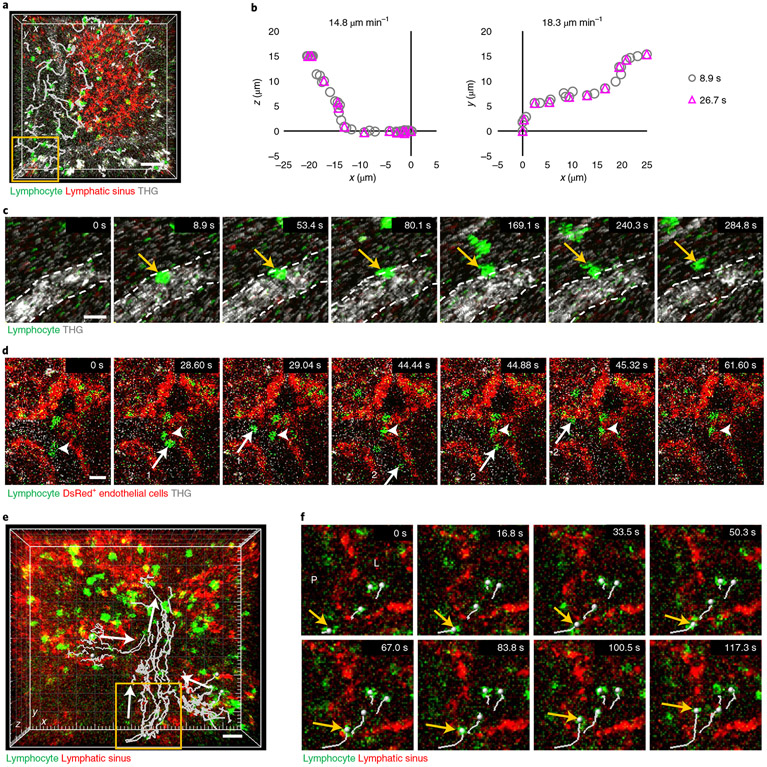
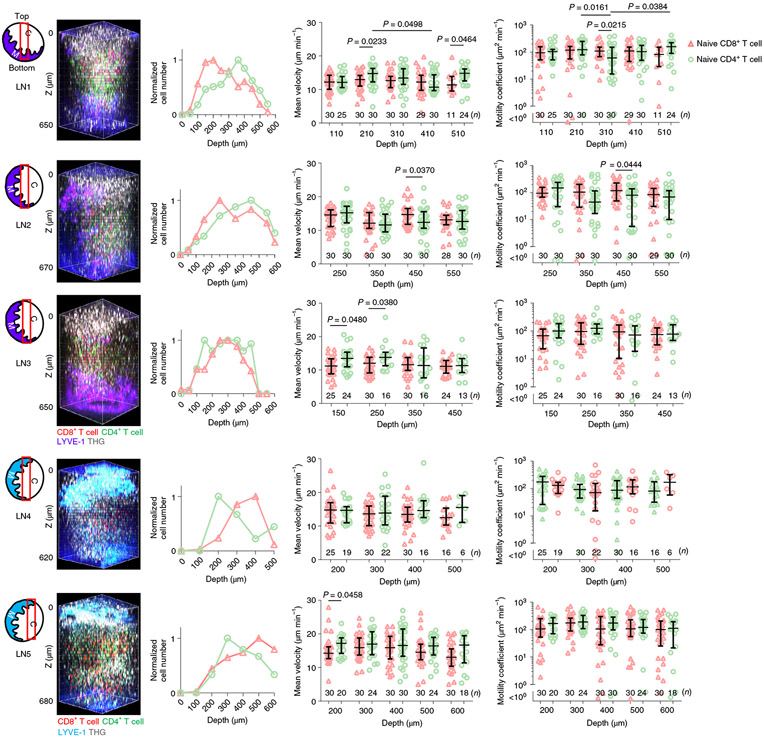
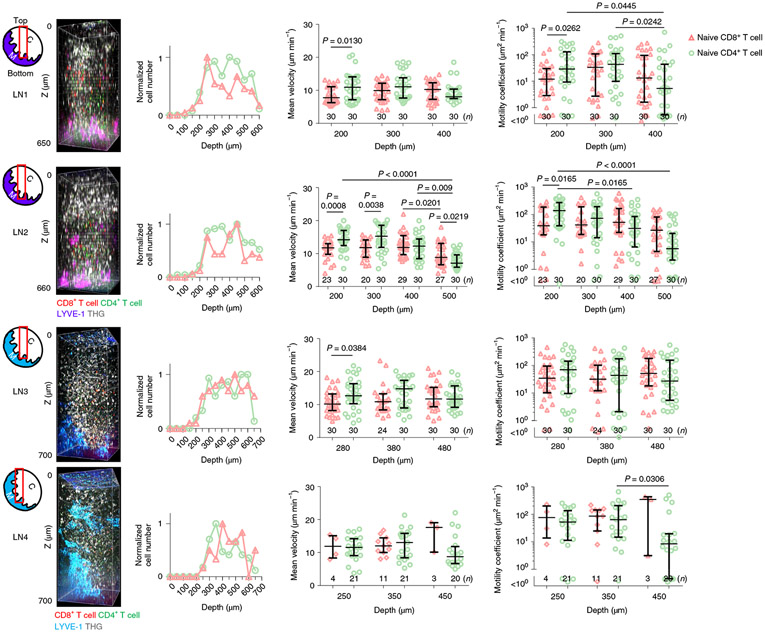
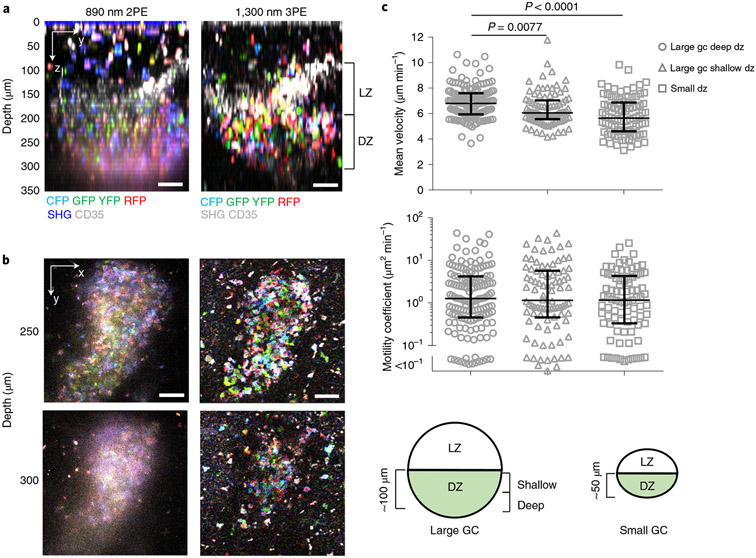
Intravital confocal microscopy and two-photon microscopy are powerful tools to explore the dynamic behavior of immune cells in mouse lymph nodes (LNs), with penetration depth of ~100 and ~300 μm, respectively. Here, we used intravital three-photon microscopy to visualize the popliteal LN through its entire depth (600-900 μm). We determined the laser average power and pulse energy that caused measurable perturbation in lymphocyte migration. Long-wavelength three-photon imaging within permissible parameters was able to image the entire LN vasculature in vivo and measure CD8+ T cells and CD4+ T cell motility in the T cell zone over the entire depth of the LN. We observed that the motility of naive CD4+ T cells in the T cell zone during lipopolysaccharide-induced inflammation was dependent on depth. As such, intravital three-photon microscopy had the potential to examine immune cell behavior in the deeper regions of the LN in vivo.


Figures

Extended Data Fig. 1 ∣
Extended Data Fig. 1 ∣. Effect of LN temperature on lymphocyte velocity.
a, Comparison of lymphocyte velocities at a low LN temperature of ~28 °C and at a normal LN temperature of ~36.5 °C. b, Changes in lymphocyte velocity when the LN temperature is increased by 1 °C from 35.5 °C to 39.5 °C. ns, not significant; Kruskal-Wallis test followed by Dunn’s multiple comparisons test. Representative of two independent experiments. a-b, eGFP+ lymphocyte velocities at ~300 μm depth in popliteal LN were measured by acquiring a volume (202x202x35 μm3) every 30 seconds for 10 minutes with 1300 nm 3PE at each temperature. The maximum power on the LNs was below 2.7 mW. Each data point indicates an individual lymphocyte track; n = 30 tracks for each condition; the median with the interquartile range.
Extended Data Fig. 2 ∣
Extended Data Fig. 2 ∣. Lymphocyte velocity at 600 μm (a) and 300 μm depth (b) with increasing average power of 1300 nm excitation.
a-b, eGFP+ lymphocytes were imaged at the same site with 4 different average powers by 3PE at 1300 nm. The average power (Power) at surface is proportional to the pulse repetition rate (PRR) while the pulse energy (Pulse E) at focus remains approximately constant. For each depth, four LNs from 3 mice were imaged. The exact range of imaging depths around the nominal imaging depths of 600 μm (a) and 300 μm (b) were 590 μm to 625 μm and 290 μm to 325 μm, respectively. The average power increases with the depth from top (Z1) to bottom (Z2) of the imaging volume. Effective attenuation length (EAL) was calculated by taking 4 images at different depths (150, 300, 450, 600 μm depths for a, 50, 100, 200, 300 μm depths for b). Each data point indicates an individual lymphocyte track; n = 30 tracks for each condition; the median with the interquartile range; ns, not significant; Kruskal-Wallis test followed by Dunn’s multiple comparisons test.
Extended Data Fig. 3 ∣
Extended Data Fig. 3 ∣. Lymphocyte velocity at 600 μm with increasing pulse energy and average power at 1300 nm excitation.
a, Schematic of adjusting pulse energy and average power for taking the four 10-min movies sequentially. The average power is proportional to the pulse energy since the repetition rate was kept constant. b-h, eGFP+ lymphocyte velocity was measured at the same site with 4 different pulse energies (at focus) by 3PE at 1300 nm. Pulse repetition rates of 0.66 and 0.33 MHz were used for b-f and g-h, respectively. Power, average power at surface. Seven LNs from 6 mice were imaged.The exact imaging depth was from 590 μm to 625 μm. The average power increases with depth from top (Z1) to bottom (Z2) of the imaging volume. Effective attenuation length (EAL) was calculated by taking 4 images at different depths. Each data point indicates an individual lymphocyte track; n = 30 tracks (except for n = 22 tracks at 1 nJ in h); the median with the interquartile range; ns, not significant; Kruskal-Wallis test followed by Dunn’s multiple comparisons test. The image rapidly darkened within a few minutes when we applied more than 146 mW in f (Supplementary Movie 3). The velocity even at relatively low power and low pulse energy in d-f is lower than 10 μm/min because the imaging site was close to LN boundary (sub-cortical region). This observation is consistent with previous reports that the velocity of both T and B cells in subcortical region is 6–8 μm/min (ref. ).
Extended Data Fig. 4 ∣
Extended Data Fig. 4 ∣. Lymphocyte velocity at 600 μm depth with increasing average power and pulse energy at 1650 nm excitation.
a-f, DsRed+ lymphocytes were imaged at the same site with 3 to 4 different pulse repetition rates by 3PE at 1650 nm. The average power at surface (Power) is proportional to the pulse repetition rate (PRR) while the pulse energy at focus (Pulse E) remains constant. Six LNs from 4 mice were imaged. g-i, DsRed+ lymphocytes velocity was measured at the same site with 4 different pulse energies (at focus). The average power is proportional to the pulse energy while the repetition rate was kept constant (0.33 MHz). Three LNs from 3 mice were imaged. a-i, The exact imaging depth was from 590 μm to 625 μm. The average power increases with depth from top (Z1) to bottom (Z2) of the imaging volume. Effective attenuation length (EAL) was calculated by taking 4 images at different depths. Each data point indicates an individual lymphocyte track; the number of analyzed tracks (n = 21–37) is indicated on the graphs; the median with the interquartile range; ns, not significant; Kruskal-Wallis test followed by Dunn’s multiple comparisons test. Even though most lymphocytes stopped migration at >40mW in a,b and e (Supplementary Movie 3), the measured mean velocity is non-zero due to the uncertainties that occur when determining the cell positions at different times.
Extended Data Fig. 5 ∣
Extended Data Fig. 5 ∣. Dependence of fluorescence signal on excitation pulse energy in logarithmic scales.
a, Dependence of fluorescence signal on excitation pulse energy at 1,680 nm in logarithmic scales for Alexa Fluor 647. The slope is 3.03. The signal was measured in Alexa Fluor 647 dye solution with a pulse repetition rate of 0.33 MHz. b, Dependence of fluorescence signal on excitation pulse energy at 1300 nm in logarithmic scales for DsRed. The slope is 2.95, which is in close agreement with the calculated slope value (2.93) at ~0.7 nJ using the 2 P and 3 P cross sections of DsRed (ref. ). These observations indicate that 3 P excitation was dominant in our imaging condition. The signal was measured at the surface of a LN in an actin-DsRed mouse with a pulse repetition rate of 2 MHz. The average power is proportional to the pulse energy.
Extended Data Fig. 6 ∣
Extended Data Fig. 6 ∣. Additional experiments for comparison of LN blood vessel imaging by 3PM and 2PM.
a, In vivo images of fluorescein+ blood vessels using 1,280 nm 3PE and 920 nm 2PE, and Alexa-Fluor-647+ blood vessels using 1280 nm 2PE and 1680 nm 3PE at the same site of the same LN. Three LNs from 3 mice were imaged. The number shown in each image is the average laser power (mW) under the objective lens. Scale bars, 50 μm. b, Signal-to-background ratios (SBRs) were measured at different depths. Each data point is the average and s.d. of SBRs measured in 3 blood vessels in one image. c, Normalized fluorescence signal intensity as a function of imaging depth measured in the same mouse as in a. The fluorescence signal strength at a particular depth is represented by the average value of the brightest 0.5% pixels in the XY image at that depth divided by the square (for 2PE) or cube (for 3PE) of the average power. The effective attenuation length (le) was the inverse of the slope divided by the order of the nonlinear process (that is, 2 for 2PE and 3 for 3PE).
Extended Data Fig. 7 ∣
Extended Data Fig. 7 ∣. In vivo 3PM of mouse spleen.
Alexa-Fluor-647+ blood vessels and THG were imaged in spleen of adult mouse by 1650 nm 3PM.A shallow region (red pulp, RP) below the spleen surface contains many THG-generating cells, possibly red blood cells or leukocytes such as monocytes and macrophages. The area of high blood leakage is likely the marginal zone (MZ) where many open-ended blood vessels exist. The area below the MZ is likely white pulp (WP). Scale bars, 50 μm. The maximum average power under the objective lens was 28 mW.
Extended Data Fig. 8 ∣
Extended Data Fig. 8 ∣. Naïve CD8+ and CD4+ T cell distribution in LNs.
a, 3D reconstruction of z-stack images (230x800x750 μm3) acquired in a popliteal LN in vivo by 3PM at 1300 nm excitation. b, Naïve eGFP+ CD8+ and DsRed+ CD4 T cell positions of a in yz coordinates. (bottom) Color-maps showing relative T cell density in each 100 × 100 μm2 square area. c, Relative T cell distribution along the z-axis in the dashed boxes in b. Each data point represents the number of cells within the volume from the indicated depth to 50 μm below. a-c, Representative of two independent experiments. d, (1st column) 2D-images were acquired in 50 μm cryosections of popliteal LNs by ex vivo 2PM. Naïve CD8+ T cell and naïve CD+4 T cell were labeled with eGFP and DsRed, respectively for LN1-2. The labeling scheme was switched for LN3, with DsRed and eGFP labeling CD8+ and CD4+ T cells, respectively. C, cortical side. M, medullary side. Scale bars, 200 μm. (2nd column) Naïve CD8+ and CD4+ T cell positions in xy coordinates. Dotted circles are the area presumed to be B cell follicles. (3rd-4th columns) Color-maps showing relative T cell density in each 100 × 100 μm2 square area.
Extended Data Fig. 9 ∣
Extended Data Fig. 9 ∣. Deep GC of popliteal LN on the imaging axis.
a, A schematic diagram of the deep GC (arrow) on the imaging axis. b, Comparison of the deep GC (~400 μm depth) imaging by 920 nm 2PM and 1300 nm 3PM. The maximum average power under the objective lens was 204 mW (80 MHz repetition rate) and 21 mW (0.33 MHz repetition rate) for 2PM and 3PM, respectively. Scale bars, 50 μm.
Fig. 1 ∣
Fig. 1 ∣. Permissible laser power and pulse energy were determined by monitoring lymphocyte velocity.
a, Schematic of adjusting average laser power for the four 10-min movies of lymphocyte migration taken sequentially (left) and representative images showing 3D tracks (white lines) of eGFP+ lymphocytes at 600 μm depth in LNs (right). Scale bars, 30 μm. Time scale, m:ss. b, Relative velocity of eGFP+ lymphocytes at 600 μm (left) and 300 μm (right) depth in LNs at various average powers (at surface) of 1,300 nm excitation. The four shapes of the markers correspond to the four pulse repetition rates used in each LN. Each data point represents the median of ~30 lymphocyte velocities (details in Extended Data Fig. 2). For each depth, four LNs from three mice were imaged. c, Relative velocity of eGFP+ (left) and DsRed+ (right) lymphocytes at 600 μm depth in LNs using 1,300 nm and 1,650 nm wavelength excitation (λex), respectively, at various average powers (at surface) and pulse energies (at focus). Data are displayed as color maps. Significant changes in the velocity are indicated by the shape of the markers. Dashed boxes indicate the permissible range of average power and pulse energy. Eleven LNs from nine mice were imaged at 1,300 nm and nine LNs from seven mice were imaged at 1,650 nm (details in Extended Data Figs. 2a and 3 and Extended Data Fig. 4). Thirty lymphocyte tracks at the indicated laser illumination power (bottom).
Fig. 2 ∣
Fig. 2 ∣. In vivo 3PM of blood vessels through the entire depth of mouse popliteal LNs.
a, 3D reconstruction of 800 μm z-stack (left) and representative lateral images (right) acquired by 1,280 nm 3PE showing fluorescein+ blood vessels and THG in a popliteal LN in vivo. At 740 μm depth, adipocytes below the bottom of the LN were observed in the THG channel. b, 3D reconstruction of 900 μm z-stack (left) and representative lateral images (right) acquired by 1,680 nm 3PE showing Texas Red+ blood and THG in a popliteal LN in vivo. At 840 μm depth, adipocytes below the bottom of the LN were observed in the THG channel. Scale bars, 50 μm. The maximum average power under the objective lens was 72 mW and 21 mW for 1,280 nm and 1,680 nm, respectively.
Fig. 3 ∣
Fig. 3 ∣. Comparison of LN blood vessel imaging by 3PM and 2PM.
a, In vivo images of fluorescein+ blood vessels using 1,280 nm 3PE and 920 nm 2PE and Alexa-Fluor-647+ blood vessels using 1,280 nm 2PE and 1,680 nm 3PE at the same site of the same LN. For 920 nm 2PE, no image is shown at 600 μm depth because the maximum imaging depth achieved was about 300 μm. Scale bars, 50 μm. b, Fluorescence intensity profiles across the blood vessels along the yellow lines in a. c, SBRs measured at different depths. Each data point is the average and s.d. of SBRs measured in three blood vessels in one image. d, Normalized fluorescence signal intensity as a function of imaging depth measured in the same mouse as in a. The fluorescence signal strength at a particular depth is represented by the average value of the brightest 0.5% pixels in the xy image at that depth divided by the square (for 2PE) or cube (for 3PE) of the average power. The effective attenuation length (le) was the inverse of the slope divided by the order of the nonlinear process (two for 2PE and three for 3PE).
Fig. 4 ∣
Fig. 4 ∣. In vivo 3PM image of the entire popliteal LN vasculature.
a, 3D reconstruction of fluorescein+ blood vessel images acquired by 1,280 nm 3PE in an entire popliteal LN. Depth-color map of blood vessels (right). Depth 0 (z = 0) indicates the surface of the LN. b, Maximum intensity projection for the range of depth indicated. Roman numerals indicate venular branching order from the large collecting venule (I) to the small post-capillary venules (up to IX). The branching orders extending from the two large venules (order, II) are marked with two different colors, green and yellow. Arrow indicates the THG signal from the adipocytes below the bottom of the LN. a, arteriole. Scale bar, 200 μm.
Fig. 5 ∣
Fig. 5 ∣. In vivo 3PM of lymphocyte migration in deep LNs.
a, 3D-tracking of eGFP+ lymphocytes (white lines) in the parenchyma at 600 μm depth of popliteal LNs by acquiring a volume (202 × 202 × 35 μm3) every 8.9 s with 1,300 nm 3PE. Scale bar, 30 μm. b, Two representative lymphocyte trajectories acquired at time intervals of 8.9 s and 26.7 s. c, 3PM at 8.9 s per volume showing lymphocyte adhesion to the blood vessel wall at 8.9 s and its transmigration across the wall shown in the yellow box in a. THG shows the blood vessel. Dashed lines are the luminal boundary of the blood vessel wall. Scale bar, 10 μm. d, 3PM at 0.44 s per 2D-frame showing lymphocytes (one and two arrows) circulating in blood and lymphocytes (arrow heads) crawling on the blood vessel wall at 500 μm depth in popliteal LNs of actin-DsRed mice. Scale bar, 10 μm. e, 3D-tracking of eGFP+ lymphocytes (white lines) inside LYVE-1-eFluor615+ lymphatic sinus at 450–520 μm depth of LNs by acquiring a volume (300 × 300 × 70 μm3) every 16.8 s with 1,300 nm 3PE. Arrows indicate directions of lymphocyte flow. Scale bar, 20 μm. f, Lymphocyte (arrow) transmigrates across the wall of lymphatic sinus shown in the yellow box in e. P, parenchyma; L, inside lymphatic sinus. Scale bar, 20 μm.
Fig. 6 ∣
Fig. 6 ∣. Measurement of T cell motility across the entire depth of popliteal LNs.
Schematics of imaging location (red box) in each LN; C, cortical side; M, medullary side in the LNs. 3D reconstruction of 620–680 μm z-stacks with the field of view of 404 × 404 μm2 acquired by 1,300 nm 3PE. Naive CD8+ T cells and naive CD4+ T cells were labeled with DsRed and eGFP, respectively, in LN1–3. To exclude the possible effect of the labeling on the results, the labeling scheme was switched for LNs 4 and 5, with DsRed and eGFP labeling CD4+ and CD8+ T cells, respectively. Five LNs from five mice were imaged. Normalized T cell distributions by depth were acquired by measuring the number of cells within a volume (202 × 202 × 50 μm3) from the indicated depth to 50 μm below at the center of the 3D z-stacks. T cell mean velocity and motility coefficients were measured within a volume (202 × 202 × 35 μm3) from the indicated depth to 35 μm below at the center of the 3D z-stacks. Each data point indicates a tracked cell; the number of analyzed cells (n = 11–30) is indicated on the graphs; the median with the interquartile range; Kruskal–Wallis test followed by Dunn’s multiple comparisons test for differences between depths; two-tailed Mann–Whitney test for difference between CD8+ and CD4+ T cells.
Fig. 7 ∣
Fig. 7 ∣. In vivo 3PM of T cell migration in LPS-induced inflamed LNs.
Schematics of imaging location (red box) in each LN; C, cortical side; M, medullary side in the LNs. 3D reconstruction of 650–700 μm z-stacks with the field of view of 300 × 300 μm2 acquired by 1,300 nm 3PE. Naive CD8+ T cells and naive CD4+ T cells were labeled with CMRA and CFSE, respectively in LN1–2. To exclude the possible effect of labeling on results, the labeling scheme was switched for LNs 3 and 4, with CMRA and CFSE labeling CD4+ and CD8+ T cells, respectively. Four LNs from four mice were imaged. Normalized T cell distributions by depth were acquired by measuring the number of cells within a volume (300 × 300 × 50 μm3) from the indicated depth to 50 μm below. T cell mean velocity and motility coefficient were measured within a volume (300 × 300 × 100 μm3) from the indicated depth to 100 μm below. Each data point indicates a tracked cell; the number of analyzed cells (n = 3–30) is indicated on the graphs; the median with the interquartile range; Kruskal–Wallis test followed by Dunn’s multiple comparisons test for differences between depths; two-tailed Mann-Whitney U-test for difference between CD8+ and CD4+ T cells.
Fig. 8 ∣
Fig. 8 ∣. In vivo 3PM of multicolor GC B cells.
a,b, Comparison of GC B cell imaging by 2PM and 3PM. yz (a) and xy (b) images show multicolor B cells in a GC of the popliteal LN of Cγ1Cre-confetti mouse at 8 d after immunization. LZ is labeled with Alexa-Fluor-594-conjugated CD35 antibody. Scale bars, 50 μm. c, Comparison of the mean velocity and motility coefficient of GC B cells among deep and shallow DZs of large GCs and DZs of small GCs; five LNs from four mice were imaged; each data point indicates a tracked cell (n = 150 tracks from five large GC deep DZs, n = 90 tracks from three large GC shallow DZs, n = 86 tracks from three small GCs); the median with the interquartile range; Kruskal–Wallis test followed by Dunn’s multiple comparisons test for differences between the groups. Schematic showing the three regions where B cell motility is compared.

References

    1. Girard J-P, Moussion C & Förster R HEVs, lymphatics and homeostatic immune cell trafficking in lymph nodes. Nat. Rev. Immunol 12, 762–773 (2012). - PubMed
    1. Stoll S, Delon J, Brotz TM & Germain RN Dynamic imaging of T cell-dendritic cell interactions in lymph nodes. Science 296, 1873–1876 (2002). - PubMed
    1. Miller MJ, Wei SH, Parker I & Cahalan MD Two-photon imaging of lymphocyte motility and antigen response in intact lymph node. Science 296, 1869–1873 (2002). - PubMed
    1. Miller MJ, Wei SH, Cahalan MD & Parker I Autonomous T cell trafficking examined in vivo with intravital two-photon microscopy. Proc. Natl Acad. Sci. USA 100, 2604–2609 (2003). - PMC - PubMed
    1. Grigorova IL et al. Cortical sinus probing, S1P1-dependent entry and flow-based capture of egressing T cells. Nat. Immunol 10, 58–65 (2009). - PMC - PubMed

Publication types