. 2022 Jan 11:15:769372.
doi: 10.3389/fnbeh.2021.769372. eCollection 2021.

Variation and Variability in Drosophila Grooming Behavior

Affiliations

Variation and Variability in Drosophila Grooming Behavior

Joshua M Mueller et al. Front Behav Neurosci. .

Abstract

Behavioral differences can be observed between species or populations (variation) or between individuals in a genetically similar population (variability). Here, we investigate genetic differences as a possible source of variation and variability in Drosophila grooming. Grooming confers survival and social benefits. Grooming features of five Drosophila species exposed to a dust irritant were analyzed. Aspects of grooming behavior, such as anterior to posterior progression, were conserved between and within species. However, significant differences in activity levels, proportion of time spent in different cleaning movements, and grooming syntax were identified between species. All species tested showed individual variability in the order and duration of action sequences. Genetic diversity was not found to correlate with grooming variability within a species: melanogaster flies bred to increase or decrease genetic heterogeneity exhibited similar variability in grooming syntax. Individual flies observed on consecutive days also showed grooming sequence variability. Standardization of sensory input using optogenetics reduced but did not eliminate this variability. In aggregate, these data suggest that sequence variability may be a conserved feature of grooming behavior itself. These results also demonstrate that large genetic differences result in distinguishable grooming phenotypes (variation), but that genetic heterogeneity within a population does not necessarily correspond to an increase in the range of grooming behavior (variability).

Keywords: Drosophila; behavior; motor sequence; neural circuits; variability; variation.


Conflict of interest statement

The authors declare that the research was conducted in the absence of any commercial or financial relationships that could be construed as a potential conflict of interest.

Figures

FIGURE 1
FIGURE 1
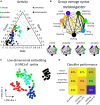
Grooming variability dataset and analysis overview. (A) In total, N = 390 male flies were dusted and their activity was recorded for approximately half an hour each. Five drosophilid species, four melanogaster stock lines, one interbred melanogaster line, and six isogenic melanogaster lines were analyzed for similarity, differences, and stereotypy in grooming and non-grooming behaviors. On the left is a schematic of the different drosophilid groups included in this analysis. Higher levels of the tree indicate higher levels of genetic diversity (scale is relative, not absolute). On the right is a sample of ethograms generated by automated annotation of video. Color indicates the occurrence of the five grooming actions (F, front leg cleaning; H, head grooming; A, abdomen grooming; B, back leg cleaning; W, wing grooming) and two non-grooming actions (Wk, walking; S, standing). (B) Features scored from ethograms provide summary representations of behavior. Shown here are sample visualizations of behavioral metrics analyzed in this work. On the left, the proportion of time spent in different actions provides the coarsest description of the behavioral response to a dust stimulus. Regardless of genotype, all flies exhibit variable (not fixed) action sequences consisting of the same set of five grooming actions, walking, and standing after exposure to irritant. Next, action transition probabilities (syntax) describe the likelihood of performing consecutive actions. Arrow directions and thicknesses represent the probability of performing an action, given the identity of the previous action. Shown next is an example behavioral progression, which depicts the proportion of time spent in each action over a sliding window. Most flies follow a typical behavioral progression pattern: initial anterior grooming followed by increased posterior grooming. The amount and timing of walking and standing, however, can vary significantly between flies. Finally, action (bout) duration distributions describe the range of action lengths. All example features shown here are scored from Canton-S flies.
FIGURE 2
FIGURE 2
Drosophila species share behavioral features but exhibit between-species variation in action proportions and syntax in response to dust stimulus. (A) Dusting elicits a conserved behavioral response across drosophilids. Shown is a ternary plot of activity proportions for each species examined here (N = 65 flies total). Colored points represent a single fly, with color indicating species. The large black point with arrows indicates how to read activity proportions; the example point corresponds to 10% grooming, 40% walking, and 50% standing. (B) Drosophilid species produce a probabilistic behavioral sequence (as shown in Figure 1A), which can be characterized by the transition probabilities (syntax) between actions [as represented in Figure 1B, calculated as in Mueller et al. (2019)]. The mean syntax for each species is depicted as a graph, with nodes representing actions and edges indicating transition probability. Thicker edges indicate higher probabilities. On the melanogaster syntax graph, the 10 action transitions exhibiting the largest magnitude differences between melanogaster and non-melanogaster species are highlighted in gold. These differences are identifiable in anterior motif transitions, which use the front legs to perform grooming actions. Species also differ in their transitions between posterior grooming actions and non-grooming actions (walking and standing) (C) Each fly’s 42-dimensional syntax vector was plotted in two dimensions after dimensionality reduction using t-SNE. t-SNE preserves local distance structure, indicating that tightly grouped clusters of points are similar to one another. In this case, dimensionality reduction reveals that drosophilid species exhibit significant differences in syntax, as syntax vectors congregate by color. (D) Classification analysis confirms the qualitative clustering observed in C. Shown is a heat map of accuracy rates of 5-possibility multinomial logistic regression classifiers trained on behavioral features. For these samples, classification at chance would be 20%. Consistent classification accuracy values >20% indicate that species are highly separable by behavioral features. Simple features, such as behavioral proportions and progressions, classify individuals by species with high accuracy when grooming actions are included. Classification using only non-grooming actions (walking and standing) still yields classification above chance, indicating that species differ significantly in their overall activity levels. Syntax also allows for accurate classification, particularly when all action transitions are considered.
FIGURE 3
FIGURE 3
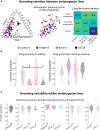
Within melanogaster, different stocks differences in syntax activity levels. Genetic homogeneity does not correspond to behavioral stereotypy. (A) melanogaster stocks (N = 111 flies total) exhibited variation in grooming syntax, though many features were shared. On the left is a ternary plot of grooming, walking, and standing proportions for each stock, similar to Figure 2A. Colored points represent individual flies. Shown in the middle is a t-SNE plot of syntax vectors, as in Figure 2C. The high degree of overlap in both of these plots illustrates that behavioral responses are qualitatively similar between some individuals of different stock lines. Classifier performance (similar to that shown in Figure 2D) is shown on the right. For these data, classification at chance is 25%. Performance above chance is still possible for stock lines. Classification performs similarly well for behavioral features regardless of their complexity; using just walking and standing behavioral proportions provides similar discriminability as using the full syntax. (B) Most syntax elements were similar between melanogaster stocks, but Canton-S flies walked more than other stocks. Due to differences in activity levels, some walking-related syntax elements differed between Canton-S flies and other stocks. Of the significantly different transitions, only two were within-motif transitions while the rest consisted mostly of transitions to and from walking and standing (Supplementary Figure 12). Shown on the left are the wing grooming to walking transition probability distributions for each melanogaster stock line. Significant differences in these distributions were observed between lines. On the right, distributions for a posterior grooming transition are shown; the vast majority of action transition distributions did not differ due to their large variances. (C) Variances of action transition distributions for stock lines, lines bred for maximum genetic heterogeneity (MaxVar), and lines bred to minimize genetic heterogeneity (iso) were compared (N = 252 total). Genetic homogeneity did not correspond to behavioral variability. Shown as an example are the distributions of abdomen grooming to back leg cleaning transitions. MaxVar flies did not exhibit a higher degree of variability (as measured by the variance of transition distributions) than stock lines. Isogenized lines did not exhibit a lower degree of variability than their parent stocks. *significantly different at p < 0.05.
FIGURE 4
FIGURE 4
Within-individual grooming differences suggest that non-genetic factors account for a significant portion of variability in behavior. (A) Portions of ethograms from three Canton-S flies observed on consecutive days after dust irritant exposure. The differences in ethograms on consecutive days indicate that non-genetic factors must account for some amount of grooming variability. (B) Shown are ethograms of 10 Bristle-spGAL4-1 >CsChrimson flies (Zhang et al., 2020). Flies were optogenetically stimulated to induce anterior grooming in three separate 3-min windows, indicated by the red bars. Between these windows, flies still exhibit within-individual grooming variability even though the sensory experience is more uniform than repeated dust exposure. (C) Markov chain entropy, a measure of grooming stereotypy, was calculated from anterior grooming syntax. Optogenetically stimulated flies (right) exhibited lower entropies, corresponding to a higher degree of stereotypy, than dusted flies (left). However, optogenetically stimulated flies still exhibited differences in stereotypy between stimulation windows, implicating sources of grooming variability beyond genetic and sensory influences (Supplementary Figure 19). (D) To assess grooming stereotypy, edit distance between anterior motif repeats was computed. For dusted within-fly comparisons, we computed the edit distance between the first continuous anterior motif sequence lasting 30 s on consecutive days (light blue). For between-fly comparisons, we computed the edit distance between the first continuous anterior motif sequence lasting 30 s on the first day of experiments (dark blue). For all optogentically-stimulated flies, we computed two similar comparisons: within-session [i.e., comparing the sequences labeled “Activation #1” and “Activation #2” in panel (B); light red] and between-fly (i.e., “Activation #1” for each fly; dark red). For each comparison listed, the median edit distance computed corresponded to around 50% of the sequence length, demonstrating the low degree of stereotypy present in grooming sequences. *significantly different at p < 0.05.

References

    1. Allen A., Anreiter I., Neville M., Sokolowski M. (2017). Feeding-related traits are affected by dosage of the foraging gene in drosophila melanogaster. Genetics 205 761–773. 10.1534/genetics.116.197939 - DOI - PMC - PubMed
    1. Anderson D. (2016). Circuit modules linking internal states and social behaviour in flies and mice. Nat. Rev. Neurosci. 17 692–704. 10.1038/nrn.2016.125 - DOI - PubMed
    1. Auer T. O., Khallaf M. A., Silbering A. F., Zappia G., Ellis K., Álvarez-Ocaña R., et al. (2020). Olfactory receptor and circuit evolution promote host specialization. Nature 579 402–408. 10.1038/s41586-020-2073-7 - DOI - PMC - PubMed
    1. Ayroles J., Buchanan S., O’Leary C., Skutt-Kakaria K., Grenier J., Clark A., et al. (2015). Behavioral idiosyncracy reveals genetic control of phenotypic variability. PNAS 112 6706–6711. 10.1073/pnas.1503830112 - DOI - PMC - PubMed
    1. Baker B., Taylor B., Hall J. (2001). Are complex behaviors specified by dedicated regulatory genes? reasoning from drosophila. Genetics 105 13–24. 10.1016/s0092-8674(01)00293-8 - DOI - PubMed