

Visualization of Speech Perception Analysis via Phoneme Alignment: A Pilot Study
- PMID: 35087462
- PMCID: PMC8787339
- DOI: 10.3389/fneur.2021.724800
Visualization of Speech Perception Analysis via Phoneme Alignment: A Pilot Study
Abstract
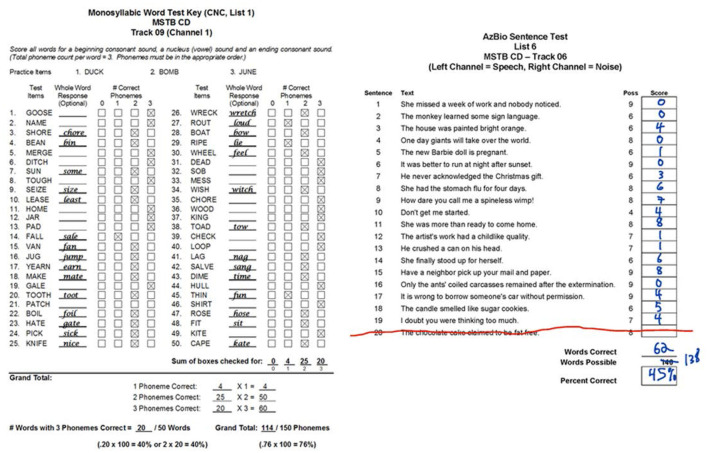
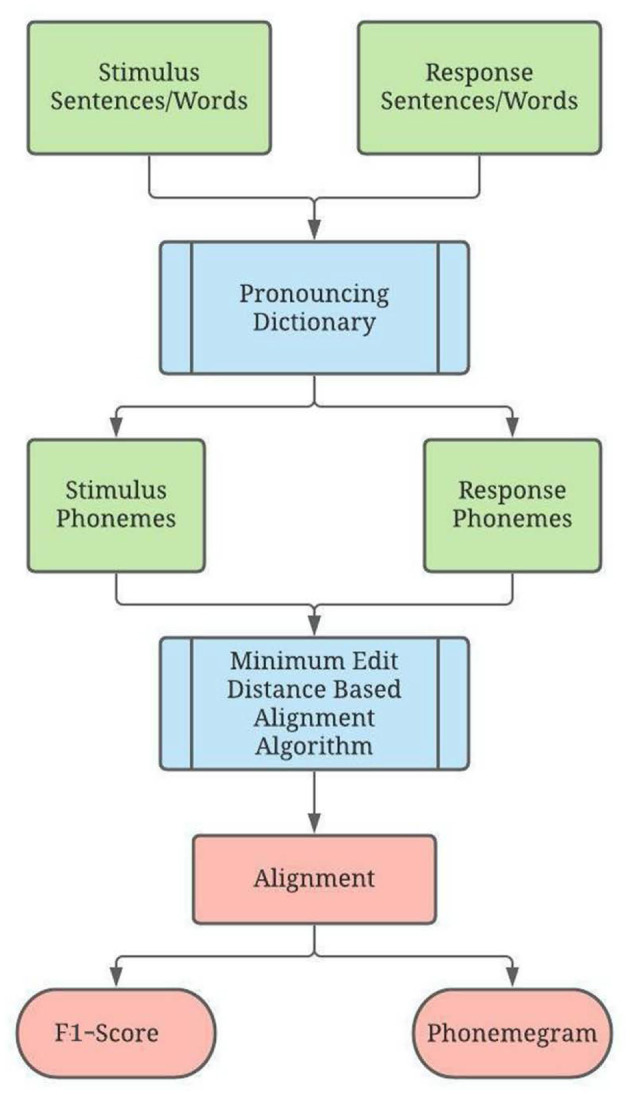
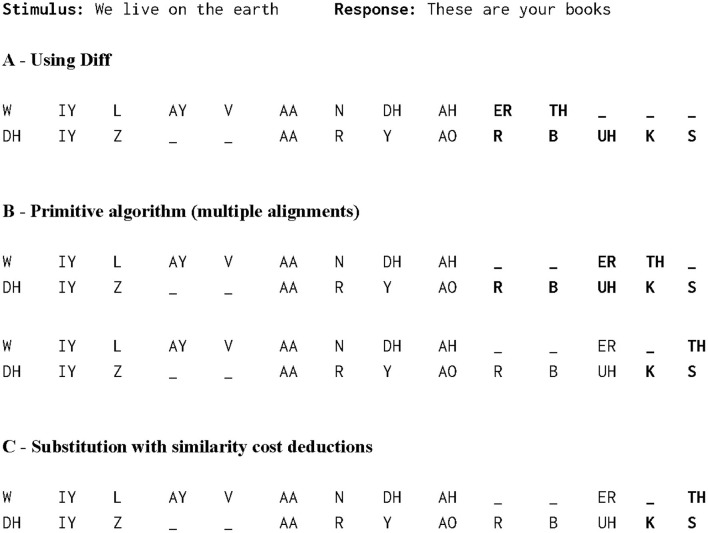
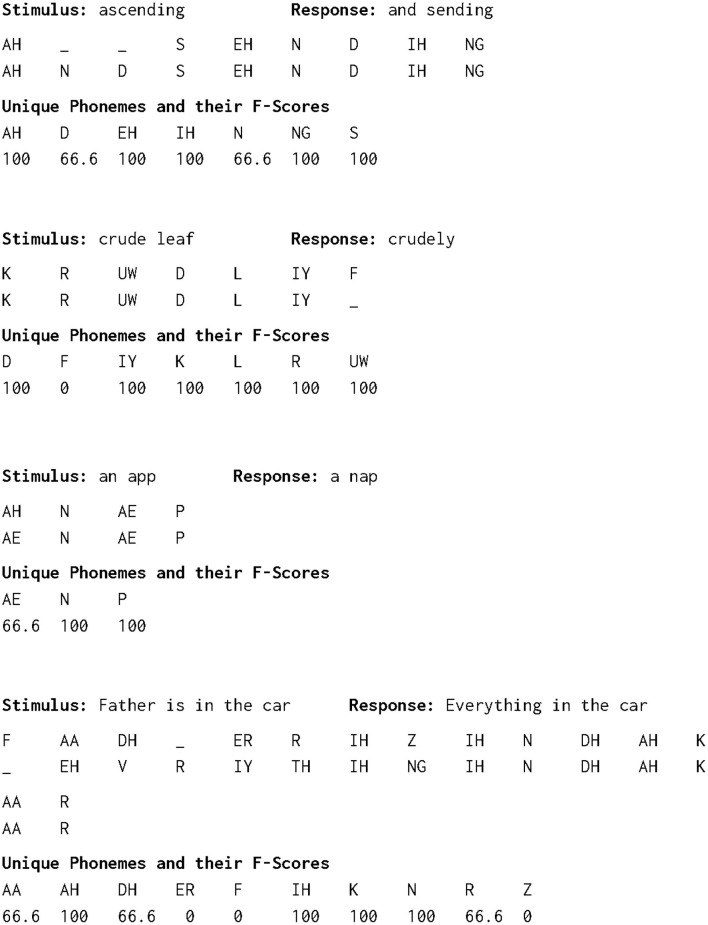
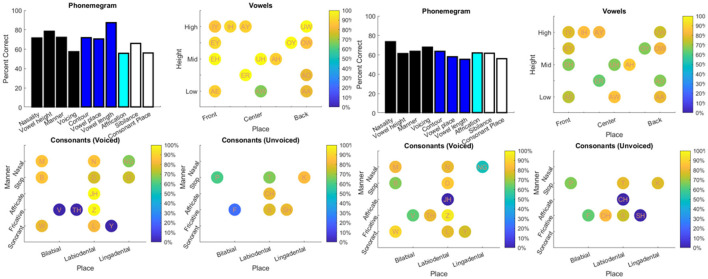
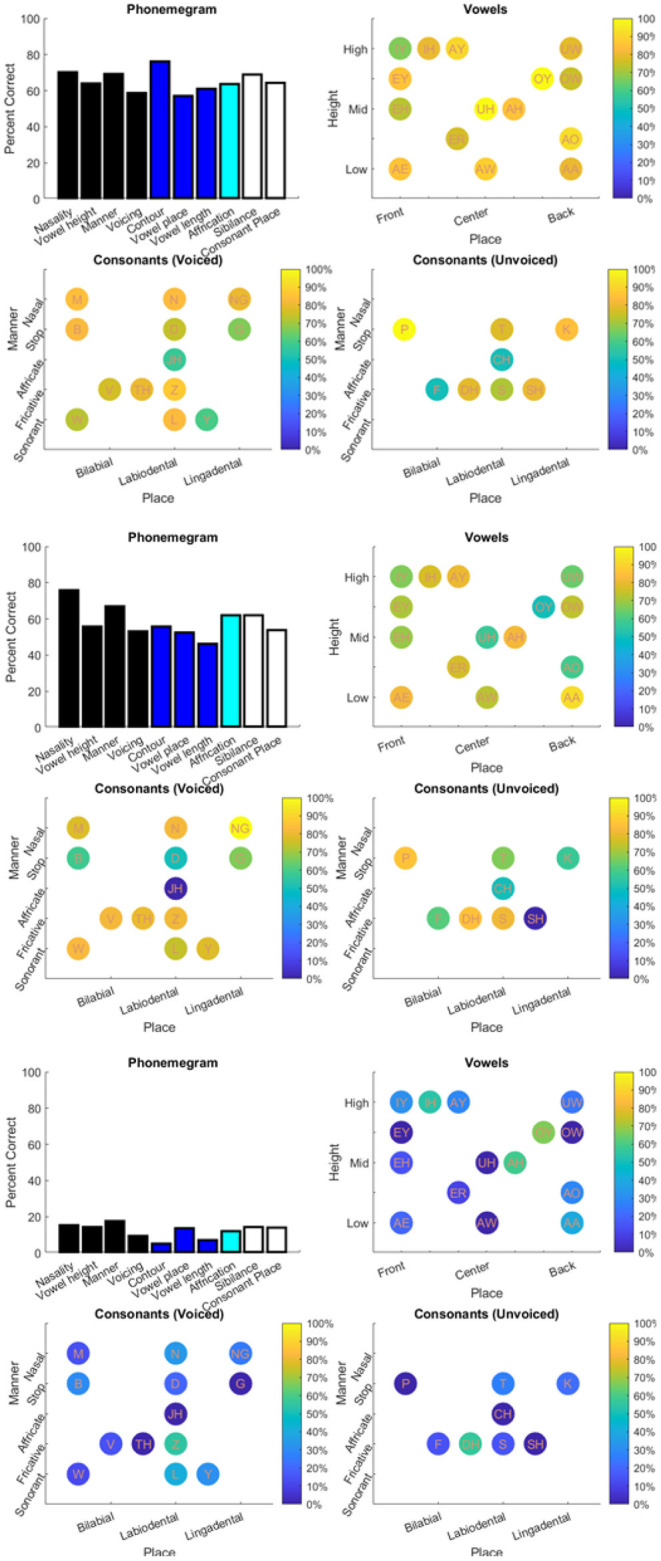
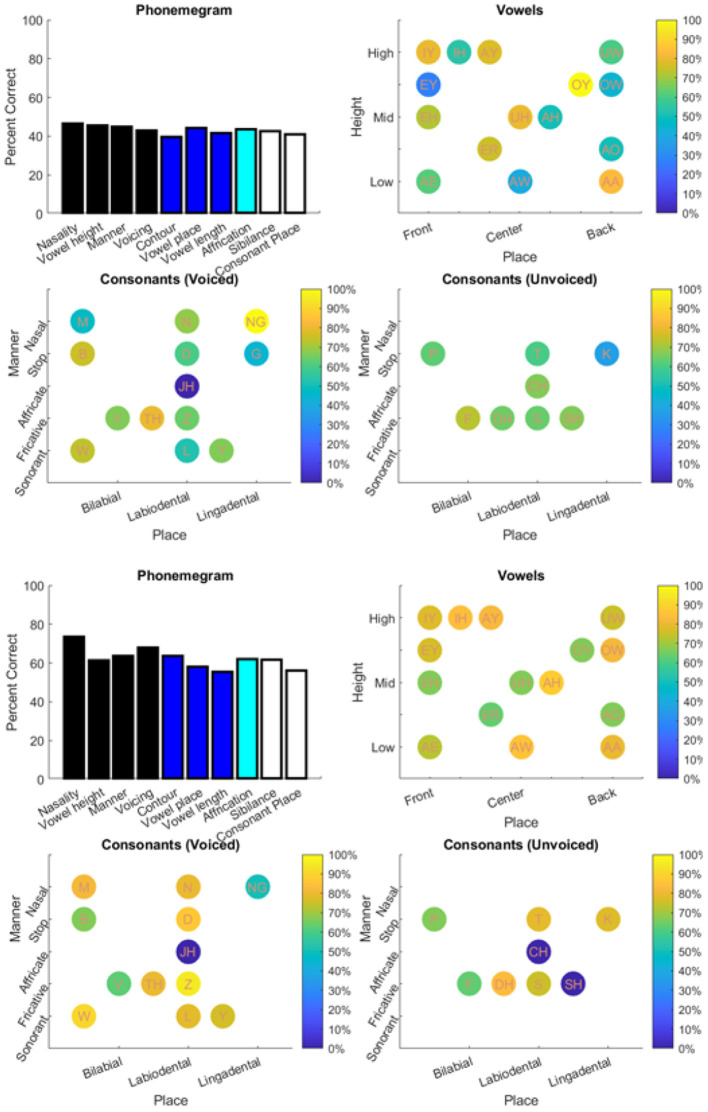
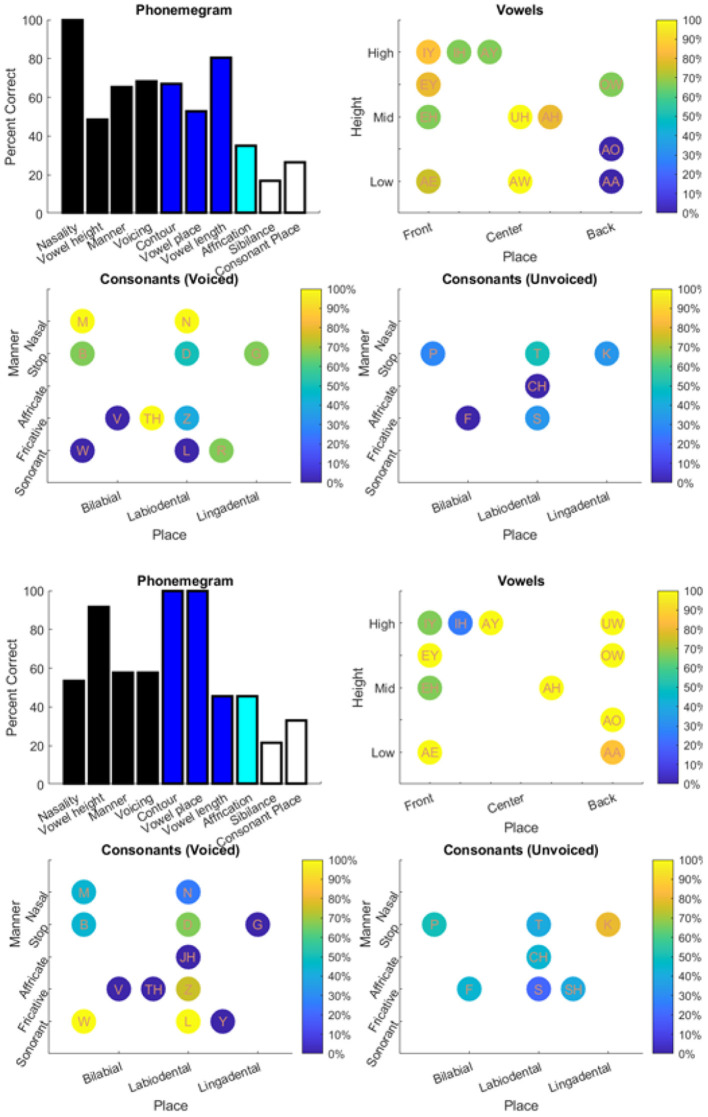
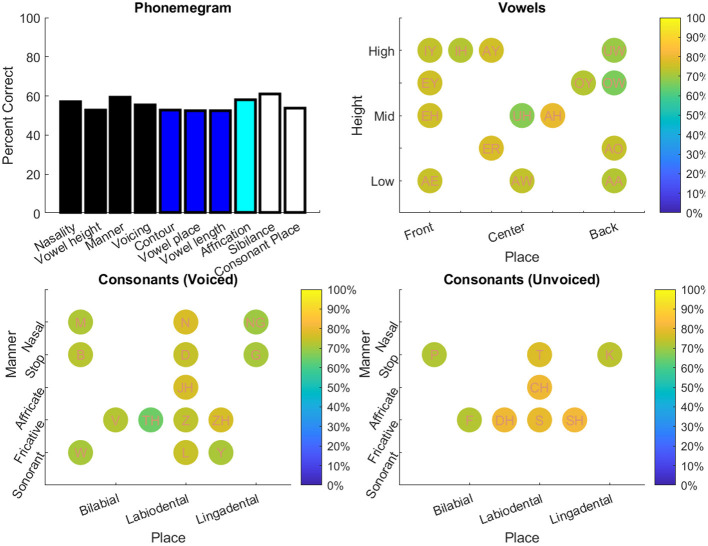
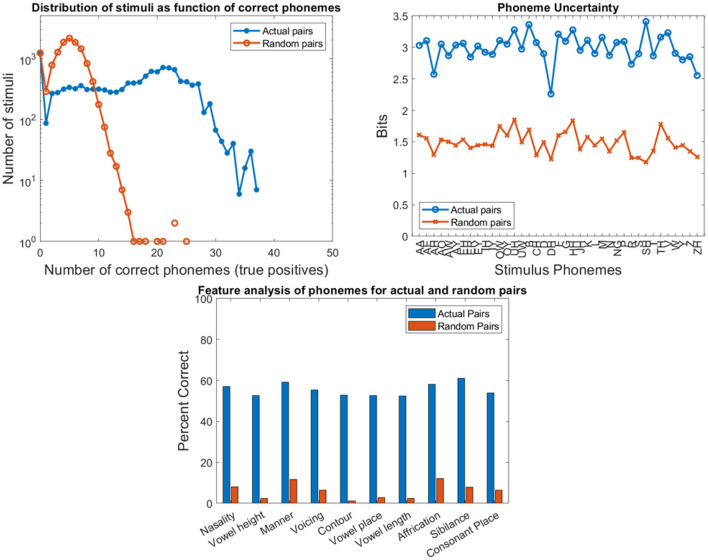
Objective: Speech tests assess the ability of people with hearing loss to comprehend speech with a hearing aid or cochlear implant. The tests are usually at the word or sentence level. However, few tests analyze errors at the phoneme level. So, there is a need for an automated program to visualize in real time the accuracy of phonemes in these tests. Method: The program reads in stimulus-response pairs and obtains their phonemic representations from an open-source digital pronouncing dictionary. The stimulus phonemes are aligned with the response phonemes via a modification of the Levenshtein Minimum Edit Distance algorithm. Alignment is achieved via dynamic programming with modified costs based on phonological features for insertion, deletions and substitutions. The accuracy for each phoneme is based on the F1-score. Accuracy is visualized with respect to place and manner (consonants) or height (vowels). Confusion matrices for the phonemes are used in an information transfer analysis of ten phonological features. A histogram of the information transfer for the features over a frequency-like range is presented as a phonemegram. Results: The program was applied to two datasets. One consisted of test data at the sentence and word levels. Stimulus-response sentence pairs from six volunteers with different degrees of hearing loss and modes of amplification were analyzed. Four volunteers listened to sentences from a mobile auditory training app while two listened to sentences from a clinical speech test. Stimulus-response word pairs from three lists were also analyzed. The other dataset consisted of published stimulus-response pairs from experiments of 31 participants with cochlear implants listening to 400 Basic English Lexicon sentences via different talkers at four different SNR levels. In all cases, visualization was obtained in real time. Analysis of 12,400 actual and random pairs showed that the program was robust to the nature of the pairs. Conclusion: It is possible to automate the alignment of phonemes extracted from stimulus-response pairs from speech tests in real time. The alignment then makes it possible to visualize the accuracy of responses via phonological features in two ways. Such visualization of phoneme alignment and accuracy could aid clinicians and scientists.
Keywords: F1-score; phoneme accuracy; phoneme alignment; relative information transfer; speech tests.
Copyright © 2022 Ratnanather, Wang, Bae, O'Neill, Sagi and Tward.
Conflict of interest statement
The authors declare that the research was conducted in the absence of any commercial or financial relationships that could be construed as a potential conflict of interest.
Figures

Similar articles
-
Comparison of word-, sentence-, and phoneme-based training strategies in improving the perception of spectrally distorted speech.J Speech Lang Hear Res. 2008 Apr;51(2):526-38. doi: 10.1044/1092-4388(2008/038). J Speech Lang Hear Res. 2008. PMID: 18367694 Clinical Trial.
-
A computational approach to analyzing sentential speech perception: phoneme-to-phoneme stimulus-response alignment.J Acoust Soc Am. 1994 Jun;95(6):3617-22. doi: 10.1121/1.409930. J Acoust Soc Am. 1994. PMID: 8046151
-
The Carhart Memorial Lecture, American Auditory Society, Salt Lake City, Utah 1996. Phoneme and word recognition for words in isolation and in sentences.Ear Hear. 1997 Jun;18(3):175-88. doi: 10.1097/00003446-199706000-00001. Ear Hear. 1997. PMID: 9201453
-
Speech recognition with the nucleus 24 SPEAK, ACE, and CIS speech coding strategies in newly implanted adults.Ear Hear. 2002 Jun;23(3):207-23. doi: 10.1097/00003446-200206000-00005. Ear Hear. 2002. PMID: 12072613
-
A Phoneme Perception Test Method for High-Frequency Hearing Aid Fitting.J Am Acad Audiol. 2016 May;27(5):367-379. doi: 10.3766/jaaa.15037. J Am Acad Audiol. 2016. PMID: 27179256
Cited by
-
Consonant Perception in Connected Syllables Spoken at a Conversational Syllabic Rate.Trends Hear. 2023 Jan-Dec;27:23312165231156673. doi: 10.1177/23312165231156673. Trends Hear. 2023. PMID: 36794551 Free PMC article.
-
Preliminary Evaluation of Automated Speech Recognition Apps for the Hearing Impaired and Deaf.Front Digit Health. 2022 Feb 16;4:806076. doi: 10.3389/fdgth.2022.806076. eCollection 2022. Front Digit Health. 2022. PMID: 35252959 Free PMC article.
References
-
- Ladefoged P, Johnstone K. A Course in phonetics (Seventh edition. ed.). Stamford, CT: Cengage Learning. (2015).
-
- Haskins HL. A Phonetically Balanced Test of Speech Discrimination for Children. (Master's thesis). Northwestern University. (1949). - PubMed
LinkOut - more resources
Full Text Sources