. 2022 Jan 11:12:784070.
doi: 10.3389/fmicb.2021.784070. eCollection 2021.

Replication of Dengue Virus in K562-Megakaryocytes Induces Suppression in the Accumulation of Reactive Oxygen Species

Affiliations

Replication of Dengue Virus in K562-Megakaryocytes Induces Suppression in the Accumulation of Reactive Oxygen Species

Jaskaran Kaur et al. Front Microbiol. .

Abstract

Dengue virus can infect human megakaryocytes leading to decreased platelet biogenesis. In this article, we report a study of Dengue replication in human K562 cells undergoing PMA-induced differentiation into megakaryocytes. PMA-induced differentiation in these cells recapitulates steps of megakaryopoiesis including gene activation, expression of CD41/61 and CD61 platelet surface markers and accumulation of intracellular reactive oxygen species (ROS). Our results show differentiating megakaryocyte cells to support higher viral replication without any apparent increase in virus entry. Further, Dengue replication suppresses the accumulation of ROS in differentiating cells, probably by only augmenting the activity of the transcription factor NFE2L2 without influencing the expression of the coding gene. Interestingly pharmacological modulation of NFE2L2 activity showed a simultaneous but opposite effect on intracellular ROS and virus replication suggesting the former to have an inhibitory effect on the later. Also cells that differentiated while supporting intracellular virus replication showed reduced level of surface markers compared to uninfected differentiated cells.

Keywords: Dengue virus replication; NFE2L2; flavivirus; megakaryopoiesis; reactive oxygen species.


Conflict of interest statement

The authors declare that the research was conducted in the absence of any commercial or financial relationships that could be construed as a potential conflict of interest.

Figures
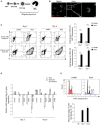
Figure 1
Figure 1
(A) Schematic diagram of megakaryopoiesis: The schematic diagram represents select stages during the differentiation of Hematopoietic stem cells (HSC) to Megakaryocytes (MKs) through Blast-forming unit-Mk (BFU-MK) and Colony-forming unit-Mk (CFU-MK). Cell enlargement and formation of multilobed nucleus has been depicted. (B) Formation of multi-lobed nucleus following PMA induced differentiation of K562 cells. K562 cells treated with either DMSO or 50 nM PMA for 6 days were stained with Alexa Fluor-568 Phalloidin and DAPI and visualized in a confocal microscope. The red color indicates the plasma membrane and blue color shows nuclei. The inset shows a cell with multilobed nucleus. (C) Expression of platelet specific surface markers: K562 cells treated with PMA for 0, 3, or 6 days were immune-stained for expression of the indicated surface marker protein using fluor-conjugated primary antibodies. The mean fluorescence intensity (MFI) corresponding to each day was quantified. For each surface marker the MFI at day 0 was arbitrarily set to 1 and those at day 3 and 6, expressed as the relative fold change with respect to that. (D) Total RNA from K562 cells treated with either DMSO or 50 nM PMA or 1 mM sodium butyrate for 3 or 6 days was extracted and purified. The RNA was reverse transcribed with random hexamers and the cDNA used for real-time PCR estimation of mRNA transcripts from indicated genes. The CT value corresponding to each was normalized to that of GAPDH. The normalized value at day 0 was taken arbitrarily as 1 and those at day 3 and 6 expressed as fold-change with respect to that. For Panels A to E, the error bars represent standard deviation obtained from 3 independent experiments. The significance was calculated by Student's t-test (*, ***, respectively, indicate P-values <0.05 and <0.001). (E) K562 cells treated with PMA for 0 or 3 or 6 days were fixed, permeabilized and stained for intracellular DNA using Propidium iodide (PI). The PI stain was quantified by flow cytometry and mean number of cells having ploidy of >4N were plotted.
Figure 2
Figure 2
DENV replication is higher in K562 cells undergoing PMA-induced differentiation: (A) K562 cells infected with DENV at an MOI of 0.1 were maintained in growth media supplemented with either DMSO or 50 nM PMA and fixed with PFA at 0 h or 3 or 6 days post-infection. The cells were then immune-stained for intracellular DENV antigen and the fluorescence quantified by flow cytometry. The fluorescence in cells fixed at 0 h was used to gate for DENV antigen positive cells. The number of antigen positive cells were quantified and plotted. (B) Total RNA from K562 cells treated similarly as in panel A was used for real-time PCR comparison of DENV RNA level at 3 or 6 days to that at 0 h, normalized to that of GAPDH mRNA. The value at 0 h was taken arbitrarily as 1 and that at other time points expressed as fold-change (FC) over that. (C) The culture supernatant of cell infected with MOI of 0.1 and subsequently treated as in (A) was collected and used for quantification of focus-forming unit/ml (FFU/ml) on Vero cell monolayers. (D) Uninfected K562 cells treated with either DMSO or PMA for 3 days were washed with PBS and incubated in either mock- or DENV inoculum (10 MOI) on ice for 2 h. The cells were then transferred to 37°C and further incubated for 2 h. Subsequently cells were washed, treated with 0.25% trypsin for 5 min and the total RNA extracted and used in real-time PCR for comparison of DENV genomic RNA normalized to GAPDH transcripts. The level in mock-infected cells was taken as 1 and that in DENV infected cells calculated as fold-change over that. For Panels A to D, the error bars represent standard deviation obtained from 3 independent experiments. The significance was calculated by Student's t-test (**, ***, respectively, indicate P-values <0.01 and <0.001 and ns, not significant).
Figure 3
Figure 3
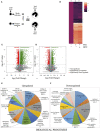
Comparison of transcriptome between uninfected and DENV-infected differentiating cells. (A) Schematic representation of the steps for analysis of differential gene regulation in uninfected or DENV-infected K562 cells, undergoing PMA-induced differentiation compared to uninfected cells at 0 h. (B) Heatmap depiction of the extent of differential regulation in the top 200 genes deregulated by PMA in uninfected cells (compare column 2 and 1) or in DENV-infected cells (compare columns 3 and 1). The transcript level at 0 h is represented by column 1 while that after 6 days of PMA treatment of uninfected or DENV-infected cells is represented by column 2 or 3, respectively. The fold change in the transcript level were transformed to the logarithmic value to the base of 2 and plotted. (C,D) Volcano plots of differentially regulated genes. (C) All genes differentially regulated in uninfected cells after 6 days of PMA-treatment compared to those at 0 h. (D) All genes that show differential regulation between uninfected and DENV-infected cells after 6 days of PMA-treatment. For both panels the differentially regulated genes were plotted with their corresponding Log2 (fold-change) in the X-axis and the -Log10 (P-value) of deregulation in the Y-axis. The vertical and horizontal broken lines, respectively, depicts the cut off-value in extent of Log2 (fold-change) to be either ≥0.58 or ≤ −1 and -Log10 (P-value) of ≥1.3 (P-value of ≤ 0.05), for genes to be considered significantly deregulated. The significantly upregulated and downregulated genes are marked with green and red circles, respectively, while genes that do not show significant deregulation by both criterion are marked with gray circles. (E,F) The differentially regulated genes shown in (D) were classified according to their enrichment, based on Gene Ontology (GO) term of “Biological process,” using GeneCodis (Nogales-Cadenas et al., 2009). The top 10 enriched GO terms were represented by pie charts with the size of the slices being numerically proportional to the number of genes under each term. The upregulated and downregulated genes are represented in different pie-charts as indicated. The legend indicating each slice shows the GO term and the number of genes classified under it.
Figure 4
Figure 4
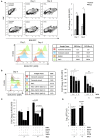
DENV replication suppresses PMA-induced ROS accumulation. (A) PMA-induced differentiation leads to ROS accumulation. K562 cells either untreated or treated with either DMSO or 50 nM PMA for a period of either 3 or 6 days, were stained with H2DCFDA and the fluorescence quantified in a flow cytometer. The relative fold change in MFI in cells treated with either DMSO or PMA- was plotted. (B) DENV infection suppresses ROS accumulation. Cytosolic ROS in K562 cells either uninfected or infected with DENV at the indicated MOI and subsequently treated with PMA for either 3 or 6 days, was quantified by H2DCFDA staining as described above. The ROS level in uninfected cells was arbitrarily taken as 1 and that in others expressed as fold-change with respect to that. (C) K562 cells either uninfected or suppression of ROS accumulation is a consequence of virus replication. infected with DENV with an MOI of 1.0 were treated with PMA in the presence of either 3 mM of N-acetyl cysteine (NAC) or 10 μM NITD008 (NITD). At either 3 or 6 days post-infection, the cytosolic ROS quantified by H2DCFDA staining as described above. The ROS level in uninfected cells at day 3 was arbitrarily taken as 1 and that in others expressed as fold-change with respect to that. (D) K562 cells infected with DENV at an MOI of 1.0 were differentiated with PMA in the presence of either 3 mM of N-acetyl cysteine (NAC) or 10 μM NITD008 (NITD). The supernatant was collected at 3 or 6 days post-infection and the infectious titer of secreted virus quantified by Focus-forming unit (FFU) assay. The Log10 of the FFU/ml was calculated and plotted. For Panels A to D, the error bars represent standard deviation obtained from 3 independent experiments and the significance calculated by Student's t-test either mentioned or indicated by as * (*, **, and ***, respectively, indicate P-values <0.05, <0.01, and <0.001).
Figure 5
Figure 5
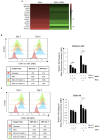
DENV replication suppresses ROS in differentiating cells by upregulation of NFE2L2 activity. (A) K562 cells either uninfected or infected with DENV at an MOI of 1.0 were differentiated with 50 nM PMA in the absence or presence of 10 μM of RA839. At 3 or 6 days post-infection the cytosolic ROS was quantified by H2DCFDA staining as described above. (B) K562 cells infected with DENV at an MOI of 1.0 were differentiated with PMA in the absence or presence of 10 μM of RA839. The supernatant was collected at 3 or 6 days post-infection and the infectious titer of secreted virus quantified by Focus-forming unit (FFU) assay. The Log10 of the FFU/ml was calculated and plotted. (C) K562 cells either uninfected or infected with DENV at an MOI of 1.0 were differentiated with PMA in the absence or presence of 10 μM of ML385. At 3 or 6 days post-infection the cytosolic ROS was quantified by H2DCFDA staining as described above. (D) K562 cells infected with DENV at an MOI of 1.0 were differentiated with PMA in the absence or presence of 10 μM of ML385. The culture supernatant was collected at 3 or 6 days post-infection and the infectious titer of secreted virus quantified by Focus-forming unit (FFU) assay. The Log10 of the FFU/ml was calculated and plotted. (A–D) The error bars represent standard deviation obtained from 3 independent experiments and the P-values of significance calculated by Student's t-test are indicated.
Figure 6
Figure 6
DENV replication reduces expression of MK-specific surface markers in differentiating cells. (A) Heatmap showing transcriptional downregulation of genes associated with GO biological process; Cell Adhesion (GO: 0007155) in infected cells differentiated with PMA for 6 days when compared to uninfected controls. (B,C) K562 cells either uninfected or infected with DENV at the indicated MOI were differentiated with PMA. At 3 or 6 days post-infection, the surface expression of the indicated marker proteins was quantified by fluor-conjugated primary antibodies in a flow cytometer. The mean fluorescence intensity (MFI) corresponding to each marker was plotted. The error bars represent standard deviation obtained from 3 independent experiments. The significance was calculated by Student's t-test (**, ***, respectively, indicate P-values <0.01 and <0.001).

Similar articles

Cited by

References

    1. Cecchetti L., Tolley N. D., Michetti N., Bury L., Weyrich A. S., Gresele P. (2011). Megakaryocytes differentially sort mRNAs for matrix metalloproteinases and their inhibitors into platelets: a mechanism for regulating synthetic events. Blood 118, 1903–1911. 10.1182/blood-2010-12-324517 - DOI - PMC - PubMed
    1. Chaman N., Iqbal M. A., Siddiqui F. A., Gopinath P., Bamezai R. N. (2015). ERK2-pyruvate kinase axis permits phorbol 12-myristate 13-acetate-induced megakaryocyte differentiation in K562 cells. J. Biol. Chem. 290, 23803–23815. 10.1074/jbc.M115.657411 - DOI - PMC - PubMed
    1. Chen S., Su Y., Wang J. (2013). ROS-mediated platelet generation: a microenvironment-dependent manner for megakaryocyte proliferation, differentiation, and maturation. Cell. Death. Dis. 4:e722. 10.1038/cddis.2013.253 - DOI - PMC - PubMed
    1. Chen Z., Hu M., Shivdasani R. A. (2007). Expression analysis of primary mouse megakaryocyte differentiation and its application in identifying stage-specific molecular markers and a novel transcriptional target of NF-E2. Blood 109, 1451–1459. 10.1182/blood-2006-08-038901 - DOI - PMC - PubMed
    1. Choi K., Ryu S., Song H, Choi S., Kang H., Choi S. W. (2010). Caspase-dependent generation of reactive oxygen species in human astrocytoma cells contributes to resistance to TRAIL-mediated apoptosis. Cell. Death Differ. 17, 833–845. 10.1038/cdd.2009.154 - DOI - PubMed