. 2021 Dec 16;21(24):18247-18261.
doi: 10.5194/acp-21-18247-2021.

Modeling secondary organic aerosol formation from volatile chemical products

Affiliations

Modeling secondary organic aerosol formation from volatile chemical products

Elyse A Pennington et al. Atmos Chem Phys. .

Abstract

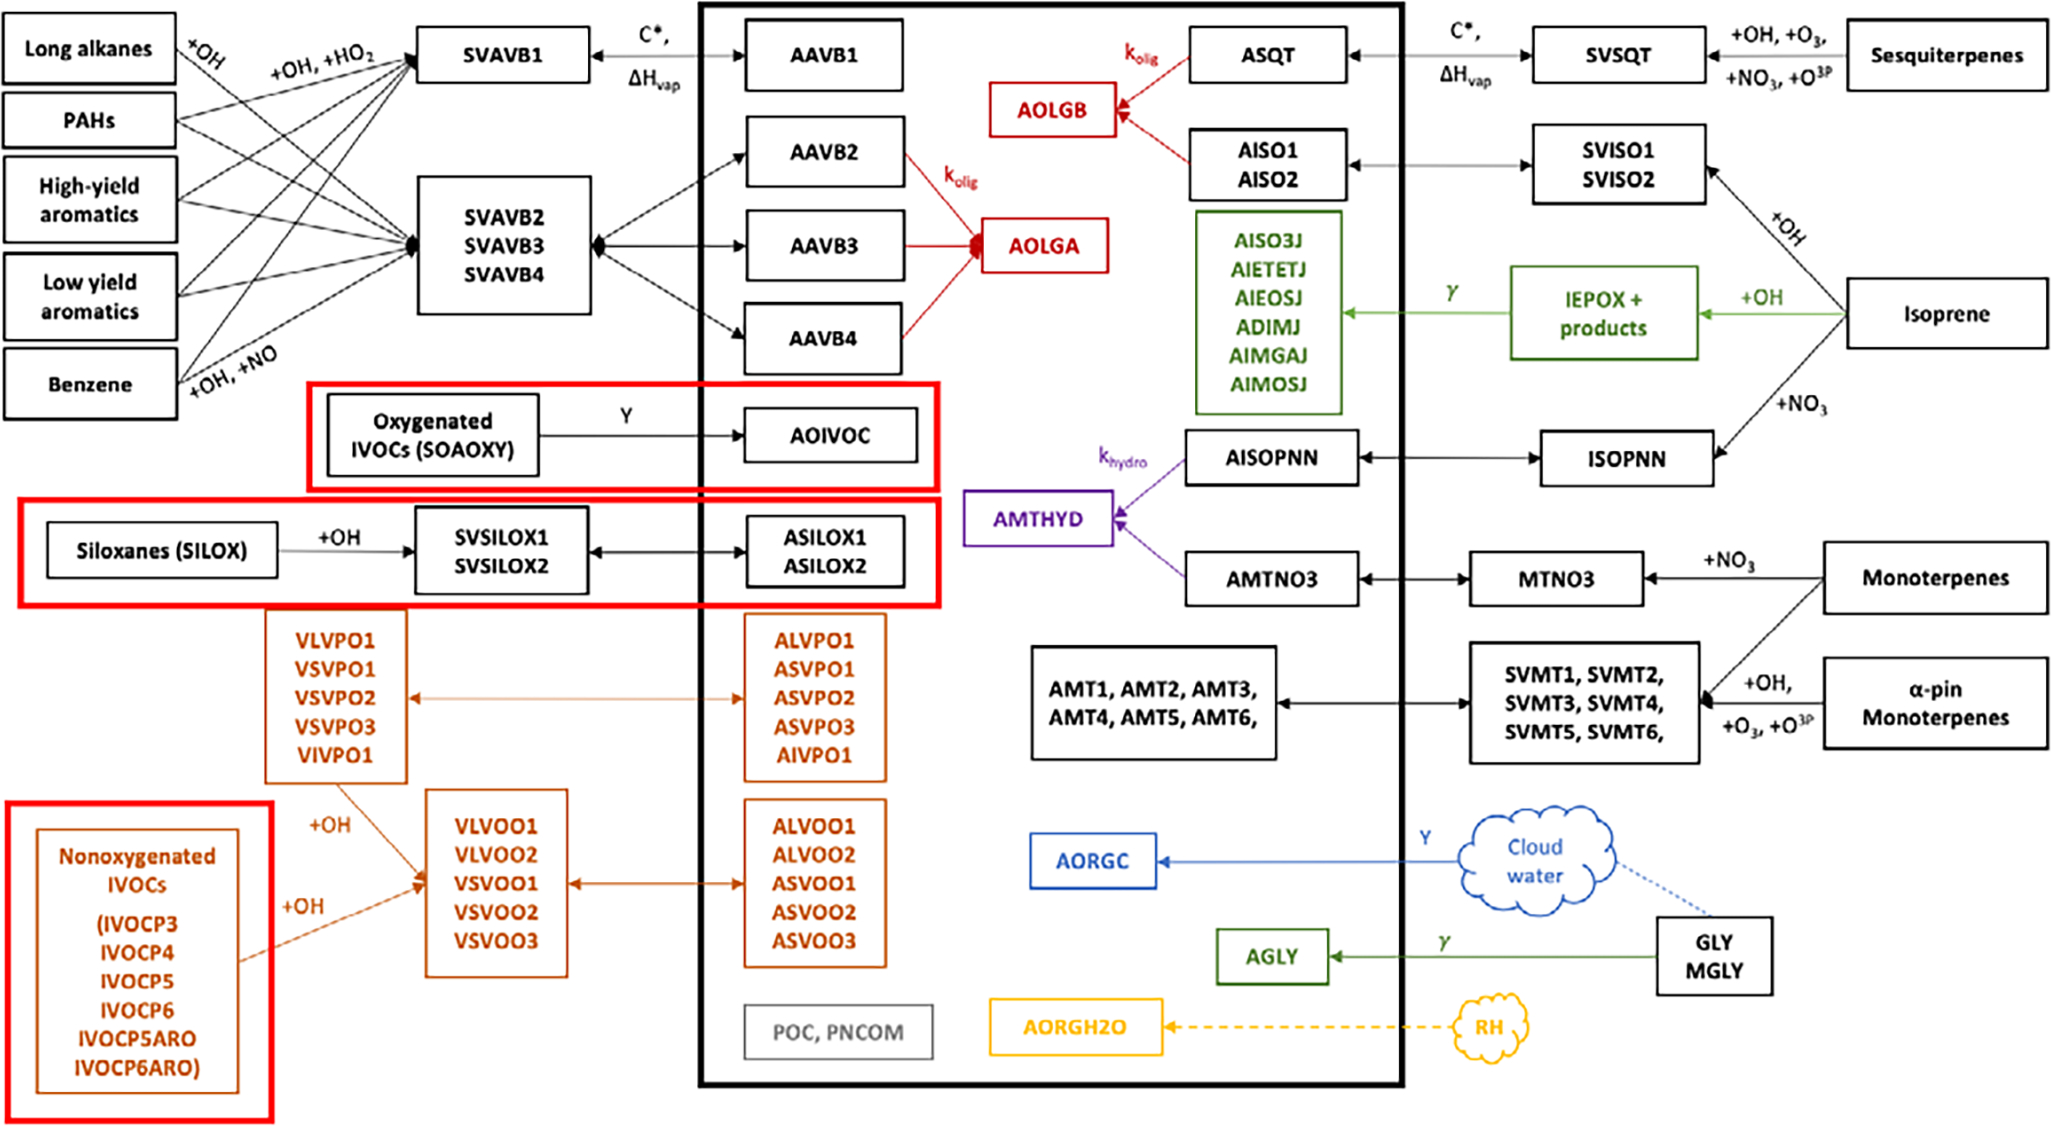
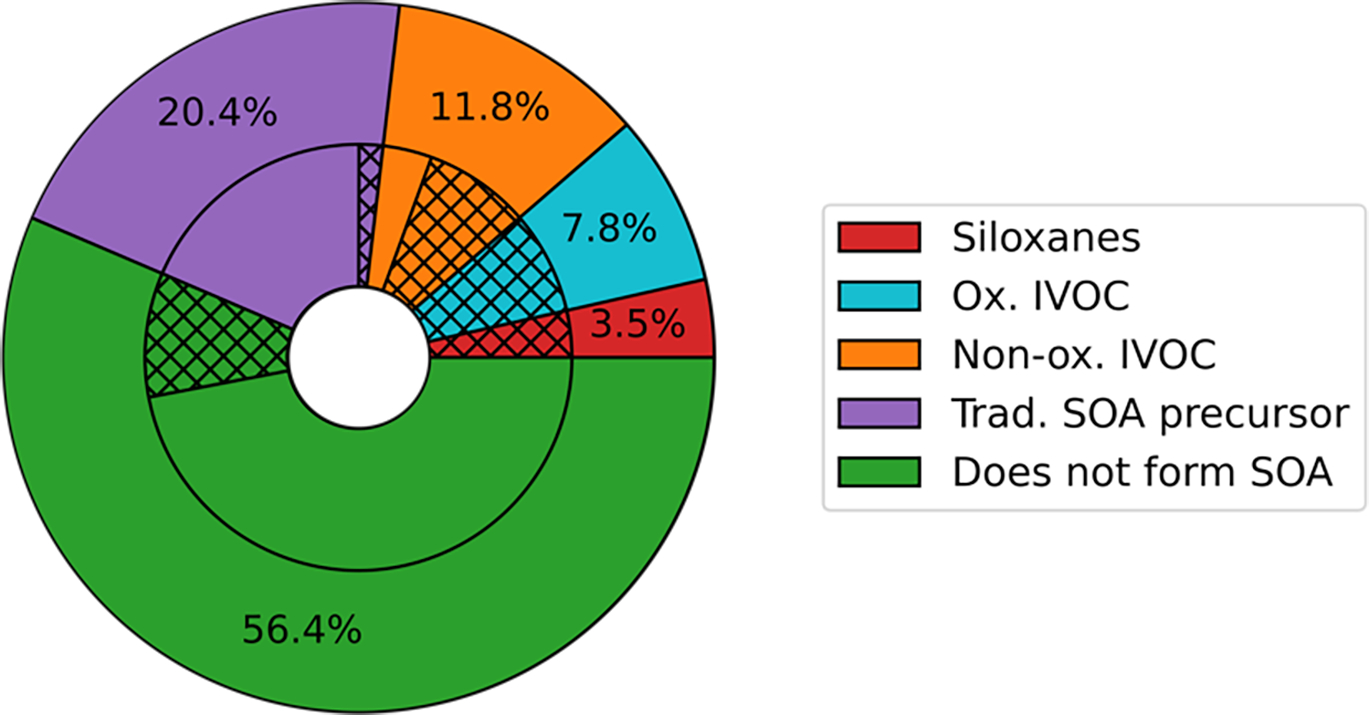
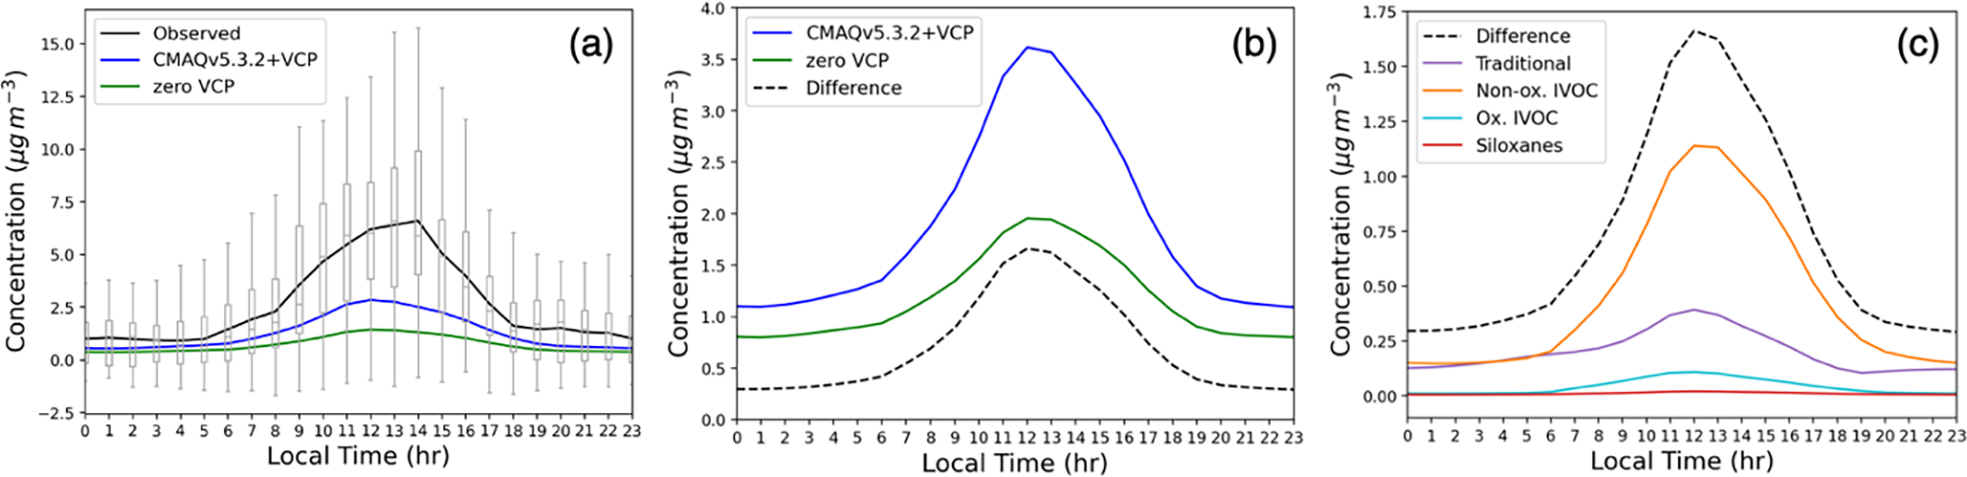
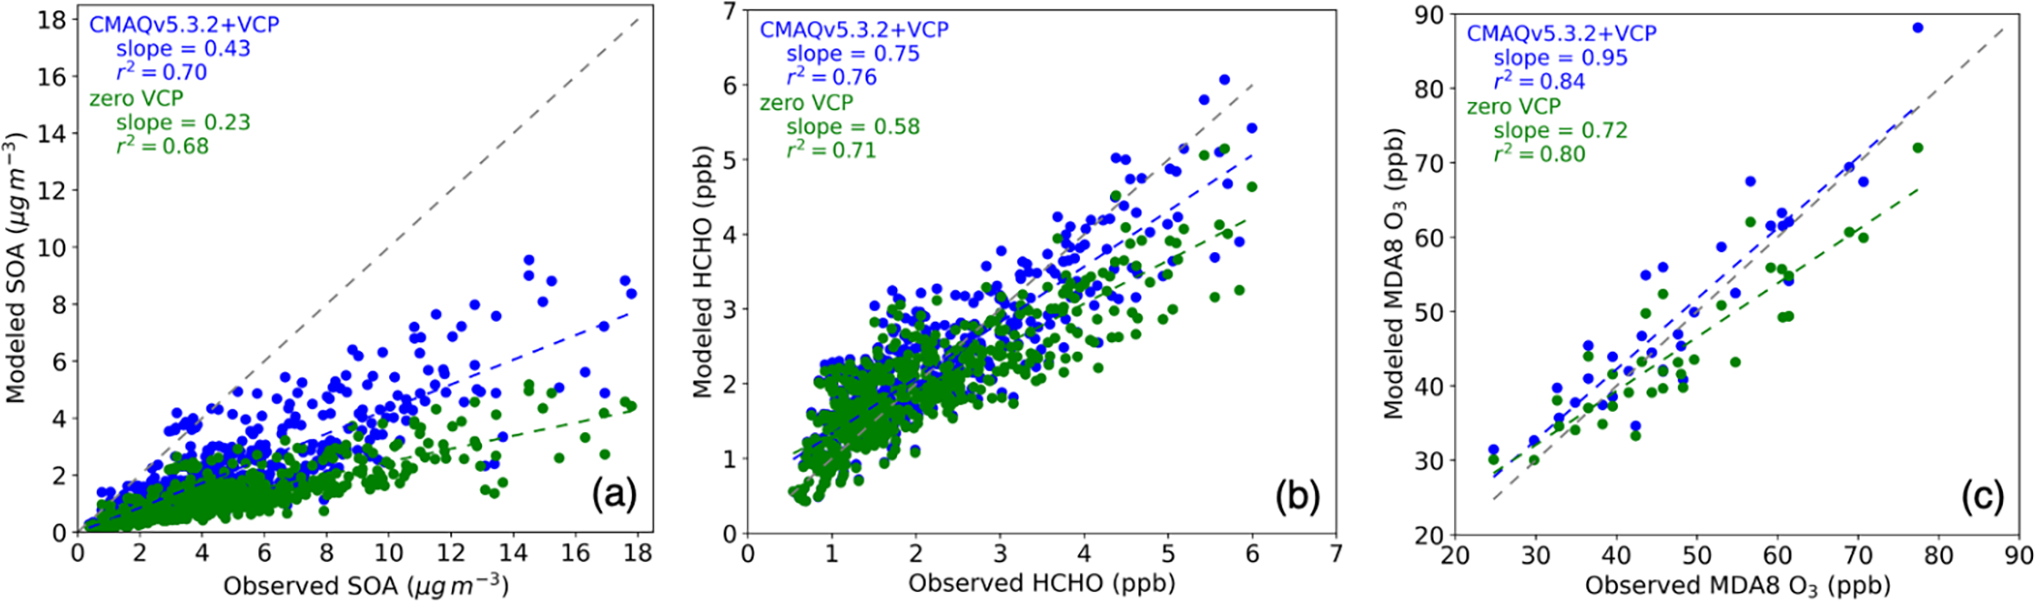
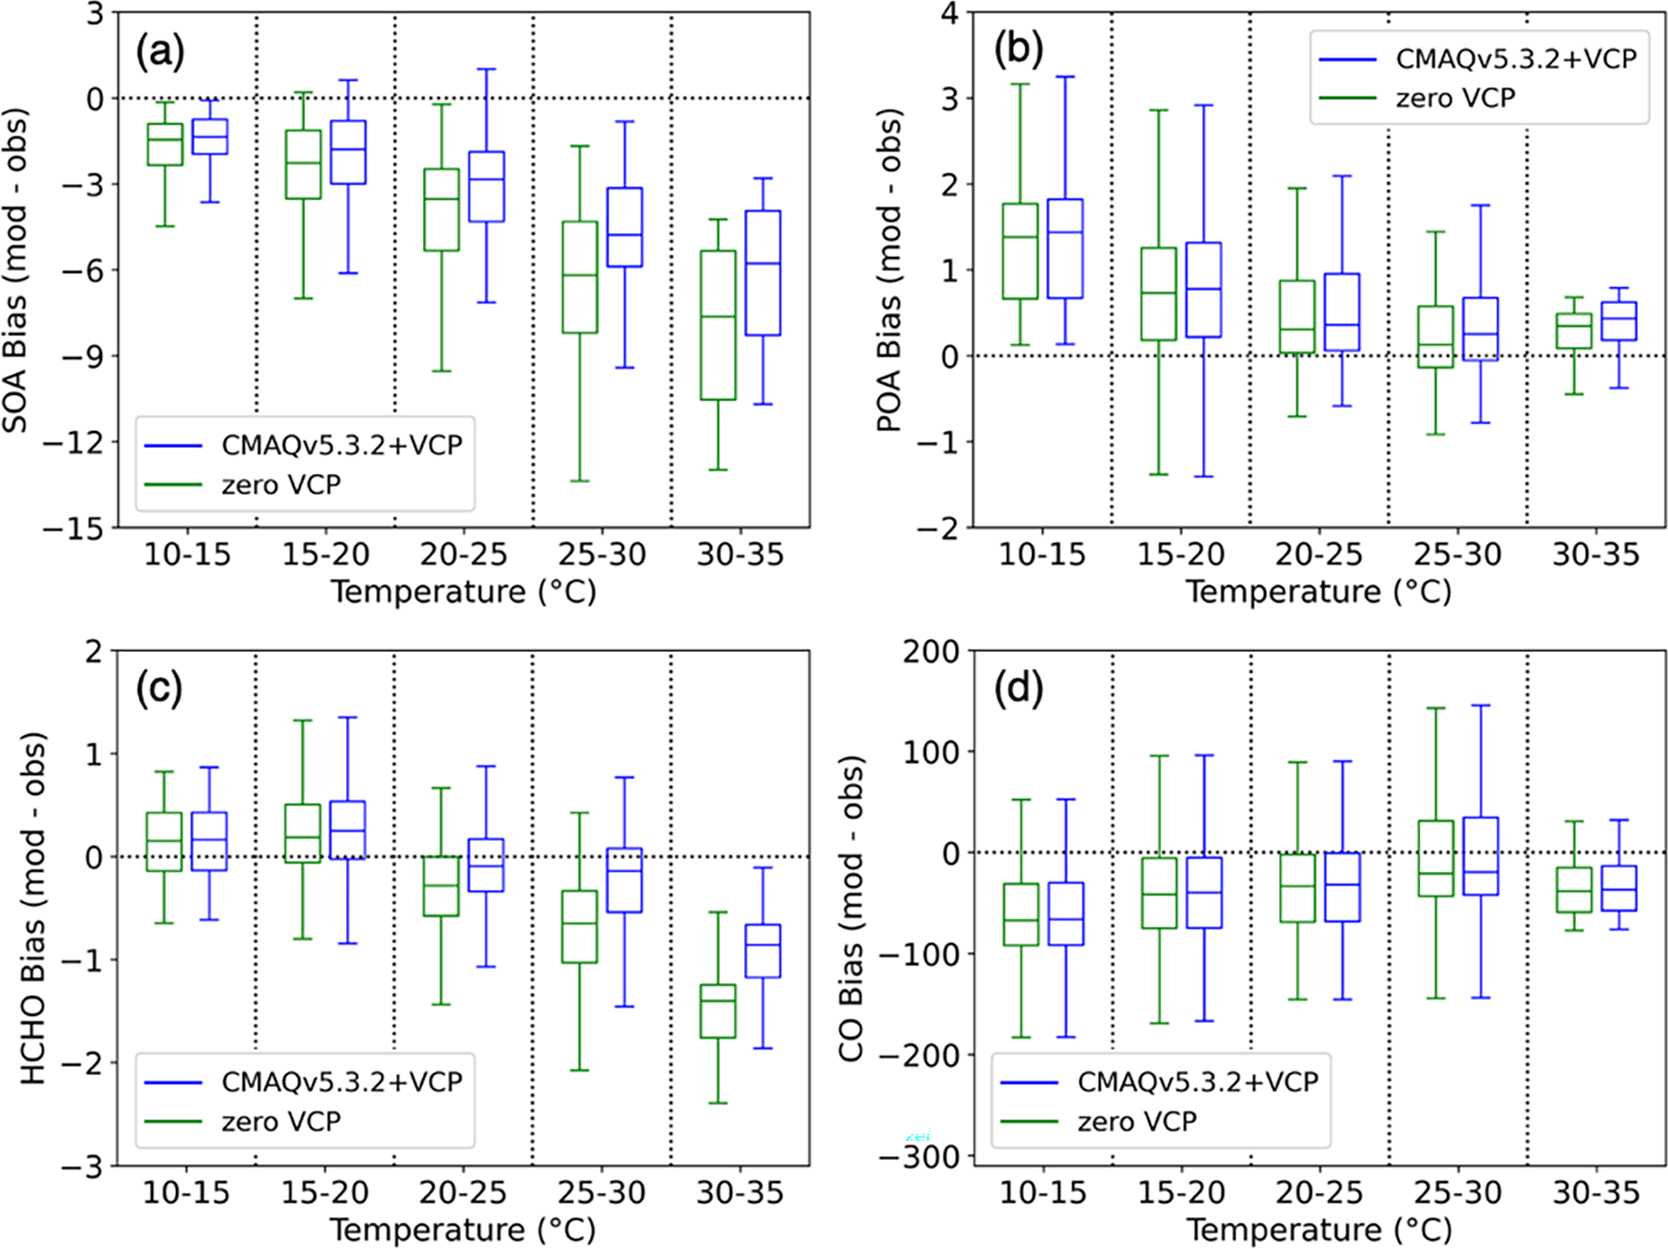
Volatile chemical products (VCPs) are commonly-used consumer and industrial items that are an important source of anthropogenic emissions. Organic compounds from VCPs evaporate on atmospherically relevant time scales and include many species that are secondary organic aerosol (SOA) precursors. However, the chemistry leading to SOA, particularly that of intermediate volatility organic compounds (IVOCs), has not been fully represented in regional-scale models such as the Community Multiscale Air Quality (CMAQ) model, which tend to underpredict SOA concentrations in urban areas. Here we develop a model to represent SOA formation from VCP emissions. The model incorporates a new VCP emissions inventory and employs three new classes of emissions: siloxanes, oxygenated IVOCs, and nonoxygenated IVOCs. VCPs are estimated to produce 1.67 μg m-3 of noontime SOA, doubling the current model predictions and reducing the SOA mass concentration bias from -75% to -58% when compared to observations in Los Angeles in 2010. While oxygenated and nonoxygenated intermediate volatility VCP species are emitted in similar quantities, SOA formation is dominated by the nonoxygenated IVOCs. Formaldehyde and SOA show similar relationships to temperature and bias signatures indicating common sources and/or chemistry. This work suggests that VCPs contribute up to half of anthropogenic SOA in Los Angeles and models must better represent SOA precursors from VCPs to predict the urban enhancement of SOA.


Conflict of interest statement

Competing Interests The authors declare that they have no competing interests.

Figures

Figure 1.
Figure 1.
Treatment of OA chemistry in the CMAQv5.3.2+VCP model. The thick black box surrounds all aerosol-phase species. All smaller black boxes depict species undergoing gas-phase oxidation from VOCs to semivolatile or nonvolatile SOA species. Orange font depicts the VBS model for S/IVOCs. Red font depicts particle-phase accretion reactions while purple font depicts particle-phase hydrolysis reactions. Green font represents heterogeneous processes. Blue font shows cloud-processed aerosol and yellow font shows aerosol water associated with the organic phase. Gray boxes are nonvolatile primary organic aerosol (POA) species. Double-sided arrows represent reversible processes and one-sided arrows represent irreversible processes. Dashed lines represent processes that are dependent on relative humidity. The diagram includes the AERO7 mechanism plus the three VCP-forming pathways specific to this work (thick boxes in red). See AE7I Species Table (2016/2021) for species descriptions.
Figure 2.
Figure 2.
Percentage of the VCP emissions assigned to each category of CMAQ surrogates using the SAPRC07TIC_AE7I_VCP speciation profiles. The total rate of VCP emissions in Los Angeles County is 8.3 × 10⁷ kg yr−1. The outer ring depicts the percentage of total VCPy-derived emissions assigned to each of the three new VCP categories (siloxanes in red, oxygenated IVOCs in blue, and nonoxygenated IVOCs in orange), the traditional SOA precursors described by existing model surrogates (purple), and existing surrogates that do not form SOA (green). The inner ring gives an indication of the original assignments of each of the outer ring categories. Hatching indicates emissions originally assigned to model surrogates that do not participate in model chemistry: IVOC, NVOL, and NROG. Solid colors represent other surrogate assignments.
Figure 3.
Figure 3.
a) Average hourly concentrations of background-corrected PM1 SOA observed and simulated by the zero VCP and CMAQv5.3.2+VCP modeling cases May 15-June 15. Box and whiskers show all hourly concentrations observed by AMS at the CalNex site. A constant background value was removed from all observed concentrations according to the method in Hayes et al. (2015). The background value of each simulation was determined by averaging the lower 50% of hourly concentrations from 00:00 LT to 04:00 LT and subtracting that from each curve. b) Average hourly concentration of total (not size-resolved) SOA for the two simulation cases and their difference (CMAQv5.3.2+VCP – zero VCP). c) Difference in hourly concentrations of total SOA by category.
Figure 4.
Figure 4.
Modeled concentrations predicted by CMAQ zero VCP case (green) and CMAQv5.3.2+VCP case (blue) vs. observations from the CalNex Pasadena ground site. The line with a slope of 1 is indicated with a gray dashed line. a) Hourly PM1 SOA. b) Hourly formaldehyde (HCHO). c) MDA8 O3. Background values were not removed from any panels.
Figure 5.
Figure 5.
Bias (modeled - observed) of hourly concentrations vs. modeled temperature for the zero VCP case (green) and CMAQv5.3.2+VCP case (blue). Hourly concentrations are binned into five temperature ranges of 5°C each and the data in each bin is represented by a box-and-whisker plot. The horizontal midline depicts the median of the data, the edges of the box extend from the lower to upper quartile of the data, and the whiskers extend from the minimum to the maximum of the data. a) PM1 SOA bias (μg m−3). b) PM1 POA bias (μg m−3). c) Formaldehyde (HCHO) bias (ppb). d) CO bias (ppb).

References

    1. AE7I Species Table. (2021). U.S. Environmental Protection Agency. https://github.com/USEPA/CMAQ/blob/72ec4e5681e1ed0b4917792a9a240b0302a30... (Original work published 2016)
    1. Appel KW, Bash JO, Fahey KM, Foley KM, Gilliam RC, Hogrefe C, Hutzell WT, Kang D, Mathur R, Murphy BN, Napelenok SL, Nolte CG, Pleim JE, Pouliot GA, Pye HOT, Ran L, Roselle SJ, Sarwar G, Schwede DB, … Wong DC (2021). The Community Multiscale Air Quality (CMAQ) model versions 5.3 and 5.3.1: System updates and evaluation. Geoscientific Model Development, 14(5), 2867–2897. 10.5194/gmd-14-2867-2021 - DOI - PMC - PubMed
    1. Baker KR, Carlton AG, Kleindienst TE, Offenberg JH, Beaver MR, Gentner DR, Goldstein AH, Hayes PL, Jimenez JL, Gilman JB, Gouw J. A. de, Woody MC, Pye HOT, Kelly JT, Lewandowski M, Jaoui M, Stevens PS, Brune WH, Lin Y-H, … Surratt JD (2015). Gas and aerosol carbon in California: Comparison of measurements and model predictions in Pasadena and Bakersfield. Atmospheric Chemistry and Physics, 15(9), 5243–5258. 10.5194/acp-15-5243-2015 - DOI
    1. Bash JO, Baker KR, & Beaver MR (2016). Evaluation of improved land use and canopy representation in BEIS v3.61 with biogenic VOC measurements in California. Geoscientific Model Development, 9(6), 2191–2207. 10.5194/gmd-9-2191-2016 - DOI
    1. Binkowski FS, & Roselle SJ (2003). Models-3 Community Multiscale Air Quality (CMAQ) model aerosol component 1. Model description. Journal of Geophysical Research: Atmospheres, 108(D6). 10.1029/2001JD001409 - DOI

LinkOut - more resources