. 2021 Feb 22;13(1):e0314421.
doi: 10.1128/mBio.03144-21. Epub 2022 Jan 4.

Candida albicans Enhances the Progression of Oral Squamous Cell Carcinoma In Vitro and In Vivo

Affiliations

Candida albicans Enhances the Progression of Oral Squamous Cell Carcinoma In Vitro and In Vivo

Máté Vadovics et al. mBio. .

Abstract

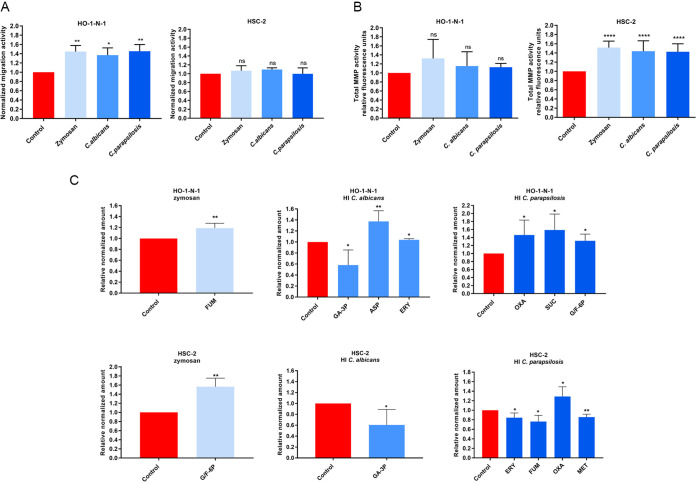
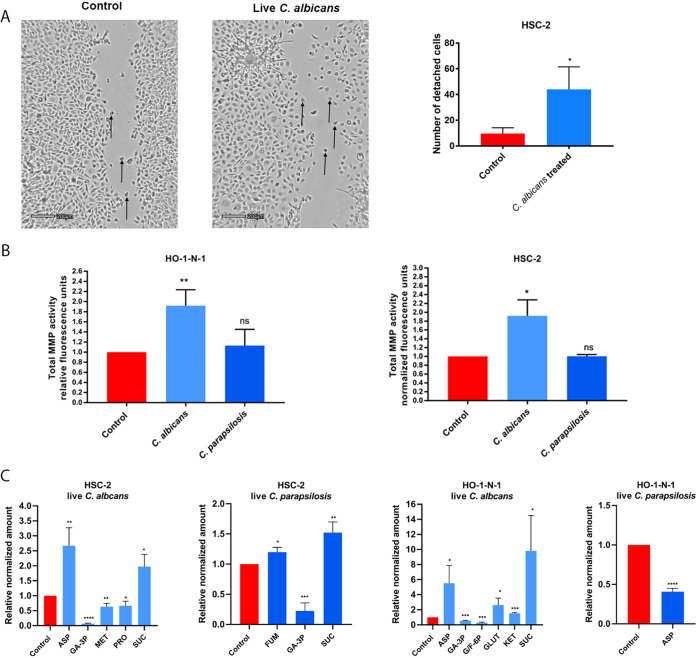
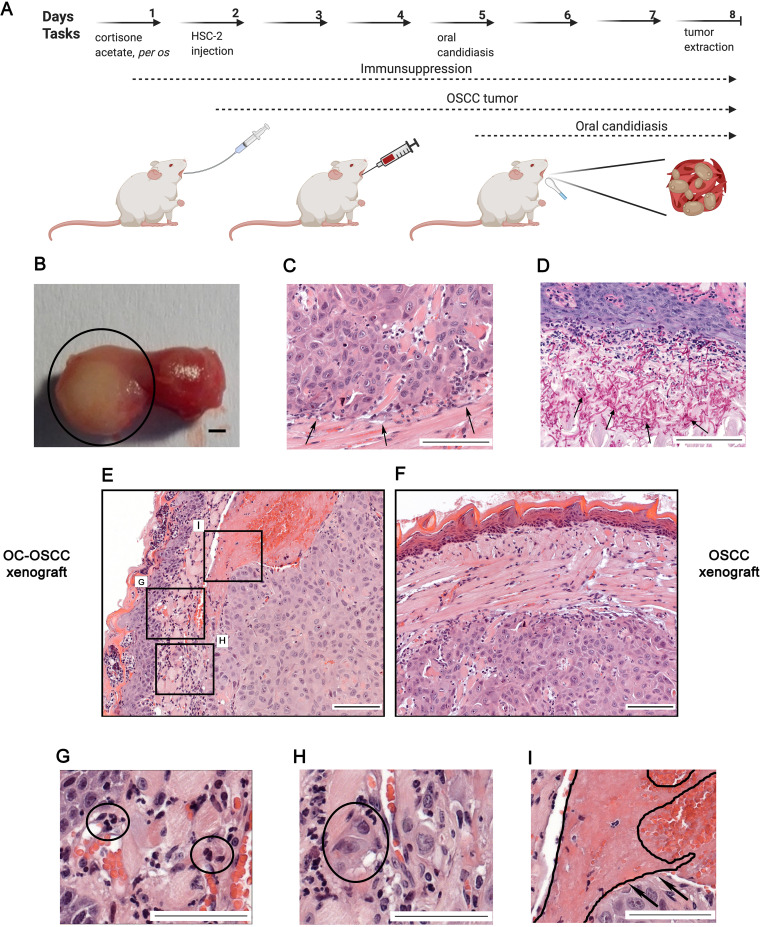
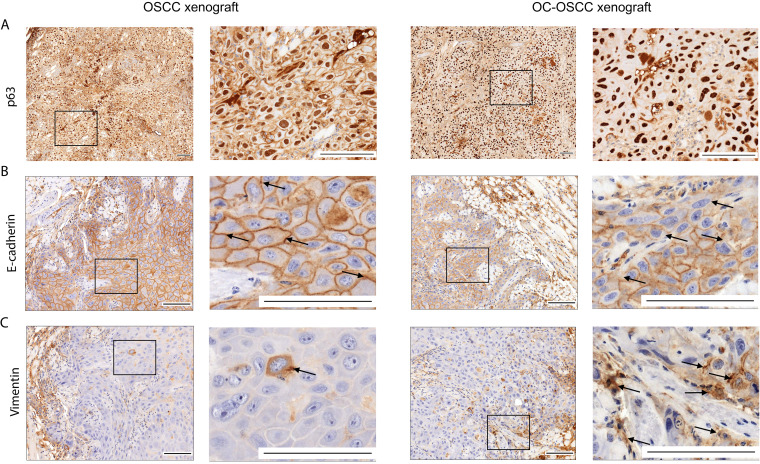
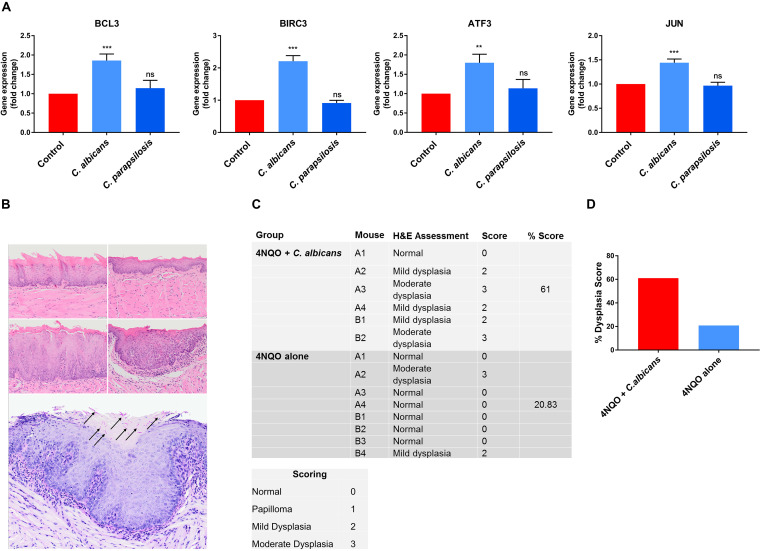
Oral squamous cell carcinoma (OSCC) is associated with oral Candida albicans infection, although it is unclear whether the fungus promotes the genesis and progression of OSCC or whether cancer facilitates fungal growth. In this study, we investigated whether C. albicans can potentiate OSCC tumor development and progression. In vitro, the presence of live C. albicans, but not Candida parapsilosis, enhanced the progression of OSCC by stimulating the production of matrix metalloproteinases, oncometabolites, protumor signaling pathways, and overexpression of prognostic marker genes associated with metastatic events. C. albicans also upregulated oncogenes in nonmalignant cells. Using a newly established xenograft in vivo mouse model to investigate OSCC-C. albicans interactions, oral candidiasis enhanced the progression of OSCC through inflammation and induced the overexpression of metastatic genes and significant changes in markers of the epithelial-mesenchymal transition. Finally, using the 4-nitroquinoline 1-oxide (4NQO) murine model, we directly correlate these in vitro and short-term in vivo findings with the progression of oncogenesis over the long term. Taken together, these data indicate that C. albicans upregulates oncogenes, potentiates a premalignant phenotype, and is involved in early and late stages of malignant promotion and progression of oral cancer. IMPORTANCE Oral squamous cell carcinoma (OSCC) is a serious health issue worldwide that accounts for 2% to 4% of all cancer cases. Previous studies have revealed a higher yeast carriage and diversity in oral cancer patients than in healthy individuals. Furthermore, fungal colonization in the oral cavity bearing OSCC is higher on the neoplastic epithelial surface than on adjacent healthy surfaces, indicating a positive association between oral yeast carriage and epithelial carcinoma. In addition to this, there is strong evidence supporting the idea that Candida contributes to carcinogenesis events in the oral cavity. Here, we show that an increase in Candida albicans burden promotes an oncogenic phenotype in the oral cavity.

Keywords: Candida albicans; cancer; oral squamous cell carcinoma; progression.


Conflict of interest statement

The authors declare no conflict of interest.

Figures

FIG 1
FIG 1
Effects of HI Candida and zymosan on HO-1-N-1 and HSC-2 oral squamous cell carcinoma cells in vitro. (A) Normalized migration activity of OSCC cells in the presence of HI C. albicans, HI C parapsilosis, and zymosan measured by a wound healing assay (n = 3). (B) Normalized total secreted matrix metalloproteinase (MMP) activity of OSCC cells in the presence of HI C. albicans, HI C. parapsilosis, and zymosan measured by a total MMP activity kit (n = 4). (C) Normalized amounts of metabolites of OSCC cells in the presence of HI C. albicans, HI C. parapsilosis, and zymosan as measured by HPLC-HRMS (n = 4). FUM, fumaric acid; GA-3P, glyceraldehyde-3P; ASP, aspartic acid; ERY, erythrose-4P; OXA, oxaloacetic acid; SUC, succinic acid; G/F-6P, glucose/fructose-6p; MET, methionine; control, tumor cells without any treatment. Unpaired t test; *, P ≤ 0.05; **, P ≤ 0.01; ****, P ≤ 0.0001. ns, nonsignificant.
FIG 2
FIG 2
Effects of live Candida on HO-1-N-1 and HSC-2 oral squamous cell carcinoma cells in vitro. (A) Pictures from time-lapse videos of cellular migration of HSC-2 cells, with arrows pointing to detached cancer cells. The left picture shows the control cells, and the right shows the live C. albicans-treated cells. The graph shows the number of detached cells (n = 3). (B) Normalized total secreted matrix metalloproteinase activity of OSCC cells in the presence of live C. albicans and C. parapsilosis as obtained by a total MMP activity kit (n = 3). (C) Normalized amounts of metabolites of OSCC cells in the presence of live C. albicans and live C. parapsilosis as measured by HPLC-HRMS (n = 3). ASP, aspartic acid; GA-3P, glyceraldehyde-3P; MET, methionine; PRO, proline; SUC, succinic acid; FUM, fumaric acid; G/F-6P, glucose/fructose-6p; GLUT, glutamic acid; KET, α-ketoglutaric acid. Control, tumor cells without any treatment. Unpaired t test; *, P ≤ 0.05; **, P ≤ 0.01; ***, P ≤ 0.001; ****, P ≤ 0.0001.
FIG 3
FIG 3
In vitro transcriptomic analysis. Candida albicans activates genes and signaling pathways involved in the OSCC metastatic processes. (A) Number of up- or downregulated genes of HSC-2 and HO-1-N-1 cells after different fungal treatments (n = 3). C.a., C. albicans; C.p., C. parapsilosis (B) Venn diagram of up- or downregulated genes in HSC-2 cells in the presence of live C. albicans and OSCC invasion marker genes found in the literature. sig., significantly. (C) Venn diagram of up- or downregulated genes in the HSC-2 cell line in the presence of live C. albicans and EMT marker genes in HNSCC according to a single-cell sequencing study. (D) Venn diagram of up- or downregulated genes in HO-1-N-1 cells incubated with live C. albicans and OSCC invasion marker genes found in the literature. (E) Venn diagram of up- or downregulated genes in the HO-1-N-1 cell line in the presence of live C. albicans and EMT marker genes in HNSCC according to a single-cell sequencing study. (F) Signaling pathways that are key regulators of the OSCC invasion processes that were significantly activated in HSC-2 cells in the presence of live C. albicans. (G) Graph showing log2 fold change of C. albicans-induced genes in HSC-2 cells involved in OSCC invasion according to the literature and of single-cell sequencing (scSeq) results from 18 patients with HNSCC. Red columns represent OSCC marker genes according to the literature and scSEQ data. (H) Graph showing log2 fold change of C. albicans-induced genes in HO-1-N-1 cells involved in OSCC invasion according to the literature and scSEQ data. Red columns represent OSCC marker genes according to the literature and scSEQ data. (I) Causal analyses of the genes for which expression changed in HSC-2 cells after live Candida albicans treatment.
FIG 4
FIG 4
A new in vivo mouse model for the investigation of oropharyngeal candidiasis on the progression of OSCC. (A) Schematic figure of mouse xenograft for the investigation of the effect of C. albicans on the progression of OSCC. Immunosuppression and injection of human HSC-2 OSCC cells into the tongue of mice (OSCC xenograft). OSCC xenograft and oral candidiasis (OC-OSCC xenograft). The cartoon was produced by BioRender. (B) Representative mouse tongue on the 8th day of the experiment (7 days after tumor cell injection). The circle highlights the tumor. Scale bar, 1 mm. (C) Histopathological image of the tumor on the 8th day, with black arrows indicating the tumor edge. Scale bar, 100 μm. (D) Histopathological examination of the tumor on the 8th day (7 days after tumor injection and 3 days postinfection), with black arrows indicating the fungal hyphae in the mucosa. Scale bar, 100 μm. (E) Histopathological picture of the tumor on the 8th day after HSC-2 injection and oral candidiasis. Scale bar, 100 μm. (F) Histopathological picture of the tongue on the 8th day after HSC-2 injection. Scale bar, 100 μm. (G) Infiltrating immune cells in OC-OSCC xenograft samples indicating that C. albicans caused inflammation. Scale bar, 100 μm. (H) Detached budding tumor cells in OC-OSCC xenograft samples indicating epithelial-to-mesenchymal transition. Scale bar, 100 μm. (I) Thrombosis in OC-OSCC xenograft samples. Scale bar, 100 μm. Created by BioRender.
FIG 5
FIG 5
Histopathological staining of OSCC and OC-OSCC xenograft tumor samples: p63 staining (A), E-cadherin staining (B), and vimentin staining (C). Scale bars, 100 μm. n = 8/group. Squares indicate the magnified sections (right panels per mice model) of each tissue sample. Arrows indicate the E-cadherin positive (upper panels) and vimentin positive (lower panels) cells.
FIG 6
FIG 6
Transcriptomic analysis of in vivo tumor samples followed by oral candidiasis. (A) Schematic figure of mRNA sequencing of OSCC xenograft and OC-OSCC xenograft tumor samples. The cartoon was produced by BioRender. (B) Venn diagram of up- or downregulated genes in HSC-2 cells in the presence of live C. albicans and OSCC invasion marker genes described in the literature. (C) Venn diagram of up- or downregulated genes in HSC-2 cell line in the presence of live C. albicans and EMT marker genes in HNSCC according to a single-cell sequencing study. (D) Graph showing log2 fold change of C. albicans-induced genes in HSC-2 cells involved in OSCC invasion according to the literature and single-cell sequencing data. Red columns represent OSCC marker genes according to both the literature and single-cell sequencing (scSeq) results from 18 patients with HNSCC. (E) Tumor invasion genes showing upregulated expression both in vitro and in vivo. For transcriptomic analysis, n = 4. Created by BioRender.
FIG 7
FIG 7
(A) Gene expression of carcinogens in OKF6/TERT2 immortalized cells; (B to D) C. albicans-infected mice exhibited enhanced dysplastic tongue features in the 4NQO model. (A) qPCR results of selected carcinogens in OKF6/TERT2 immortalized cells. (B) Representative photomicrographs of murine oral mucosa demonstrating normal dorsal tongue (top row, left), normal ventral tongue (top row, right), mild epithelial dysplasia on dorsal tongue (middle row, left), and moderate epithelial dysplasia on ventral tongue (middle row, right) (H&E; scale bar, 50 μm). C. albicans hyphae (black arrows) were present in the keratin layer overlying a focus of moderate dysplasia (bottom panel). (C) Each mouse tongue was assessed and graded for atypical architectural and cytological criteria by a qualified histopathologist (normal = 0, papilloma = 1, mild dysplasia = 2, moderate dysplasia = 3), and the percentage score (sum of each group divided by the highest possible score) was calculated per group. (D) Graphical representation of panel C showing the dysplasia score. n = 6 for the 4NQO plus C. albicans group; n = 8 for the 4NQO-alone group. Scale bar, 50 μm. Unpaired t test; **, P ≤ 0.01; ***, P ≤ 0.001.

References

    1. Markopoulos AK. 2012. Current aspects on oral squamous cell carcinoma. Open Dent J 6:126–130. doi:10.2174/1874210601206010126. - DOI - PMC - PubMed
    1. Bray F, Ferlay J, Soerjomataram I, Siegel RL, Torre LA, Jemal A. 2018. Global cancer statistics 2018: GLOBOCAN estimates of incidence and mortality worldwide for 36 cancers in 185 countries. CA Cancer J Clin 68:394–424. doi:10.3322/caac.21492. - DOI - PubMed
    1. Choi S, Myers JN. 2008. Molecular pathogenesis of oral squamous cell carcinoma: implications for therapy. J Dent Res 87:14–32. doi:10.1177/154405910808700104. - DOI - PubMed
    1. Diz P, Meleti M, Diniz-Freitas M, Vescovi P, Warnakulasuriya S, Johnson NW, Kerr AR. 2017. Oral and pharyngeal cancer in Europe: incidence, mortality and trends as presented to the Global Oral Cancer Forum. Transl Res Oral Oncol 2:2057178X1770151. doi:10.1177/2057178X17701517. - DOI
    1. Subapriya R, Thangavelu A, Mathavan B, Ramachandran CR, Nagini S. 2007. Assessment of risk factors for oral squamous cell carcinoma in Chidambaram, Southern India: a case-control study. Eur J Cancer Prev 16:251–256. doi:10.1097/01.cej.0000228402.53106.9e. - DOI - PubMed

Publication types