. 2022 Jan 28;8(4):eabk0445.
doi: 10.1126/sciadv.abk0445. Epub 2022 Jan 28.

Parallel evolution of a splicing program controlling neuronal excitability in flies and mammals

Affiliations

Parallel evolution of a splicing program controlling neuronal excitability in flies and mammals

Antonio Torres-Méndez et al. Sci Adv. .

Abstract

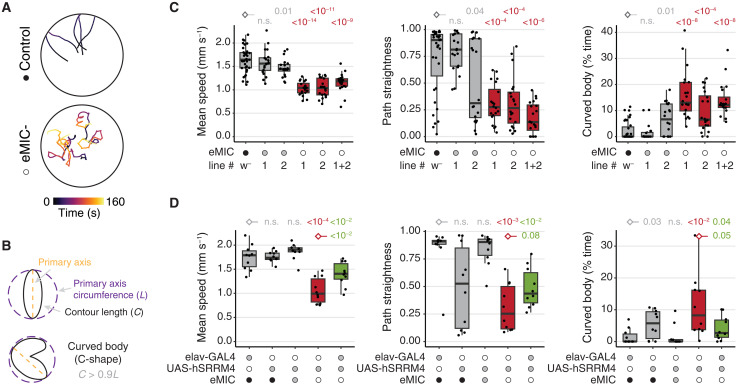
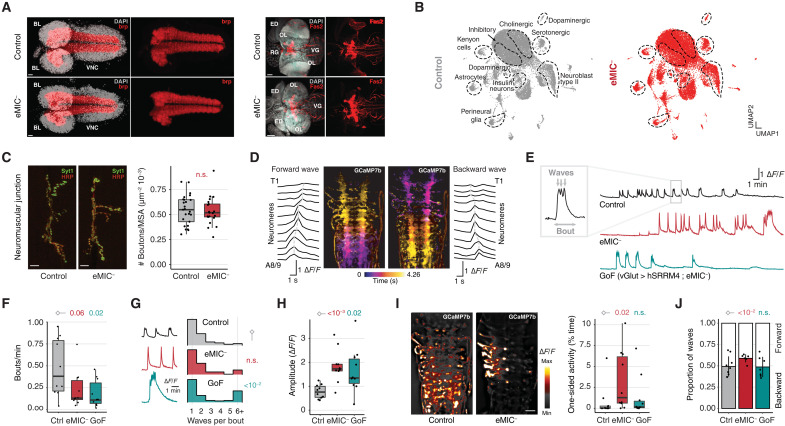
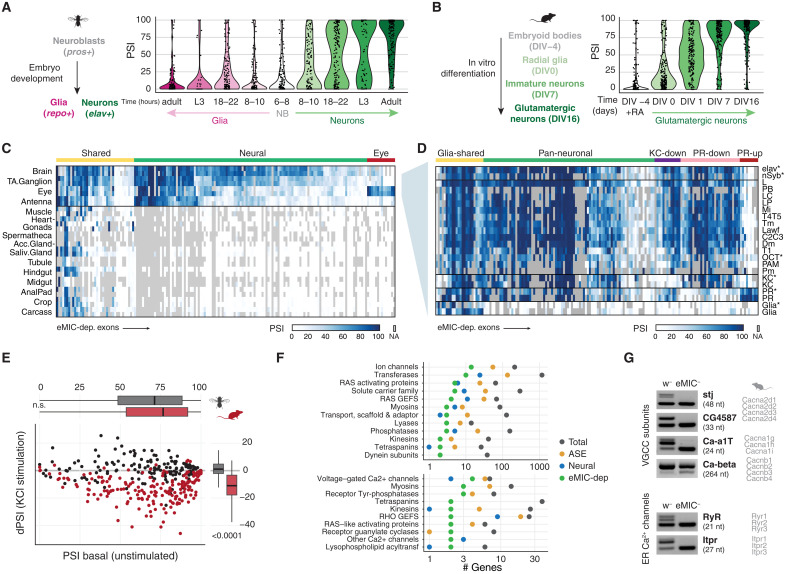
Alternative splicing increases neuronal transcriptomic complexity throughout animal phylogeny. To delve into the mechanisms controlling the assembly and evolution of this regulatory layer, we characterized the neuronal microexon program in Drosophila and compared it with that of mammals. In nonvertebrate bilaterians, this splicing program is restricted to neurons by the posttranscriptional processing of the enhancer of microexons (eMIC) domain in Srrm234. In Drosophila, this processing is dependent on regulation by Elav/Fne. eMIC deficiency or misexpression leads to widespread neurological alterations largely emerging from impaired neuronal activity, as revealed by a combination of neuronal imaging experiments and cell type-specific rescues. These defects are associated with the genome-wide skipping of short neural exons, which are strongly enriched in ion channels. We found no overlap of eMIC-regulated exons between flies and mice, illustrating how ancient posttranscriptional programs can evolve independently in different phyla to affect distinct cellular modules while maintaining cell-type specificity.


Figures

Fig. 1.
Fig. 1.. Posttranscriptional regulation of eMIC domain expression in D. melanogaster.
(A) Genomic region encompassing the 3′-most terminal exons of the Srrm234 (CG7971) gene and the corresponding protein domains encoded therein. Arg/Ser, arginine/serine rich; 3′UTR, 3′ untranslated region; bp, base pairs. Putative AS and polyadenylation (pA) sites are indicated together with their associated reference transcripts (A, C, F, and G). (B) Genomic architecture of the 3′ end of the Srrm234 locus in different insect species. Reference isoforms encoding the eMIC domain are indicated. Ma ago, million years ago. (C) Sashimi plots of RNA-seq data from different tissues at the Srrm234 3′ end region. Average numbers of reads spanning each splice junction between male and female samples are indicated. Y axis represents absolute number of mapping reads (without normalization for library size). Bottom: Main transcript isoforms annotated for the Srrm234 gene (FlyBase annotation). Pie charts depict isoform usage quantified on the basis of junction reads only. Data from FlyAtlas 2 (19). (D) Protein domains of Drosophila (d) Srrm234 isoforms and human (h) SRRM4. IR, intron retention; aa, amino acids; K, lysine; Srrm2/4-N, conserved regions at Srrm2/4 N termini. (E) Reverse transcription polymerase chain reaction (RT-PCR) assays for alternatively spliced exons in SL2 cells overexpressing different Srrm234 isoforms. PSI, percentage spliced in; nt, nucleotides. Numbers indicate mean and SD from three replicates. (F) Representative pictures of fly wings overexpressing either dSrrm234-C or dSrrm234-A under the control of spalt (SalE|PV-GAL4), active in the center of the wing blade (20), and their respective controls.
Fig. 2.
Fig. 2.. Physiological alterations associated with eMIC domain loss of function.
(A) CRISPR strategy to generate mutant flies with eMIC-specific deletion at the Srrm234 locus. Dotted red line spans the deleted genomic region, replaced by an integration cassette (fig. S2D). (B) Left: eMIC+/− male 1-day-old fly from the cross with w1118. Right: eMIC male. Photo credit: Antonio Torres-Méndez. (C) Left: Average weight of flies less than 24 hours after hatching. White numbers indicate mean values. P values from two-sided t tests comparing with w1118 controls. Right: Log2 fold change in expression levels in eMIC adult brain respect to control brains as quantified from RNA-seq data. (D) Longevity assay, n = 100 flies per sex and genotype. P value from log-rank tests. (E) Kymographs displaying Drosophila negative geotaxis behavior. Colored lines indicate average height at each time point. (F) Sensitivity of adult flies to mechanical stimulation (10-s vortex). Left: Percentage of paralyzing (bang-sensitive) flies per sex. n, number of flies tested. Right: Probability of recovering from mechanical-induced paralysis over time. (G) Sleep patterns of 3-day-old flies in 12-hour light/12-hour dark cycles. Left: Average time flies spend sleeping (inactive for ≥5 min) at different times of the light/dark cycle. ZT, Zeitgeber time; vertical lines, SEM. Top right: Maximum sleep episode during the night. Bottom right: Total number of activity counts per hour during the night. P value from Mann-Whitney U tests comparing eMIC with control flies. All panels: Filled circles correspond to number of eMIC+ alleles (black, +/+; gray, +/−; empty, −/−). n, number of individual flies tested, n.s., nonsignificant or P > 0.05.
Fig. 3.
Fig. 3.. Phenotypic rescue and gain of function in Srrm234 transgenic flies.
(A) RT-PCR assays for short neural exons from female fly heads. Numbers indicate mean and SD from three replicates. Filled circles indicate the genotype for each allele (black, +/+; gray, +/−; empty, −/−). (B) Relative fitness of flies with varying number of endogenous and transgenic eMIC alleles. See fig. S3A for a detailed mating scheme. P values from chi-square tests on the observed frequencies of genotypes per cross, compared with crosses marked with a diamond. (C) Representative pictures of eyes from young flies expressing Srrm234 isoforms pan-neuronally in the eMIC background. (D and E) Kymographs displaying the negative geotaxis behavior of Drosophila eMIC flies upon expression of UAS-hSRRM4 pan-neuronally using an elav-GAL4 driver line (D and E) or in glutamatergic neurons only, under a vGlut-GAL4 line (E). Colored lines indicate average height at each time point, and ribbons denote 95% nonparametric bootstrap confidence intervals. n, number of individual flies tested.
Fig. 4.
Fig. 4.. Alterations in locomotor behavior in eMIC larvae.
(A) Representative locomotion tracks of free-crawling third-instar larvae (L3). (B) Definition of C-shape/curved-body behavior. (C and D) Quantification of different parameters describing L3 larvae free crawling behavior. In box plots, central lines indicate median values, box limits mark interquartile ranges (IQRs), and whiskers denote 1.5 IQR. P values from Welch (speed) or Mann-Whitney U tests (path straightness and curved body patterns), from the comparison with samples labeled with a diamond. Filled circles indicate the genotype for each allele (black, +/+; gray, +/−; empty, −/−). Line “1+2” corresponds to the F1 trans-heterozygous from crossing two independent eMIC lines from the CRISPR-Cas9 genome editing.
Fig. 5.
Fig. 5.. Neuroanatomy and fictive locomotion in eMIC larvae.
(A) Confocal images of control and eMIC larval CNSs using antibodies against bruchpilot (brp; nc82) at L1 stage and fasciclin 2 (Fas2) at L3 stage. BL, brain lobe; OL, optic lobe; VG, ventral ganglia; ED, eye disc; RG, ring gland; DAPI, 4′,6-diamidino-2-phenylindole. Scale bars, 20 and 50 μm in brp and Fas2 stainings, respectively. (B) Single-cell RNA-seq data visualized using the UMAP algorithm after integrating control and mutant datasets. Gene markers used for identification of cell populations are included in fig. S4. (C) Synaptic bouton quantification at the larval NMJ for control and eMIC flies based on immunostaining against synaptotagmin (Syt1) and anti–horseradish peroxidase (HRP) to mark neuronal membranes. MSA, muscle surface area. Scale bars, 10 μm. (D) Representative activity patterns of motoneurons across VNC segments (neuromeres) during a forward and a backward wave of fictive locomotion, from imaging with the GCaMP7b calcium indicator. T1 and A8-9, first thoracic and last abdominal segments, respectively. (E) Representative traces of the mean activity across all segments of the VNC in fictive locomotion experiments for control, eMIC, and motoneuron gain of function, GoF (vGlut > hSRRM4; eMIC), larvae. (F to H) Parameters describing VNC activity patterns during fictive locomotion: number of bouts per minute (F), number of waves per bout (G), and peak amplitude (H). P values from Welch (F and H) or Mann-Whitney U (G) tests. (I) Representative symmetrical and one-sided activity events. Scale bar, 25 μm. Right: Frequency of one-sided events. P values from Mann-Whitney U tests. (J) Proportion of forward and backward waves during fictive locomotion. P values from logistic regression. Different panels: F, fluorescence.
Fig. 6.
Fig. 6.. AS regulation by the eMIC domain and its associated cis-regulatory code.
(A) AS events affected by eMIC insufficiency in adult brains. Up/down, higher/lower inclusion in eMIC samples. (B) RT-PCR validations in control (w) and eMIC fly heads. (C) Genome-wide alterations for alternatively spliced exons in eMIC adult fly brains. Error bar ends mark the PSI values from male and female samples independently. For exon classification rules, see Materials and Methods. (D) Sex comparison for the change in exon inclusion (ΔPSI) between eMIC and control adult brains. (E) Size distribution of eMIC-regulated, AS, and constitutive exons in Drosophila and mouse. (F) Proportion of tissue-regulated exons (fig. S6E) affected by the knockout of the eMIC domain. (G) Ratio of intron to mean exon length (RIME) score for introns harboring different types of cassette exons (table S2). (H) Maximum entropy scores for the 5′ splice site and AG region, relative to constitutive (High PSI) exons. (I) RNA map for the branch-point sequence (BPS) consensus in Drosophila (CUAAY) in introns surrounding different types of exons. Colored rectangles indicate regions with a significant difference in the motif coverage [false discovery rate (FDR) < 0.05] compared to the ASE group. Sliding window, 27 nt. (J and K) PSI change (dPSI) of different groups of exons upon knockdown (KD) of splicing factors in Drosophila SL2 cells and human embryonic kidney (HEK) 293 cells. (J) Knockdown of heph (Drosophila PTBP1/2/3 ortholog) and PTBP1/2. (K) Knockdown of U2af38 (Drosophila U2AF1 ortholog) and U2AF1. Data are from (34, 36, 37, 75). Different panels: P values correspond to the comparison with the eMIC-dependent group (Mann-Whitney U tests); *P < 0.01, **P < 0.001, and ***P < 10−4.
Fig. 7.
Fig. 7.. Integration of the eMIC splicing network with other neuronal regulatory programs.
(A) Cross-regulation of eMIC-dependent exons by other RBPs in fly brains; data are from (40). In red/blue, number of exons regulated in the same/opposite direction between each RBP and the eMIC domain at two ΔPSI levels. (B) Effect of the double knockout of elav and fne on exon inclusion (PSI) genome-wide in the first-instar larval (L1) CNS. Data are from (41). Exons are grouped on the basis of their response to eMIC insufficiency (see Materials and Methods). PSI frequency distributions of eMIC-dependent exons in control and mutant CNS are depicted in green. (C) Overlap between eMIC-dependent exons, neural-enriched exons, and Elav/Fne up-regulated exons. The stage of the samples used for the definition of each exon group is indicated. (D) Sashimi plot of RNA-seq data from L1 CNS upon KD of elav and fne. Pink arrows indicate putative binding motifs of Elav. Data are from (41). (E and F) RT-PCR assays of Srrm234 terminal exons from wild-type (wt) and elav-hypomorphic (elavedr) larval eye imaginal discs (J) and from SL2 cells upon overexpression of Elav (K). Blue triangles mark primer positions. The main splicing products corresponding to annotated isoforms from the Srrm234 gene (A, C/F, and G) are labeled. Nonlabeled bands correspond to intermediate splicing products or unspecific amplification that do not differ substantially between samples. (G) Summary of the main regulatory interactions identified involving the eMIC splicing program in Drosophila.
Fig. 8.
Fig. 8.. Landscape of the eMIC splicing program across tissues and neural cell types.
(A) Inclusion levels (PSI) of eMIC targets in neuronal and glial cell populations at different times of embryo development and larval and adult samples. Data sources in table S1. NB, neuroblasts; L3, third-instar larvae. (B) Inclusion of mouse eMIC targets along an in vitro differentiation time course from embryoid bodies to glutamatergic neurons. Data are from (76). DIV, days from the onset of differentiation; EB, embryoid bodies; NPC, neural precursor cells. (C) Heatmap of the inclusion levels of eMIC-dependent exons across adult tissues. TA.Ganglion, thoracicoabdominal ganglion; Acc.Gland, male accessory glands; Saliv.Gland, salivary glands. Data from the FlyAtlas 2 and others (table S1). (D) eMIC exon inclusion levels in different neuronal types. Data are from (48), unless marked with an asterisk (table S1). KC, Kenyon cell; PR, photoreceptor. Groups are based on the inclusion profile across neural cell types (see Materials and Methods for definitions). (E) Effect of KCl-induced neuronal depolarization on the inclusion of eMIC-dependent exons. Drosophila data are from (52), and mouse data are from (13). P values are from Mann-Whitney U tests. (F) Gene groups with more than one member bearing an eMIC-dependent exon. Top: “Top-level” gene categories. Bottom: Specific gene subgroups. ASE, other alternatively spliced exons. (G) RT-PCR validations of eMIC-dependent exons in calcium channels from w and eMIC heads. On the right, mouse orthologous genes. VGCC, voltage-gated calcium channel; ER, endoplasmic reticulum.
Fig. 9.
Fig. 9.. Evolution of the eMIC splicing program in flies and mammals.
(A) Conservation of eMIC-dependent exons at the genome level based on liftOver. (B) Overlap between the mouse and fly eMIC splicing programs. For the four shared exons, gene name and exon length are indicated in each species. On the right, exon positions are marked within the protein domain scheme with a vertical blue line. (C) Gene ontology (GO) terms in the “Function” category that are enriched in Drosophila and mouse eMIC targets (black and red, respectively). Terms enriched in both species are in blue. Circle size represents the percentage of eMIC exon-bearing genes in each GO category. (D) Summary schematic representation of GO terms enriched in both Drosophila and mouse eMIC targets in the “cellular component” category (top) and of species-specific terms in the “molecular function” category (bottom). GTPases, guanosine triphosphatases.

References

    1. Schmucker D., Clemens J. C., Shu H., Worby C. A., Xiao J., Muda M., Dixon J. E., Zipursky S. L., Drosophila Dscam is an axon guidance receptor exhibiting extraordinary molecular diversity. Cell 101, 671–684 (2000). - PubMed
    1. Gilbert W., Why genes in pieces? Nature 271, 501–501 (1978). - PubMed
    1. Bush S. J., Chen L., Tovar-Corona J. M., Urrutia A. O., Alternative splicing and the evolution of phenotypic novelty. Philos. Trans. R. Soc. Lond. B Biol. Sci. 372, 20150474 (2017). - PMC - PubMed
    1. Barbosa-Morais N. L., Irimia M., Pan Q., Xiong H. Y., Gueroussov S., Lee L. J., Slobodeniuc V., Kutter C., Watt S., Çolak R., Kim T. H., Misquitta-Ali C. M., Wilson M. D., Kim P. M., Odom D. T., Frey B. J., Blencowe B. J., The evolutionary landscape of alternative splicing in vertebrate species. Science 338, 1587–1593 (2012). - PubMed
    1. Brown J. B., Boley N., Eisman R., May G. E., Stoiber M. H., Duff M. O., Booth B. W., Wen J., Park S., Suzuki A. M., Wan K. H., Yu C., Zhang D., Carlson J. W., Cherbas L., Eads B. D., Miller D., Mockaitis K., Roberts J., Davis C. A., Frise E., Hammonds A. S., Olson S., Shenker S., Sturgill D., Samsonova A. A., Weiszmann R., Robinson G., Hernandez J., Andrews J., Bickel P. J., Carninci P., Cherbas P., Gingeras T. R., Hoskins R. A., Kaufman T. C., Lai E. C., Oliver B., Perrimon N., Graveley B. R., Celniker S. E., Diversity and dynamics of the Drosophila transcriptome. Nature 512, 393–399 (2014). - PMC - PubMed

Publication types

LinkOut - more resources