. 2022 Jan;12(1):e692.
doi: 10.1002/ctm2.692.

Multi-omic landscaping of human midbrains identifies disease-relevant molecular targets and pathways in advanced-stage Parkinson's disease

Affiliations

Multi-omic landscaping of human midbrains identifies disease-relevant molecular targets and pathways in advanced-stage Parkinson's disease

Lucas Caldi Gomes et al. Clin Transl Med. 2022 Jan.

Abstract

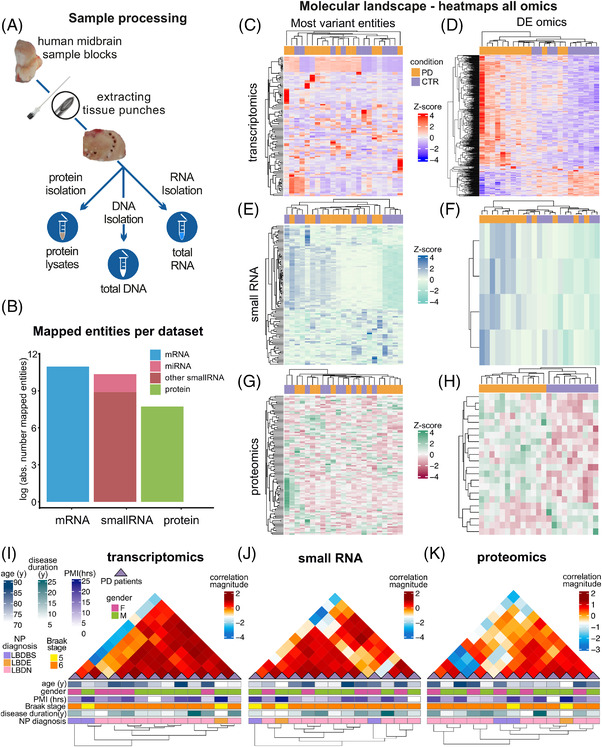
Background: Parkinson's disease (PD) is the second most common neurodegenerative disorder whose prevalence is rapidly increasing worldwide. The molecular mechanisms underpinning the pathophysiology of sporadic PD remain incompletely understood. Therefore, causative therapies are still elusive. To obtain a more integrative view of disease-mediated alterations, we investigated the molecular landscape of PD in human post-mortem midbrains, a region that is highly affected during the disease process.

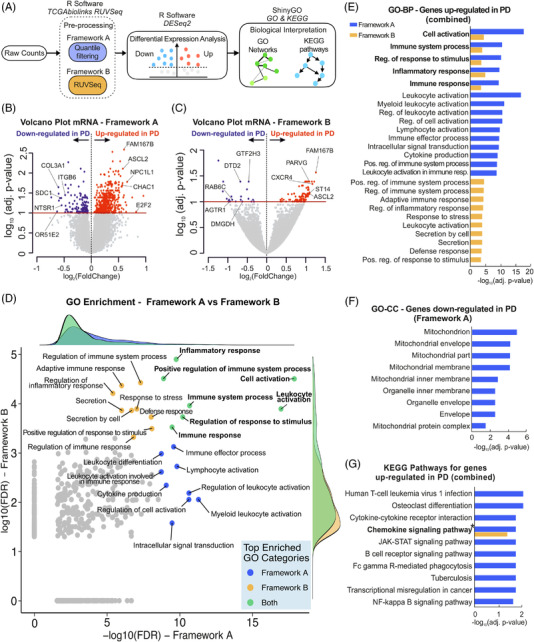
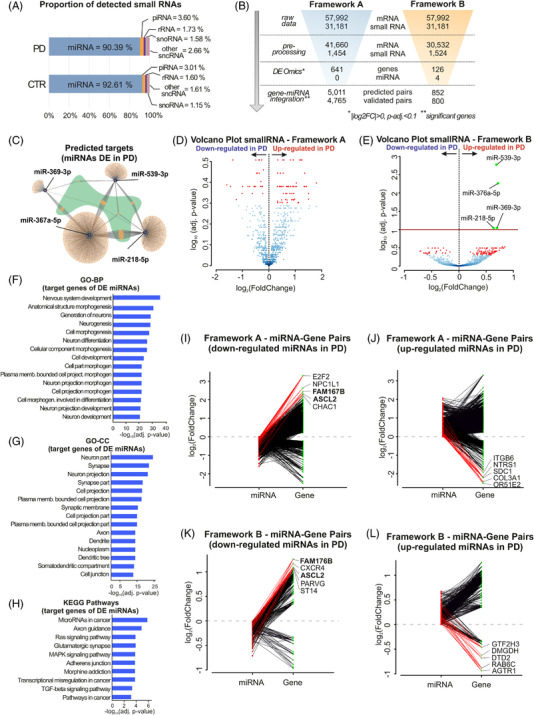
Methods: Tissue from 19 PD patients and 12 controls were obtained from the Parkinson's UK Brain Bank and subjected to multi-omic analyses: small and total RNA sequencing was performed on an Illumina's HiSeq4000, while proteomics experiments were performed in a hybrid triple quadrupole-time of flight mass spectrometer (TripleTOF5600+) following quantitative sequential window acquisition of all theoretical mass spectra. Differential expression analyses were performed with customized frameworks based on DESeq2 (for RNA sequencing) and with Perseus v.1.5.6.0 (for proteomics). Custom pipelines in R were used for integrative studies.

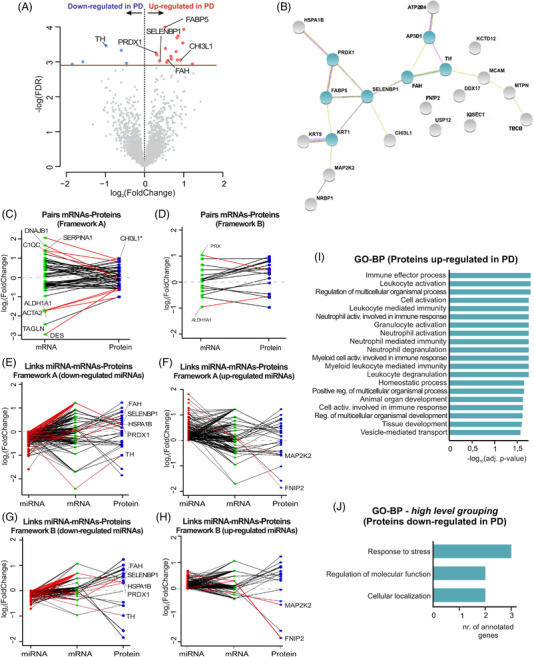
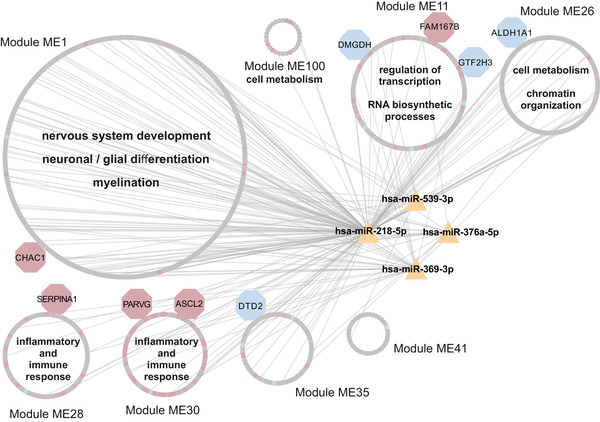
Results: Our analyses revealed multiple deregulated molecular targets linked to known disease mechanisms in PD as well as to novel processes. We have identified and experimentally validated (quantitative real-time polymerase chain reaction/western blotting) several PD-deregulated molecular candidates, including miR-539-3p, miR-376a-5p, miR-218-5p and miR-369-3p, the valid miRNA-mRNA interacting pairs miR-218-5p/RAB6C and miR-369-3p/GTF2H3, as well as multiple proteins, such as CHI3L1, HSPA1B, FNIP2 and TH. Vertical integration of multi-omic analyses allowed validating disease-mediated alterations across different molecular layers. Next to the identification of individual molecular targets in all explored omics layers, functional annotation of differentially expressed molecules showed an enrichment of pathways related to neuroinflammation, mitochondrial dysfunction and defects in synaptic function.

Conclusions: This comprehensive assessment of PD-affected and control human midbrains revealed multiple molecular targets and networks that are relevant to the disease mechanism of advanced PD. The integrative analyses of multiple omics layers underscore the importance of neuroinflammation, immune response activation, mitochondrial and synaptic dysfunction as putative therapeutic targets for advanced PD.

Keywords: Parkinson disease; data integration; miRNAs; multi-omics.


Conflict of interest statement

The authors declare no conflict of interest.

Figures

FIGURE 1
FIGURE 1
Overview of multi‐omics profiles. (A) Experimental design for the isolation of RNA, DNA and proteins from human midbrain sample blocks. The extraction of tissue biopsies was performed with a spinal needle. Adjacent tissue biopsies from each sample were used for the different isolation techniques. (B) Barplot represents the number of mapped entities for each omics dataset. The y‐axis represents the natural log of the mapped entities. (C–H) Heatmaps of the top 100 most variants and significantly differentially expressed transcripts, small RNAs and proteins for the discovery cohort (based on frameworks A and B, a total of 667 genes, 4 miRNAs and 22 proteins). The diagrams display the z‐score computed from the normalized counts for each individual. Column dendrograms were obtained based on the selected omics’ molecular profiles, and the row groups depict the samples' effect. Both clusters were determined using Euclidean distance and a complete hierarchical clustering. (I–K) Unbiased Bayesian hierarchical clustering of PD samples according to the total and small RNA, and proteomics expression profiles. Clinical parameters for each PD patient are represented in the lower panel of the illustrations. The column dendrograms depict the unsupervised clustering based on the correlation between patients. CTR: control; PD: Parkinson's disease; PMI: postmortem interval; Age: age at death; NP diagnosis: neuropathological diagnosis; Gender: F: females, M: males; LBDBS: Lewy body disease brainstem variant; LBDE: Lewy body disease early‐neocortical stage; LBDN: Lewy body disease neocortical stage; miRNA: microRNA
FIGURE 2
FIGURE 2
RNA‐seq data schematic workflow and analysis results for total RNA‐sequencing. (A) Illustration of the workflow of the bioinformatics pipelines used for differential expression analysis of small and total RNA sequencing data. The analyses start with the raw data expressed as integer reads for each sample and small RNA/gene. These were pre‐processed using two distinct frameworks “A” and “B” (details in Supporting Information). Then, the frameworks were further evaluated for differential expression through DESeq2 and functional annotation of differential results using enrichment analysis tools available in ShinyGO. (B,C) Volcano plots portraying the differential expression of total RNA sequencing data between PD and CTR subjects, for frameworks “A” and “B”, respectively. The x‐axis represents log2(fold change) (log2FC) and y‐axis −log10(p‐adjusted value). Under p‐adjusted < .1, we found 641 and 126 differentially expressed genes for framework “A” and “B”, respectively. Genes attending these criteria are coloured in blue and red, for negative and positive log2FC, respectively. Highlighted genes based on the integrative analyses for RNA sequencing experiments. (D) Comparison of enriched false discovery rate (FDR) gene ontology (GO) categories obtained by frameworks “A” and “B” for the significantly up‐regulated genes (FDR < .1, yielding 500 and 427 enriched GO categories for framework “A” and “B”, respectively). Only commonly enriched categories were considered for the scatterplot. The top enriched GO categories are highlighted for framework “A” (−log10(FDR) > 8.7, a total of 16 classes, in blue), “B” (−log10(FDR) > 3.3, a total of 15 classes, in orange) and both (in green). Marginal plots represent densities of enriched GO classes for each framework and ensemble. The axis values are in the base‐10 log scale. Additionally, the GO terms not common for both frameworks were mapped to zero in the x‐ and y‐axis. (E) Top 15 GO‒biological processes categories enriched for genes up‐regulated in PD obtained with frameworks “A” and “B”, under FDR < .1. Bars represent log10 transformed adjusted p‐values. (F) GO‒cellular component categories enriched for genes down‐regulated in PD obtained with framework “A”, under FDR < .1. Bars represent log10 transformed adjusted p‐values. (G) Top‐10 significant KEGG signalling pathways for frameworks “A” (blue) and “B” (orange), under FDR < .1. Chemokine signalling pathway was enriched in both frameworks “A” and “B” (see Figure S14 for the full pathway). CTR: control; PD: Parkinson's disease; GO: gene ontology; BP: biological process; CC: cellular compartment; KEGG: Kyoto Encyclopedia of Genes and Genomes; FDR: false discovery rate
FIGURE 3
FIGURE 3
Integration of RNA sequencing experiments and analysis results of small RNA sequencing data. (A) Horizontal bars depicting the percentages of the average quantities of the different small RNA species detected in the small RNA libraries as a readout for the quality of the sequencing technique for the PD patients and CTR subjects. (B) Results obtained by frameworks “A” (blue) and “B” (orange) in each step of the differential expression and integration analyses for RNA sequencing data. (C) Predicted targets for signature‐miRNAs. Hub target genes that are common to the three miRNAs are highlighted in green. (D,E) Volcano plots portraying the differential expression of small RNA sequencing data between PD and CTR subjects, for frameworks “A” and “B”, respectively. The x‐axis represents log2(fold change) (log2FC) and y‐axis −log10(p‐adjusted value). Four up‐regulated miRNAs with framework “B” were found under p‐adjusted < .1. Small RNAs attending these criteria are coloured in red for positive log2FC. (F–H) Top 15 GO‒biological processes (GO‐BP), GO‒cellular component (GO‐CC) and KEGG Pathway terms enriched for the predicted targets of the differentially expressed miRNAs, respectively, under FDR < .1. All bars represent log10 transformed adjusted p‐values. (I–L) Differentially expressed genes obtained from frameworks “A” and “B”. All mapped microRNAs (miRNAs) were integrated with their respective validated targets (Methods in the Supporting Information). For each panel, the analysis for up‐ and down‐regulated miRNAs in PD is depicted. The y‐axis denotes the log2(fold change) of the miRNAs (in red) and genes (in green). From these pairs, we highlighted genes with a valid interacting miRNA (opposite regulation) based on their high differential level. CTR: control; PD: Parkinson's disease; DE: differentially expressed; FC: fold change; GO: gene ontology; BP: biological process; CC: cellular compartment; KEGG: Kyoto Encyclopedia of Genes and Genomes; miRNA: microRNA; piRNA: Piwi‐interacting RNA; rRNA: ribosomal RNA; snoRNA: small nucleolar RNA; sncRNA: small non‐coding RNA
FIGURE 4
FIGURE 4
Proteomics analyses of midbrain samples. (A) Volcano plot showing all detected proteins in midbrain samples of PD and CTR subjects. Differentially expressed proteins (total of 22) between CTR and PD indicated in blue (down‐regulated in PD) and in red (up‐regulated in PD). Horizontal line depicts the cut‐off for significance (FDR = .1). (B) STRING analysis for the differentially expressed proteins. Clusters were defined by the Markov Algorithm in STRING 11.0, using default settings. Hub proteins (3 or more links) are highlighted in green. (C,D) Differentially expressed genes obtained from frameworks “A” and “B” (p‐adjusted < .1) and genes whose corresponding protein was significantly deregulated in the same direction (FDR < .1; 11 and 13 genes in frameworks A and B, respectively), integrated with all mapped proteins. The y‐axis denotes the log2(fold change) of the genes (in green) and proteins (in purple). From these pairs, genes are highlighted based on their high differential level (top four genes with largest differential level, |log2FC| > 1.4). (*) highlights CHI3L1, a candidate identified significantly up‐regulated in both transcriptomics and proteomics datasets. (E–H) Combination of the resulting pairs of small RNAs and their respective target genes from frameworks “A” and “B” (independently of their significance), with the 22 significantly expressed proteins and proteins whose corresponding gene was significantly deregulated in the same direction (p‐adjusted < .1; 18 and 3 proteins in frameworks A and B, respectively). The y‐axis denotes the log2(fold change) of the miRNAs (in red), genes (in green) and proteins (in purple). (I,J) Enriched GO‒biological process categories for up‐ and down‐regulated proteins in PD, respectively. CTR: control; PD: Parkinson's disease; DE: differentially expressed; FC: fold change; GO: gene ontology; BP: biological process; CC: cellular compartment; miRNA: microRNA
FIGURE 5
FIGURE 5
Visualization of top significant WGCNA gene modules and DE miRNAs. WGCNA analysis revealed 8 significant gene modules (p‐value < .05) between PD and CTR. Through the validated miRNA targets database, the network was extended to the significantly DE miRNAs (in yellow) and edges between genes and miRNAs were constructed. The red and blue nodes represent significantly up‐ and down‐regulated genes (p‐adjusted < .1) in frameworks “A” and “B”, respectively. Grey nodes represent genes in WGCNA modules with no significance (p‐adjusted > .1). Gene nodes of bigger size (DMGDH, FAM167B, GTF2H3, ALDH1A1, CHAC1, SERPINA1, PARVG, ASCL2 and DTD2) are highlighted as relevant gene candidates due to their significant differential expression and integration with miRNAs and proteins (see Figures 2, 3, 4). Furthermore, gene ontology analysis of genes in each WGCNA module revealed several significant biological processes (FDR < .1; Figure S10), which were summarized and represented in each of the illustrated WGCNA modules (terms depicted inside module circles). Modules with high distribution of up‐regulated genes (e.g. ME28 and ME30) translated high significance in inflammatory and immune response pathways. The remaining WGCNA modules and genes in these modules (p‐value > .05) can be found in the Dataset 5 in the Supporting Information. CTR: control; PD: Parkinson's disease; DE: differentially expressed; miRNA: microRNA; WGCNA: weighted correlation network analysis

References

    1. Feigin VL, Abajobir AA, Abate KH, et al. GBD 2015 Neurological Disorders Collaborator Group . Global, regional, and national burden of neurological disorders during 1990–2015: a systematic analysis for the Global Burden of Disease Study 2015. The Lancet Neurology. 2017;16(11):877–897. 10.1016/s1474-4422(17)30299-5 - DOI - PMC - PubMed
    1. Bloem BR, Okun MS, Klein C. Parkinson's disease. Lancet. 2021;397:P2284‐2303. - PubMed
    1. Skrahina V, Gaber H, Vollstedt E‐J, et al. The Rostock International Parkinson's Disease (ROPAD) Study: protocol and initial findings. Mov Disord. 2021;36:1005‐1010. - PMC - PubMed
    1. Nalls MA, Blauwendraat C, Vallerga CL, et al. Identification of novel risk loci, causal insights, and heritable risk for Parkinson's disease: a meta‐analysis of genome‐wide association studies. Lancet Neurol. 2019;18:1091‐1102. - PMC - PubMed
    1. Johnson ME, Stecher B, Labrie V, et al. Triggers, facilitators, and aggravators: redefining Parkinson's disease pathogenesis. Trends Neurosci. 2019;42:4‐13. - PMC - PubMed