. 2022 Feb 8;55(2):290-307.e5.
doi: 10.1016/j.immuni.2022.01.002. Epub 2022 Jan 31.

Development of Tbet- and CD11c-expressing B cells in a viral infection requires T follicular helper cells outside of germinal centers

Affiliations

Development of Tbet- and CD11c-expressing B cells in a viral infection requires T follicular helper cells outside of germinal centers

Wenzhi Song et al. Immunity. .

Abstract

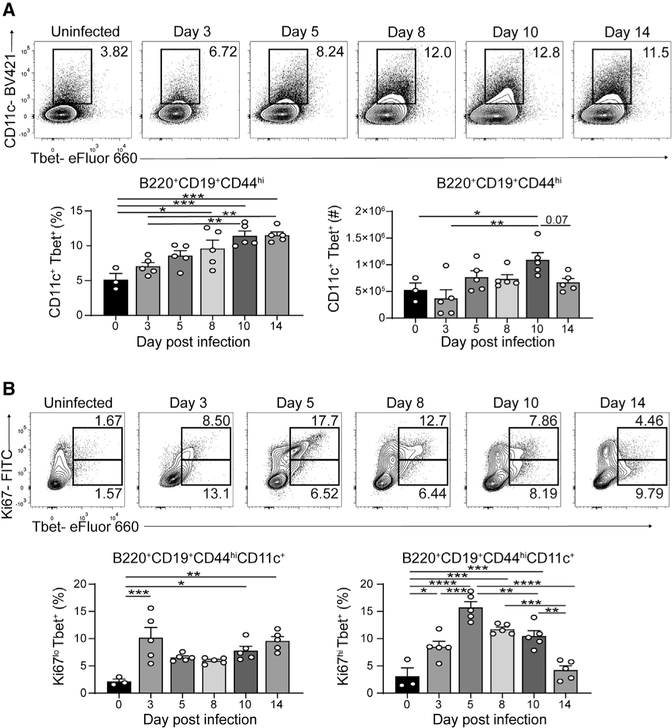
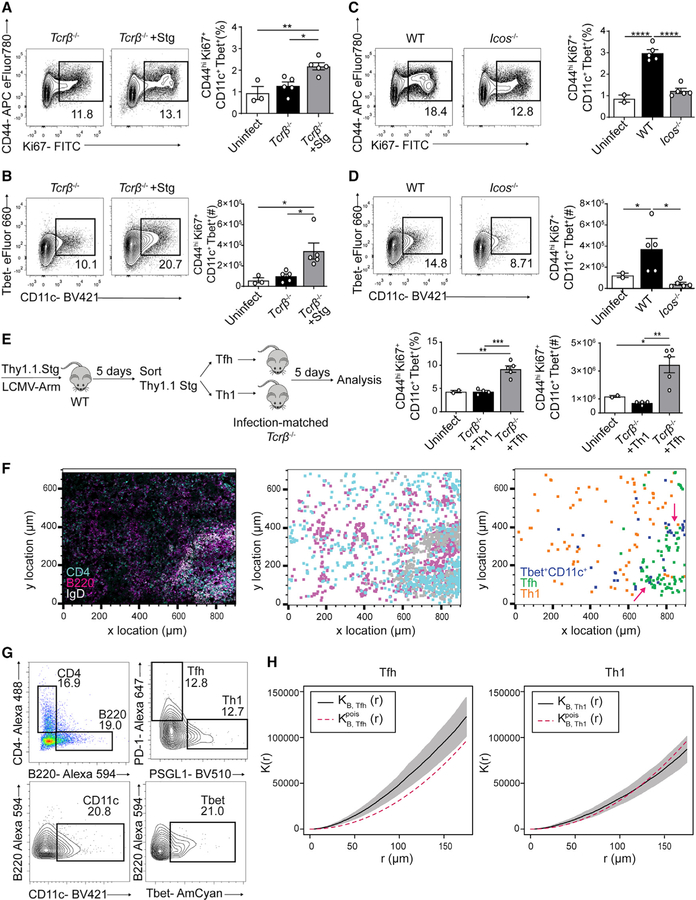
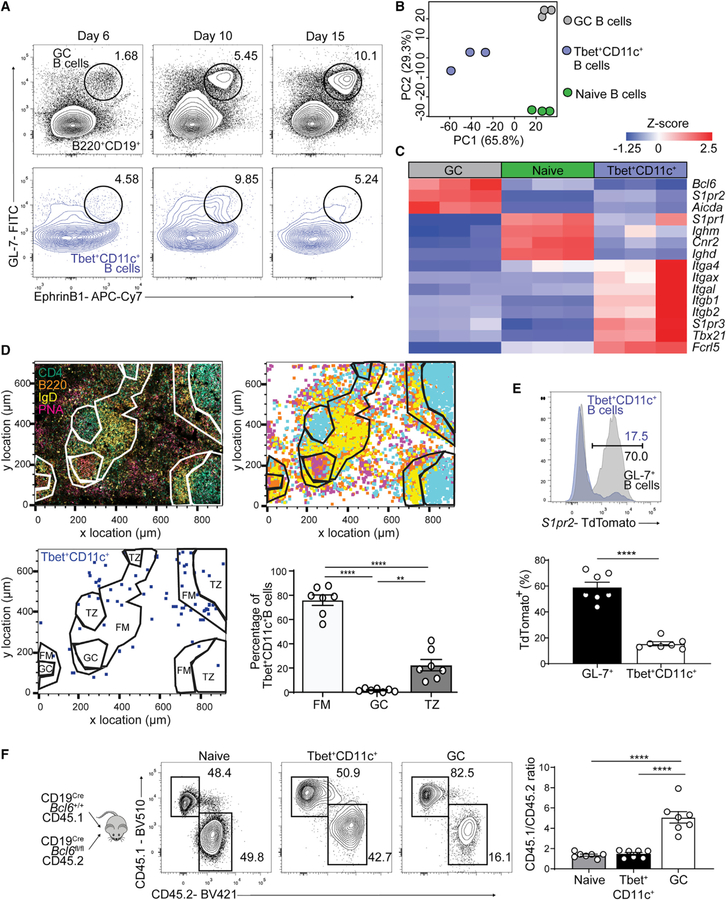
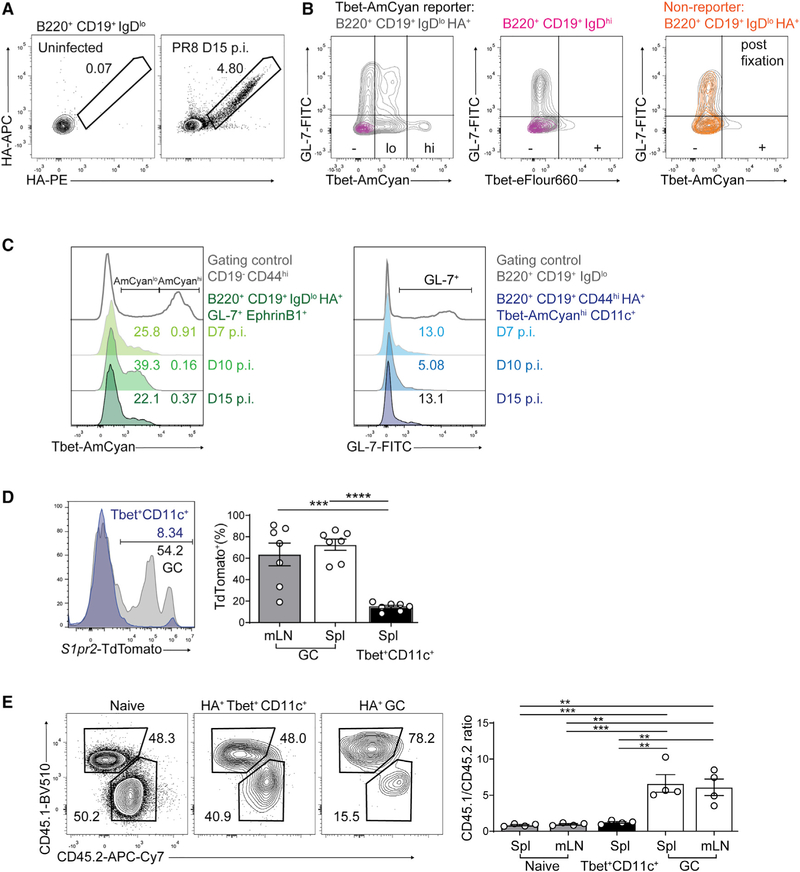
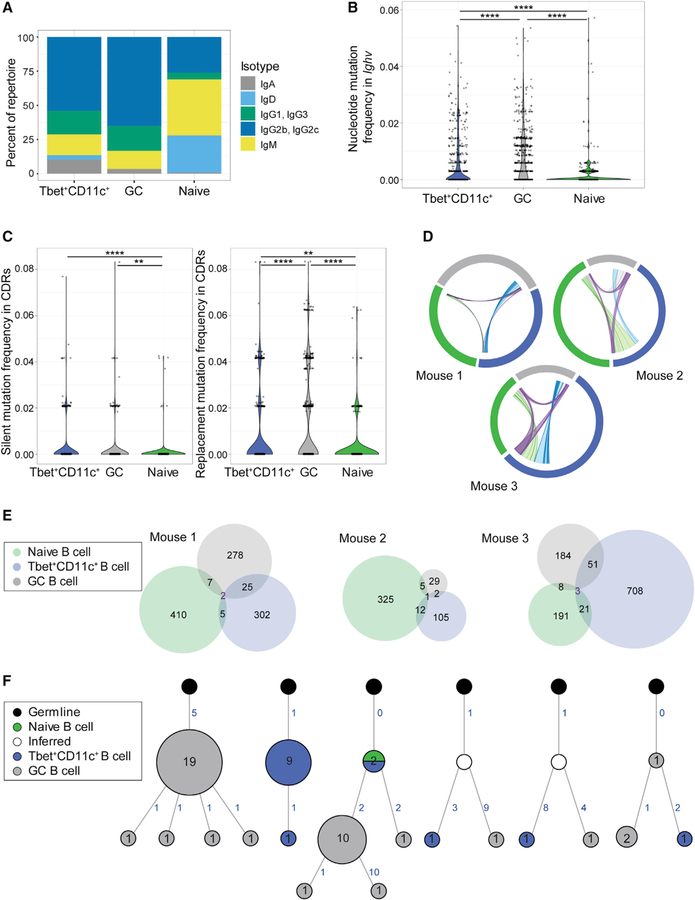
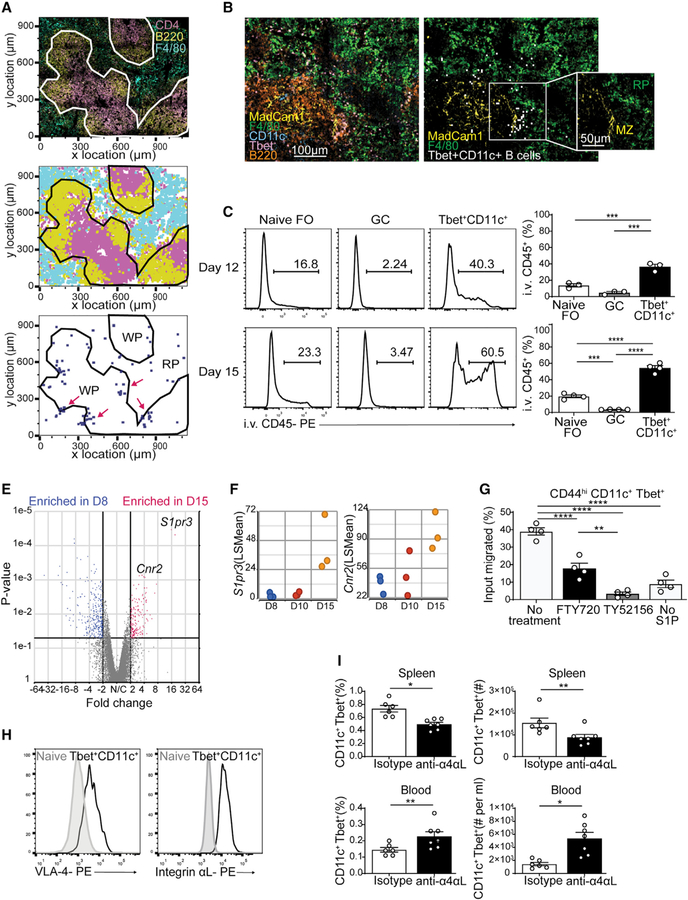
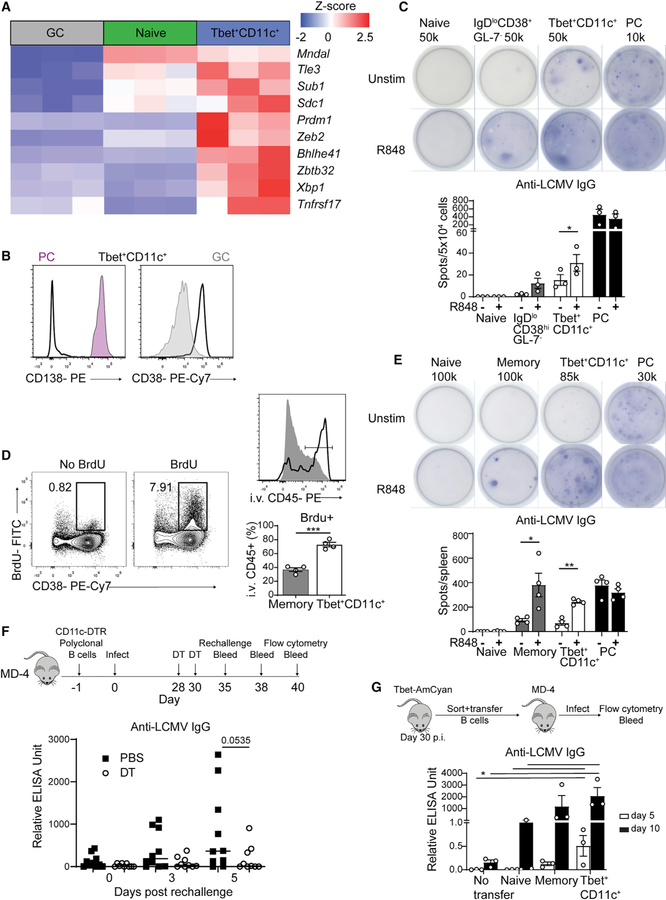
Tbet+CD11c+ B cells arise during type 1 pathogen challenge, aging, and autoimmunity in mice and humans. Here, we examined the developmental requirements of this B cell subset. In acute infection, T follicular helper (Tfh) cells, but not Th1 cells, drove Tbet+CD11c+ B cell generation through proximal delivery of help. Tbet+CD11c+ B cells developed prior to germinal center (GC) formation, exhibiting phenotypic and transcriptional profiles distinct from GC B cells. Fate tracking revealed that most Tbet+CD11c+ B cells developed independently of GC entry and cell-intrinsic Bcl6 expression. Tbet+CD11c+ and GC B cells exhibited minimal repertoire overlap, indicating distinct developmental pathways. As the infection resolved, Tbet+CD11c+ B cells localized to the marginal zone where splenic retention depended on integrins LFA-1 and VLA-4, forming a competitive memory subset that contributed to antibody production and secondary GC seeding upon rechallenge. Therefore, Tbet+CD11c+ B cells comprise a GC-independent memory subset capable of rapid and robust recall responses.

Keywords: Tbet(+)CD11c(+) B cells; Tfh cells; age-associated B cells; germinal center; humoral memory.


Conflict of interest statement

Declaration of interests The authors declare no competing interests.

Figures

Figure 1.
Figure 1.. Kinetics of Tbet+CD11c+ B cells in LCMV-Armstrong infection
(A) Frequencies and numbers of Tbet+CD11c+ B cells among B220+ CD19+ CD44hi splenocytes from WT mice following LCMV infection. (B) B220+ CD19+ CD44hi CD11c+ splenocytes’ expression of Ki67 and Tbet is shown at top. Frequencies of Ki67lo and Ki67hi Tbet+CD11c+ B cells from individual mice are shown at bottom. *p < 0.05; **p < 0.01; ***p < 0.001; ****p < 0.0001 (one-way ANOVA). Data are representative of three independent experiments with 3–5 mice per group. Bars represent means ± SEM.
Figure 2.
Figure 2.. Tfh cells drive in vivo Tbet+CD11c+ B cell generation
(A–D) CD44 and Ki67 expression in B220+ CD19+ splenocytes and CD11c and Tbet expression in B220+ CD19+ CD44hi Ki67+ splenocytes from day 10 p.i. Tcrb/ recipients of transferred Thy1.1 Stg cells and control Tcrb/ mice (A and B) or day 10 p.i. WT and Icos/ mice (C and D). Frequencies and numbers of Tbet+CD11c+ B cells (B220+ CD19+ CD44hi Ki67+ CD11+ Tbet+) are shown. (E) Experimental design of sorted Tfh or Th1 cell transfer into Tcrb/ mice and quantification of Tbet+CD11c+ B cell frequencies and numbers. (F and G) Confocal microscopy of spleens from Tbet-AmCyan reporter mice day 8 p.i. (left); anti-CD4 (cyan), anti-B220 (magenta), and anti-IgD (light gray). Shown is a histocytometric recreation of microscopy image plotting location of single cells gated as CD4+, B220+, or IgD+ (middle) as well as a plot showing the location of Tbet+CD11c+ B, Tfh, and Th1 cells, gated as CD4 B220+ CD11c+ Tbet-AmCyan+, CD4+ B220 PSGL1lo PD-1hi, and CD4+ B220 PSGL1hi PD-1lo in (G), respectively (right). (H) Summary Ripley’s multitype K function (black) calculated using Tbet+CD11c+ B with Tfh cells (left) and with Th1 cells (right) with pointwise 95% confidence interval (gray). The theoretical K function of a homogeneous Poisson process is shown in red. *p < 0.05; **p < 0.01; ***p < 0.001; ****p < 0.0001 (one-way ANOVA). Data are representative of three independent experiments with 3–5 mice per group (A–E) or pooled from two independent infections with five mice (F–H). Bars represent means ± SEM.
Figure 3.
Figure 3.. Tbet+CD11c+ B cells develop independently of GC B cells
(A) GL-7 and EphrinB1 expression on B220+ IgDlo (black) and B220+ CD19+ CD44hi CD11c+ Tbet+ (blue) splenocytes from WT mice at days 6, 10, and 15 p.i. with gating for GC (B220+ IgDlo GL-7+ EphrinB1+) B cells. (B) PCA of naive follicular (B220+ CD19+ IgDhi CD23+, green), GC (B220+ IgDlo CD95+ GL-7+, gray), and Tbet+CD11c+ (B220+ CD19+ CD44hi CD11c+ Tbet-AmCyanhi, blue) B cells sorted from Tbet-AmCyan reporter mice day 12 p.i. (C) Heatmap of selected significantly (q < 0.05) differentially expressed genes. (D) Confocal microscopy of spleens from Tbet-AmCyan reporter mice day 12 p.i. (top left); anti-CD4 (cyan), anti-B220 (orange), anti-IgD (yellow), and PNA (magenta). Shown is a histocytometric recreation of microscopy image plotting location of single cells gated as CD4+, B220+, IgD+, or PNA+ (top right). Location and quantification of Tbet+CD11c+ B cells (CD4 B220+ CD11c+ Tbet-AmCyan+) in splenic white pulp compartments: follicular mantle (FM), germinal center (GC), and T cell zone (TZ) on bottom. (E) TdTomato expression of splenic GL-7+ (GL-7+ B220+ IgDlo) and Tbet+CD11c+ B cells at day 10 p.i. (F) Experimental design of chimeric mice generated from CD45.1 CD19Cre Bcl6+/+ mixed with CD45.2 CD19Cre Bcl6fl/fl donor bone marrow cells. Frequencies and ratios of CD45.1 to CD45.2 cells in naive, GC, and Tbet+CD11c+ B cells in the spleens of mixed bone marrow chimeric mice at day 12 p.i. are shown. **p < 0.01; ***p < 0.001; ****p < 0.0001 (D and F, one-way ANOVA; E, Student’s t test). Data are pooled from two independent infections with seven mice (D), are pooled from one experiment with nine mice (E), or are representative of two independent experiments with five mice per group (F). Bars represent means ± SEM.
Figure 4.
Figure 4.. GC-independent development of influenza HA-specific Tbet+CD11c+ B cells
(A) Flow cytometry verification of HA-specific B cell detection in mediastinal lymph node (mLN) following PR8 infection. (B) Expression of AmCyan (left, right) and Tbet protein by intracellular staining (center) against GL-7 in the spleen of a representative Tbet-AmCyan reporter mouse (gray and magenta) and a nonreporter WT mouse (orange) at day 10 p.i. (C) Expression of AmCyan in splenic HA-specific GC B cells (left) and GL-7 in HA-specific Tbet+CD11c+ B cells (right) along with gating controls. (D) TdTomato expression of HA-specific GC (B220+ CD19+ IgDlo HA+ GL-7+ EphrinB1+) and Tbet+ CD11c+ (B220+ CD19+ HA+ CD44hi Ki67+ Tbet+ CD11c+) B cells in the spleens and mLNs at day 10 p.i. with PR8. (E) Frequencies and ratios of naive, HA-specific GC, and Tbet+CD11c+ B cells in spleens of 50/50 CD45.1 CD19Cre Bcl6+/+ to CD45.2 CD19Cre Bcl6fl/fl mixed bone marrow chimeric mice at day 10 p.i. with PR8. **p < 0.01; ***p < 0.001; ****p < 0.0001 (one-way ANOVA). Data are from one experiment with seven mice (D) or are representative of two independent experiments with 4–5 mice per group (A–C and E). Bars represent means ± SEM.
Figure 5.
Figure 5.. Ig repertoire analysis of Tbet+CD11c+ and GC B cells
(A) Isotype distribution in Ig sequences of naive follicular (B220+ CD19+ IgDhi CD23+), GC (B220+ IgDlo CD95+ GL-7+), and Tbet+CD11c+ (B220+ CD19+ CD44hi CD11c+ Tbet-AmCyanhi) sorted from individual Tbet-AmCyan reporter mice day 12 p.i. with LCMV. (B) Total mutation frequency within the Ighv gene. (C) Frequencies of silent and replacement mutations within the complementary determining regions (CDRs). (D) Clonal overlap of naive follicular (green), GC (gray), and Tbet+CD11c+ B cells (blue) sequences. Chords show clones shared by naive and GC (gray), naive and Tbet+CD11c+ (light green), GC and Tbet+CD11c+ (light blue), and all three subsets (purple) with chord width corresponding to clonal population size. (E) Venn diagram showing numbers of shared clones between naive follicular (green), GC (gray), and Tbet+CD11c+ B cells (blue) sequences. (F) Reconstructed lineage trees representative of most expanded clones (left three) and of shared clones between GC and Tbet+CD11c+ B cells (right three). Number of unique sequences at node with more than one unique sequence is shown to which the node size is proportional. Acquisition of somatic mutations is denoted by numbers in blue indicating number of mutations and branching, with the exception of the node directly connected to germline in each tree, which has the germline sequence. **p < 0.01; ****p < 0.0001 (two-sided Dunn’s multiple comparisons test). Data are from one mouse representative of three biological replicates (A–C and F).
Figure 6.
Figure 6.. Integrin-dependent Tbet+CD11c+ B cell retention at the marginal zone
(A) Confocal microscopy of spleens from Tbet-AmCyan reporter mice day 12 p.i. (top left), showing staining of anti-CD4 (magenta), anti-B220 (yellow), and anti-F4/80 (yellow). Shown is a histocytometric recreation of confocal microscopy image plotting location of single cells gated as CD4+, B220+, or F4/80+ (top right). Locations of Tbet+CD11c+ B cells (CD4 B220+ CD11c+ Tbet-AmCyan+) are shown in blue (clusters highlighted in magenta), along with splenic white pulp (WP) and red pulp (RP). (B) Confocal microscopy of spleens from Tbet-AmCyan reporter mice day 15 p.i., showing staining of anti-MadCam1 (yellow), anti-F4/80 (green), anti-CD11c (cyan), and anti-B220 (orange), with Tbet-AmCyan (magenta). Tbet+CD11c+ B cells are identified through histocytometry (white), and the splenic compartments WP, RP, and marginal zone (MZ) were marked. (C) I.v.-administered anti-CD45 antibody labeling of naive (B220+ CD19+ IgDhi CD23+), GC (B220+ IgDlo CD95+ GL-7+), and Tbet+CD11c+ (B220+ CD19+ CD44hi CD11c+ Tbet-AmCyanhi) at days 12 and 15 p.i. in Tbet-AmCyan mice. (E) Volcano plot comparing gene expression of Tbet+CD11c+ B cells sorted and sequenced on days 8 and 15 p.i. (F) Temporal expression of S1pr3 and Cnr2 from RNA-seq data in (E). (G) S1P transwell assay measuring ratio of migrating to total input Tbet+CD11c+ B cells from Tbet-AmCyan reporter mice pretreated with inhibitors. (H) VLA-4 and integrin αL expression on naive and Tbet+CD11c+ B cells at 15 p.i. in Tbet-AmCyan mice. (I) Percentage and number of Tbet+CD11c+ B cells among total B cells after injection of LFA-1/VLA-4 blocking or isotype control antibodies. *p < 0.05; **p < 0.01; ***p < 0.001; ****p < 0.0001 (C and G, one-way ANOVA; I, Student’s t test). Data are pooled from two independent infections (A, B, and I) or are representative of three independent experiments with three or four mice per group (C, H, and G). Bars represent means ± SEM.
Figure 7.
Figure 7.. Tbet+CD11c+ B cells produce antiviral antibodies in both primary and recall responses
(A) Heatmap of selected significantly (q < 0.05) differentially expressed genes in naive follicular, GC, and Tbet+CD11c+ B cells from RNA-seq data in Figure 3B. (B) CD138 and CD38 expression of PCs (CD19int CD138+, pink), GC (gray), and CD11c+ Tbet+ B cells (solid line) in the spleens of Tbet-AmCyan reporter mice at day 10 p.i. (C) Representative ELISPOT with number of cells plated per well and its quantification of sorted naive (B220+ CD19+ IgDhi Tbet-AmCyan), IgDlo CD38+ GL-7 (B220+ CD19+ IgDlo CD38+ GL-7 Tbet-AmCyanlo/−), PCs (CD19int CD138+), and Tbet+CD11c+ B cells from spleens of Tbet-AmCyan reporter. (D) BrdU and CD38 staining among B220+ CD19+ splenocytes from Tbet-AmCyan reporter mice at day 30 p.i. I.v.-administered anti-CD45 antibody labeling of BrdU+ memory (gray) and BrdU+ Tbet+CD11c+ B cells (black line). (E) Representative anti-LCMV IgG ELISPOT (top) with number of cells plated per well and its quantification (bottom) of sorted naive, memory (B220+ CD19+ IgDlo CD38hi GL-7lo Tbet-AmCyanlo/−), PCs, and Tbet+CD11c+ B cells from spleens of Tbet-AmCyan reporter mice. (F) Experimental design of polyclonal CD11c-DTR B cell transfer into MD4 mice. ELISA quantification of serum anti-LCMV IgG antibody of MD4 mice at days 0, 3, and 5 postrechallenge. (G) Experimental design showing the transfer of all sorted naive, memory, and Tbet+CD11c+-B cells into MD4 mice. ELISA quantification of serum anti-LCMV IgG antibody of MD4 mice at days 5 and 10 p.i. *p < 0.05; ***p < 0.001 (C–F, Student’s t test; G, one-way ANOVA). Data are representative of three (C and E) independent experiments or pooled from two independent experiments (F and G). Bars represent means ± SEM.

Comment in

References

    1. Angeletti D, Gibbs JS, Angel M, Kosik I, Hickman HD, Frank GM, Das SR, Wheatley AK, Prabhakaran M, Leggat DJ, et al. (2017). Defining B cell immunodominance to viruses. Nat. Immunol. 18, 456–463. - PMC - PubMed
    1. Austin JW, Buckner CM, Kardava L, Wang W, Zhang X, Melson VA, Swanson RG, Martins AJ, Zhou JQ, Hoehn KB, et al. (2019). Overexpression of T-bet in HIV infection is associated with accumulation of B cells outside germinal centers and poor affinity maturation. Sci. Transl. Med. 11, eaax0904. - PMC - PubMed
    1. Baddeley A, and Turner R (2005). spatstat: an R package for analyzing spatial point patterns. J. Stat. Softw. 12, 1–42.
    1. Barnett BE, Staupe RP, Odorizzi PM, Palko O, Tomov VT, Mahan AE, Gunn B, Chen D, Paley MA, Alter G, et al. (2016). Cutting edge: B cell-intrinsic T-bet expression is required to control chronic viral infection. J. Immunol. 197, 1017–1022. - PMC - PubMed
    1. Basu S, Ray A, and Dittel BN (2011). Cannabinoid receptor 2 is critical for the homing and retention of marginal zone B lineage cells and for efficient T-independent immune responses. J. Immunol. 187, 5720–5732. - PMC - PubMed

Publication types

MeSH terms