. 2022 Mar 3;29(3):372-385.e8.
doi: 10.1016/j.stem.2022.01.001. Epub 2022 Jan 31.

In vivo CRISPR screening identifies BAZ2 chromatin remodelers as druggable regulators of mammalian liver regeneration

Affiliations

In vivo CRISPR screening identifies BAZ2 chromatin remodelers as druggable regulators of mammalian liver regeneration

Yuemeng Jia et al. Cell Stem Cell. .

Abstract

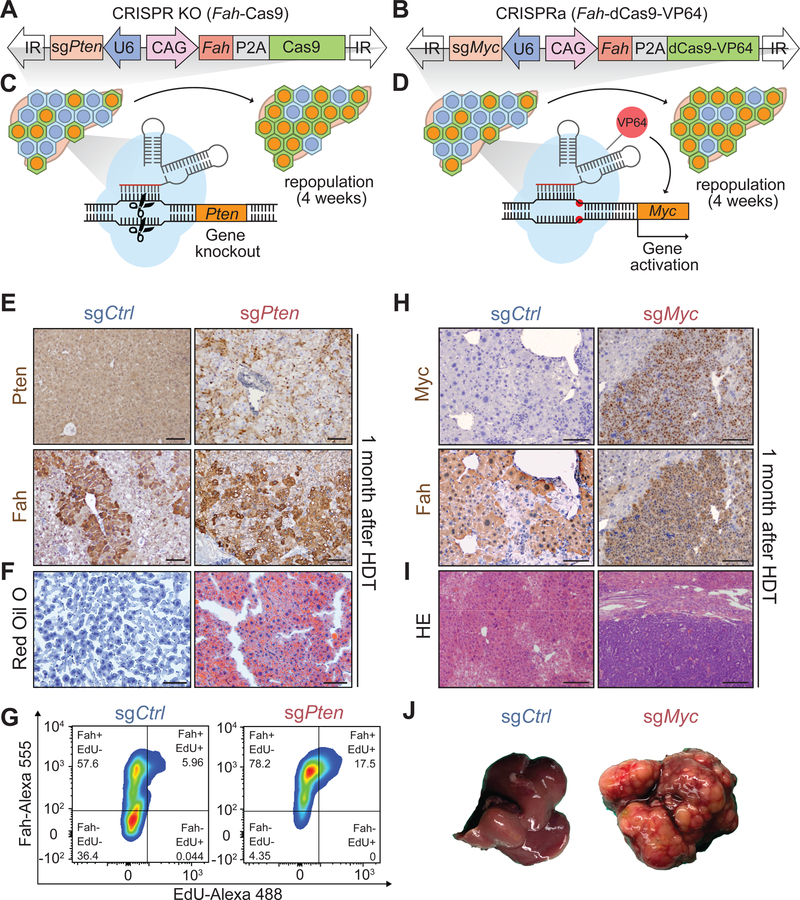
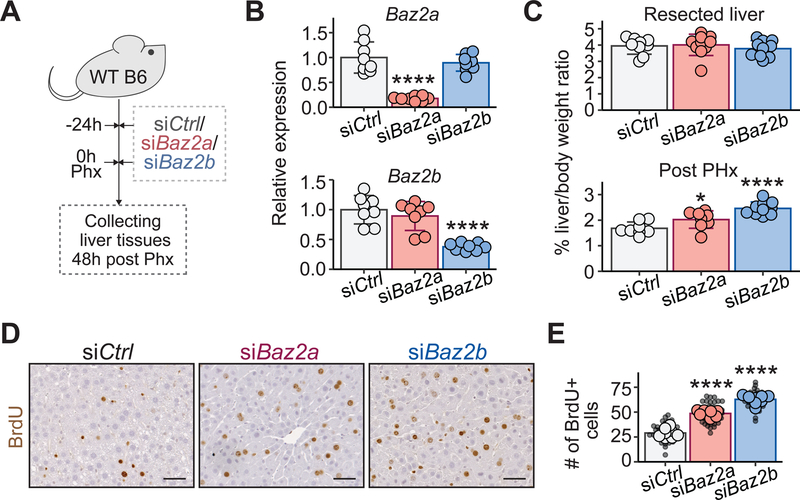
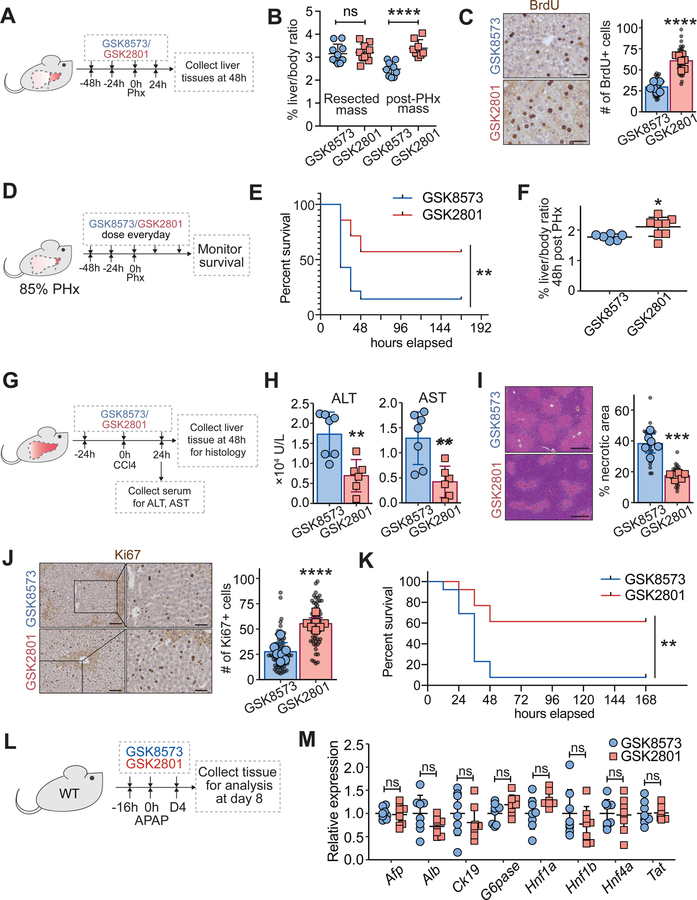
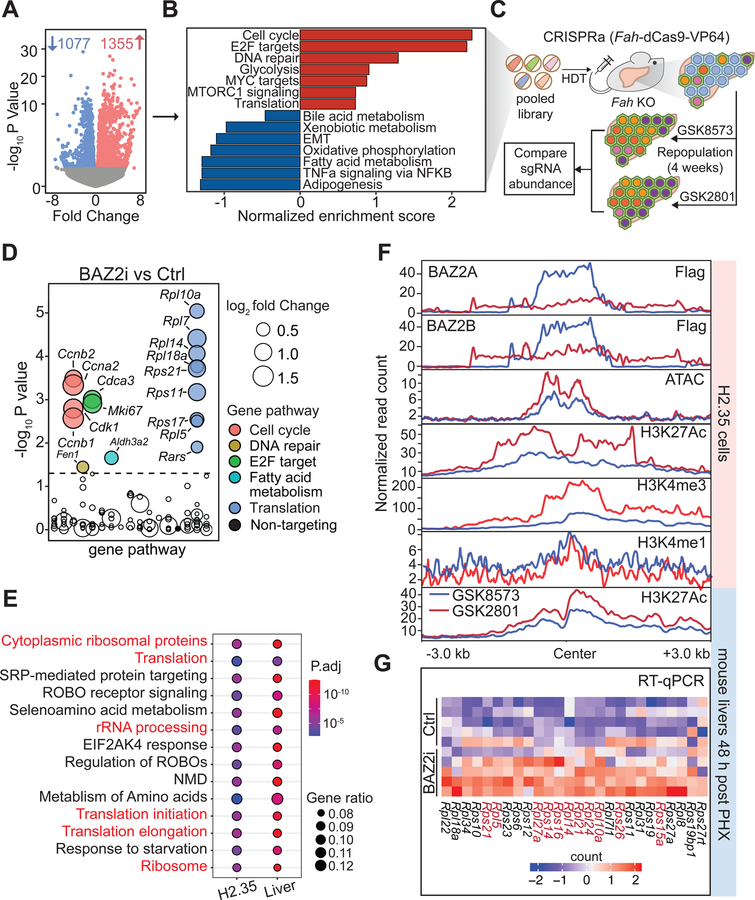
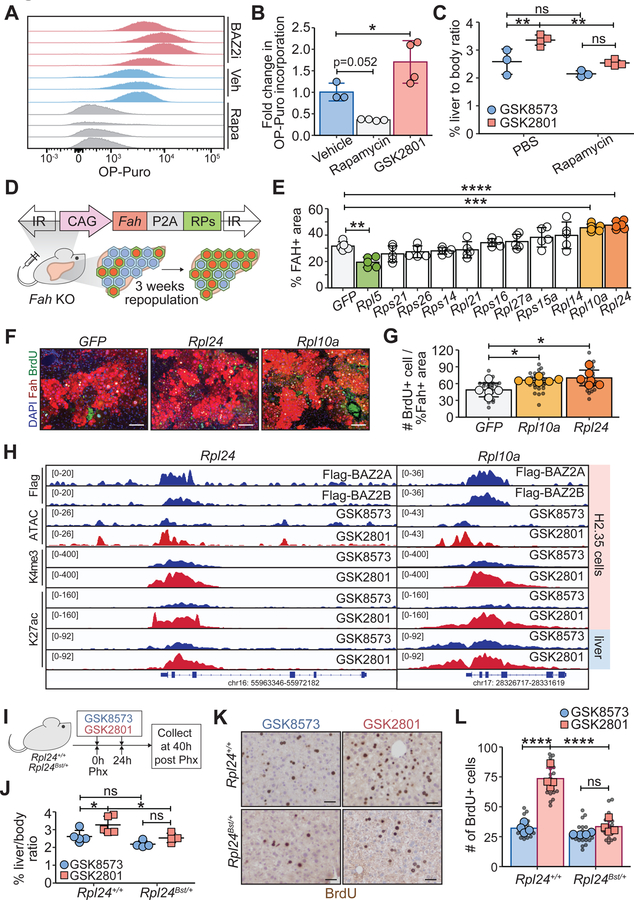
Identifying new pathways that regulate mammalian regeneration is challenging due to the paucity of in vivo screening approaches. We employed pooled CRISPR knockout and activation screening in the regenerating liver to evaluate 165 chromatin regulatory proteins. Both screens identified the imitation-SWI chromatin remodeling components Baz2a and Baz2b, not previously implicated in regeneration. In vivo sgRNA, siRNA, and knockout strategies against either paralog confirmed increased regeneration. Distinct BAZ2-specific bromodomain inhibitors, GSK2801 and BAZ2-ICR, resulted in accelerated liver healing after diverse injuries. Inhibitor-treated mice also exhibited improved healing in an inflammatory bowel disease model, suggesting multi-tissue applicability. Transcriptomics on regenerating livers showed increases in ribosomal and cell cycle mRNAs. Surprisingly, CRISPRa screening to define mechanisms showed that overproducing Rpl10a or Rpl24 was sufficient to drive regeneration, whereas Rpl24 haploinsufficiency was rate limiting for BAZ2 inhibition-mediated regeneration. The discovery of regenerative roles for imitation-SWI components provides immediate strategies to enhance tissue repair.

Keywords: CRISPRa; bromodomain inhibitors; chromatin remodeling; colitis; hepatocyte proliferation; inflammatory bowel disease; in vivo CRISPR screening; liver regeneration; partial hepatectomy; protein synthesis.


Conflict of interest statement

Declaration of interests H.Z. has a sponsored research agreement with Alnylam Pharmaceuticals, consults for Flagship Pioneering, and serves on the SAB of Ubiquitix. These interests are not directly related to the contents of this paper.

Figures

Figure 1.
Figure 1.. Sleeping Beauty transposon mediated in vivo CRISPR KO and CRISPRa systems can effectively delete and overexpress individual genes in the liver.
A. Transposon plasmid used for gene deletion and repopulation of Fah KO mouse livers. B. Transposon plasmid used for gene activation. C. Schema for generating Pten KO clones in regenerating Fah KO livers. D. Schema for the Myc activation experiment in regenerating Fah KO livers. E. Representative immunohistochemical (IHC) staining showing PTEN-, FAH+ hepatocytes 1 month after HDT (scale bar = 100 μm). This was performed in n = 3, 3 replicate mice. F. Oil Red O staining showing the extent of liver steatosis 1 month after HDT (scale bar = 100 μm; representative of n = 3, 3 mice). G. Flow cytometry analysis on perfused hepatocytes from mice that had received transposon with control or Pten targeting sgRNAs 1 month prior. The plot is representative of n = 3, 3 replicate mice. H. Representative IHC staining showing Myc overexpressing, FAH+ hepatocytes 1 month after HDT (scale bar = 100 μm). The experiment was performed in n = 3, 3 replicate mice. I. H&E images showing tumors in livers receiving sgRNA targeting the Myc promoter (scale bar = 200 μm). J. Gross liver appearance 1 month after HDT. Tumors are in all 3 livers receiving sgRNA targeting the Myc promoter.
Figure 2.
Figure 2.. Pooled in vivo CRISPR screening identified Baz2a and Baz2b as suppressors of liver regeneration.
A. Schema of in vivo CRISPR KO and activation screens. B. Genes identified in the CRISPR KO and CRISPR activation screens. The genes with larger fonts were significant in both screens and had log2 fold change in opposing directions. The red dots indicate genes that inhibit whereas the blue dots indicate genes that promote clonal expansion (n = 5 for both screens). C. Representative composite IF images showing FAH+ and FAH; BrdU double+ hepatocytes 18 days after HDT of sleeping beauty transposons containing five distinct sgRNAs targeting either Baz2a or Baz2b (See Figure S1B). Top panels are images of whole liver scans, and the bottom panels are close up images (scale bar top = 2000 μm and bottom = 50 μm). D. Percentage of FAH+ and FAH+; EdU+ hepatocytes from flow cytometry analysis of perfused hepatocytes after 18 days of liver repopulation (n = 5, 5, 5 mice). Individual flow cytometry plots are shown in Figure S1C. E. Representative composite IF images showing FAH+ and FAH; BrdU double+ hepatocytes 1 month after HDT of sleeping beauty transposon expressing mouse Fah cDNA and human BAZ2A or BAZ2B cDNA (See Figure S1D; scale bar = 100 μm). F. Percentage of FAH+ area over total tissue area taken from liver images of mice in E (n = 5, 5, 5 mice). Small black dots represent FAH+ areas from single 10X images. Larger dots represent FAH+ areas of each mouse averaged from five images.
Figure 3.
Figure 3.. In vivo siRNA knockdown of Baz2a or Baz2b increased liver regeneration after 70% PHx.
A. Schema for the in vivo siRNA experiments. Two treatments of siRNAs packaged in 5A2-SC8 LNPs (4 mg/kg siRNA) were given 24 hours before surgery and at the time of surgery. B. Relative mRNA levels of Baz2a or Baz2b measured 72 hours after the first dose of siRNA (n = 8, 8, 8 mice). C. Resected liver mass/body mass ratios 24 hours after siRNA treatment and regenerated liver mass/body mass ratios 48 hours after 70% PHx (Basal: n = 9,10,10 mice; post-PHx: n = 8,8,10 mice). D. IHC staining for BrdU incorporation 48 hours after 70% PHx. 100 mg/kg BrdU was given 3 hours before tissue collection (scale bar = 50 μm). E. Quantification of BrdU incorporation from D (n = 8, 8, 8 mice). Small black dots represent the number of BrdU+ cells from a single 10X image. Larger dots represent the number of BrdU+ cells in each mouse averaged from five images.
Figure 4.
Figure 4.. Baz2b KO mice exhibited enhanced tissue regeneration.
A. The liver to body weight ratios of resected livers at the time of 70% PHx and regenerated livers from Baz2b WT and KO mice (n = 8, 8 mice) 48 hours after surgery. B. IHC images and quantification of BrdU+ hepatocytes from WT and KO mice 48 hours after PHx (scale bar = 50 μm; n = 8, 8 mice). Smaller black dots represent the number of BrdU+ cells for a single 10X image. Larger dots represent the number of BrdU+ cells for each mouse averaged from five images. C. Cell cycle gene expression in livers of WT and Baz2b−/− mice 1 month after 70% PHx as measured by qPCR (n = 5, 5 mice). PHx was performed at 8 weeks of age. D. Differentiation related gene expression in livers of 8-week-old WT and Baz2b−/− 1 month after 70% PHx as measured by qPCR (n = 5, 5 mice). E. Schema of acute CCl4 injury experiment. Baz2b−/− and littermate WT mice were injected with one dose of CCl4. AST and ALT levels were measured 24 hours after CCl4 injection, and liver tissues were collected 48 hours after injection. F. AST and ALT levels observed 24 hours after CCl4 injection. G. Representative H&E images taken 48 hours after one dose of CCl4 and quantification of necrotic areas (scale bar = 200 μm; n = 8, 7 mice). Smaller black dots represent the necrotic areas from single 5X images. Larger dots represent the necrotic areas for each mouse averaged from five images. H. IHC staining and quantification of Ki67+ hepatocytes from WT and KO mice 48 hours after CCl4 (Left scale bar = 100 μm; right scale bar = 50 μm; n = 8, 7 mice). Smaller black dots represent the number of Ki67+ cells from single 10X images. Larger dots represent the number of Ki67+ cells for each mouse averaged from ten images.
Figure 5.
Figure 5.. Chemical inhibition of BAZ2 resulted in increased liver regeneration.
A. Schema of an experiment to test BAZ2 inhibition prior to surgical liver resection. WT B6 mice were given GSK2801 or GSK8573 control (30 mg/kg IP daily). 70% PHx was performed 48 hours after the first dose and livers were harvested 48 hours after surgery. B. Liver to body weight ratios of pre-treated mice at 0 and 48 hours after 70% PHx (pre-PHx: n = 10, 10 mice; post-PHx: n = 9, 8 mice). C. IHC images and quantification of BrdU+ hepatocytes 48 hours after surgery (scale bar = 50 μm; n = 7, 7 mice). Smaller black dots represent the number of BrdU+ cells from a single 10X image. Larger dots represent the number of BrdU+ cells for each mouse averaged from five images. D. Schema of an experiment to test BAZ2 inhibition in a more severe hepatectomy model. WT B6 mice were given GSK2801 or GSK8573. 85% PHx was performed 48 hours after the first dose and moribund mice were euthanized. E. Kaplan-Meier survival curve of WT mice receiving GSK8573 or GSK2801 after 85% PHx (n = 14, 14 mice). F. Liver-to-body weight ratios 48 hours after 85% PHx (n = 6, 8 mice). G. Schema for CCl4 injury after BAZ2 inhibition. WT B6 mice were injected with GSK2801 or GSK8573. One dose of CCl4 was given one day after drug treatment. Serum ALT and AST were measured. Livers were collected 48 hours after CCl4. H. Serum AST and ALT measured 24 hours after CCl4 (n = 7, 6 mice). I. H&E staining and hepatic necrosis quantification 48 hours after CCl4 injection (scale bar = 200 μm; n = 6, 6 mice). Smaller black dots represent the necrotic areas from single 5X images. Larger dots represent the necrotic areas for each mouse averaged from five images. J. IHC staining and Ki67 quantification 48 hours after CCl4 injection (scale bar (left) = 100 μm, (right) = 50 μm; n = 7, 7 mice). Smaller black dots represent the number of Ki67+ cells in a single 10X image. Larger dots represent the number of Ki67+ cells for each mouse averaged from ten images. K. Kaplan-Meier survival curve of WT mice receiving GSK8573 or GSK2801 (30 mg/kg per day × 2 days) 4 hours after a single dose of APAP (500 mg/kg x1 IP; n = 13, 13 mice). L. Schema for the APAP experiment in L, M. 16 hours prior to APAP (300 mg/kg), GSK8573 or GSK2801 at 30 mg/kg per day was initiated and lasted for 4 days. 8 days after APAP, liver tissues were collected. M. Differentiation related gene expression 8 days after APAP as measured by qPCR (n = 8, 8 mice).
Figure 6.
Figure 6.. Ribosomal components are epigenetic targets of BAZ2 proteins.
A. Volcano plot showing differentially expressed genes from RNA-seq of 48h post-PHx mouse livers after BAZ2 inhibition. The differentially expressed genes were identified with a p-value < 0.05. Samples were obtained from the mice in Figure 5A. B. Gene Set Enrichment Analysis (GSEA) on differentially expressed genes identified from A. C. Schema for CRISPRa screening to identify pathways responsible for the pro-regeneration phenotypes associated with BAZ2 inhibition. D. CRISPRa screening results of mice treated with GSK2801 or GSK8573 that underwent 4 weeks of repopulation. The x-axis shows the alphabetically-ordered gene pathways that each gene target belongs to. E. Shared enriched pathways that were identified in both H2.35 cells and regenerating mouse livers. Pathways related to ribosomal biogenesis and translation are highlighted in red font. Pathway enrichment analysis is shown in Figure S6E, G and all pathways are listed in Supplemental Table S3. F. Metaplots of normalized read densities around a 3 kb window flanking all peaks associated with 26 ribosome related genes bound by either Flag-BAZ2A or Flag-BAZ2B in H2.35 cells or regenerating livers treated with GSK8573 or GSK2801. For ChIP-seq of histone marks and ATAC-seq, the plots show the normalized results combined from three biological replicates. For ChIP-seq of Flag-BAZ2A and Flag-BAZ2B, the normalized plots were drawn from single biological replicates. G. Heatmap showing qPCR analysis on ribosomal proteins in regenerating livers collected from Figure 5A. Red font highlights the genes with an p-value from student’s t-test < 0.05.
Figure 7.
Figure 7.. Enhanced regeneration with BAZ2 inhibition was caused by increased protein synthesis rates.
A. Flow cytometry analysis of OP-puro incorporation in 48h-post-PHx mouse livers treated with vehicle, GSK2801, or rapamycin. B. OP-puro quantification in hepatocytes (n = 3, 4, 4 mice). C. Liver to body weight ratios 48 hours after 70% PHx (n = 3, 4, 3, 4 mice) in mice treated with PBS or 2.0 mg/kg of rapamycin. Small molecules were given to mice at the time of surgery and dosed every day x2 before tissue collection. D. Schema showing the effect of overexpressing individual ribosomal proteins on hepatocyte repopulation in Fah KO mice. E. Percent FAH+ area in ribosomal protein overexpression experiments from Figure S7B. FAH+ areas in each mouse were averaged from five 10X images. F. Representative composite IF images of FAH and BrdU in mice with Rpl10a or Rpl24 overexpression (scale bar = 100 μm). G. Number of BrdU+ cells per FAH+ percent area (n = 5, 6, 6 mice). Smaller black dots represent values from single 10X images. Larger dots represent average values from five images. H. Normalized ChIP-seq tracks showing BAZ2 protein binding, chromatin accessibility, H3K4me3, and H3K27ac for Rpl24 and Rpl10a loci in H2.35 cells and in regenerating livers. I. Schema of the experiment to determine the effect of reduced protein synthesis on BAZ2 inhibition. Two doses of GSK8573 or GSK2801 were given to Rpl24+/+ and Rpl24Bst/+ mice before and after surgery. J. Liver to body weight ratios of Rpl24+/+ and Rpl24Bst/+ mice receiving GSK8573 and GSK2801, 40 hours after PHx (Rpl24+/+: n = 5, 5 mice; Rpl24Bst/+: n = 4, 4 mice). K. BrdU staining 40 hours after PHx (scale bar = 50 μm). L. Quantification of BrdU incorporation from K (Rpl24+/+: n = 4, 4 mice; Rpl24Bst/+: n = 4, 4 mice). Smaller black dots represent the number of BrdU+ cells from each 10X image. Larger dots represent the number of BrdU+ hepatocytes for each mouse averaged from five images.

References

    1. Aloia L, McKie MA, Vernaz G, Cordero-Espinoza L, Aleksieva N, van den Ameele J, Antonica F, Font-Cunill B, Raven A, Aiese Cigliano R, et al. (2019). Epigenetic remodelling licences adult cholangiocytes for organoid formation and liver regeneration. Nat. Cell Biol 21, 1321–1333. - PMC - PubMed
    1. Anders S, Pyl PT, and Huber W (2015). HTSeq — a Python framework to work with high-throughput sequencing data. Bioinformatics 31, 166–169. - PMC - PubMed
    1. Anosova I, Melnik S, Tripsianes K, Kateb F, Grummt I, and Sattler M (2015). A novel RNA binding surface of the TAM domain of TIP5/BAZ2A mediates epigenetic regulation of rRNA genes. Nucleic Acids Res. 43, 5208–5220. - PMC - PubMed
    1. Barna M, Pusic A, Zollo O, Costa M, Kondrashov N, Rego E, Rao PH, and Ruggero D (2008). Suppression of Myc oncogenic activity by ribosomal protein haploinsufficiency. Nature 456, 971–975. - PMC - PubMed
    1. Blanco S, Bandiera R, Popis M, Hussain S, Lombard P, Aleksic J, Sajini A, Tanna H, Cortés-Garrido R, Gkatza N, et al. (2016). Stem cell function and stress response are controlled by protein synthesis. Nature 534, 335–340. - PMC - PubMed

Publication types