. 2022 May;101(5):1003-1016.
doi: 10.1016/j.kint.2021.12.027. Epub 2022 Jan 26.

Concomitant loss of regulatory T and B cells is a distinguishing immune feature of antibody-mediated rejection in kidney transplantation

Affiliations

Concomitant loss of regulatory T and B cells is a distinguishing immune feature of antibody-mediated rejection in kidney transplantation

Kevin Louis et al. Kidney Int. 2022 May.

Abstract

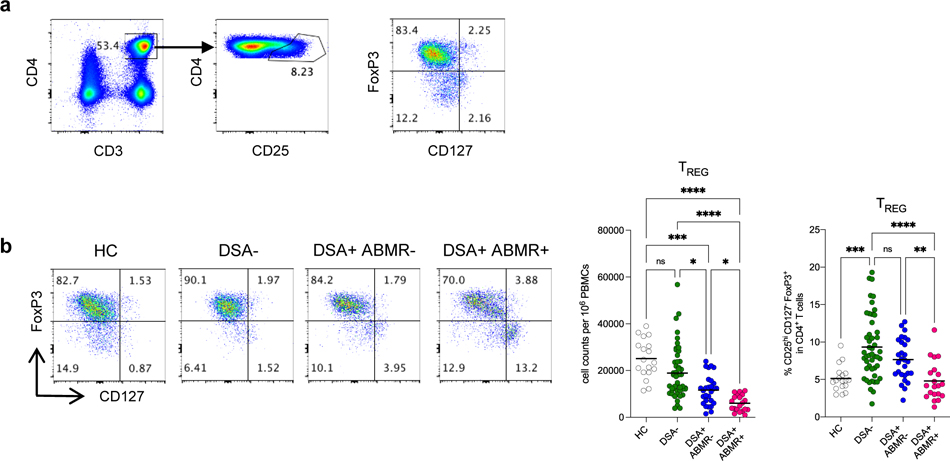
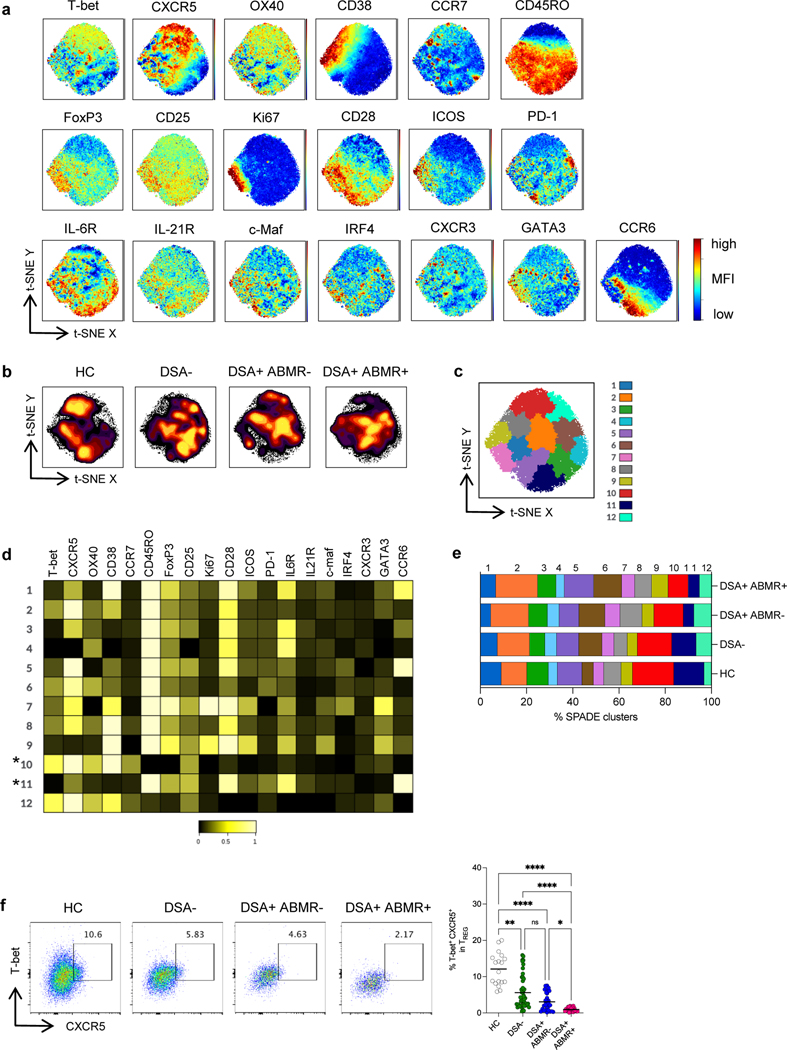
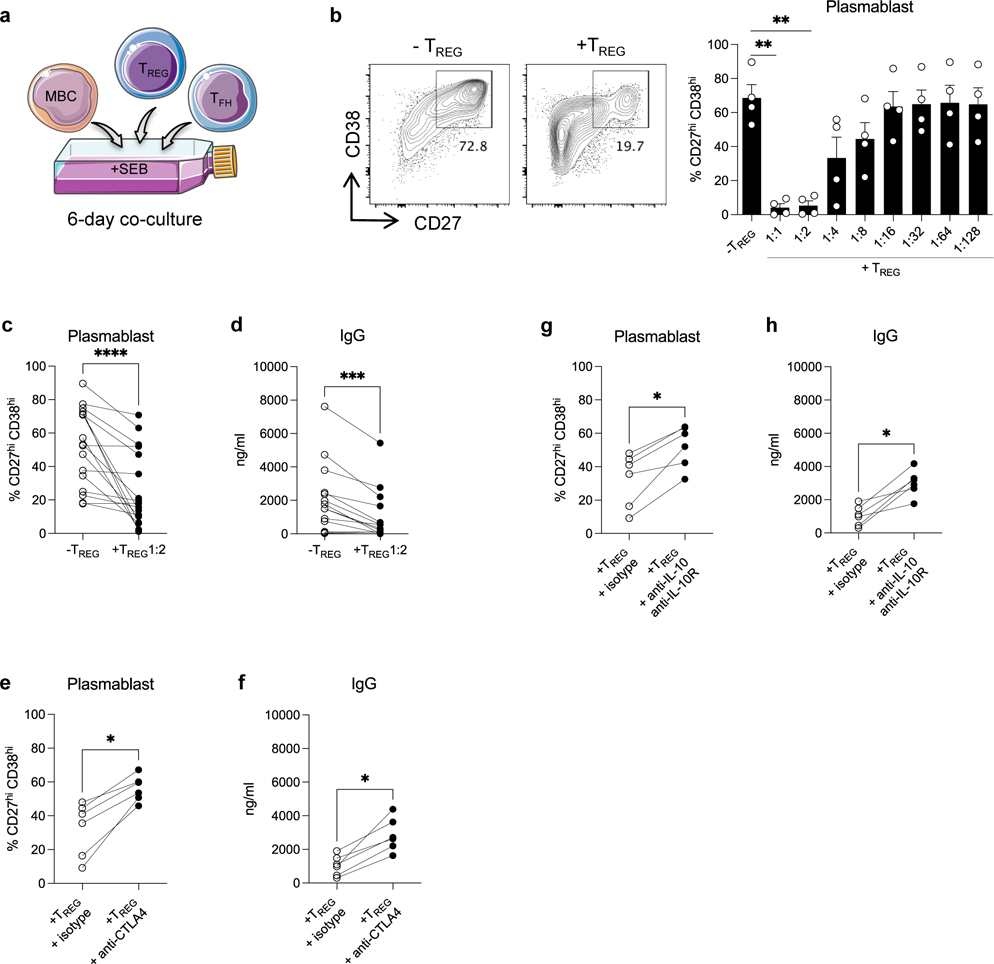
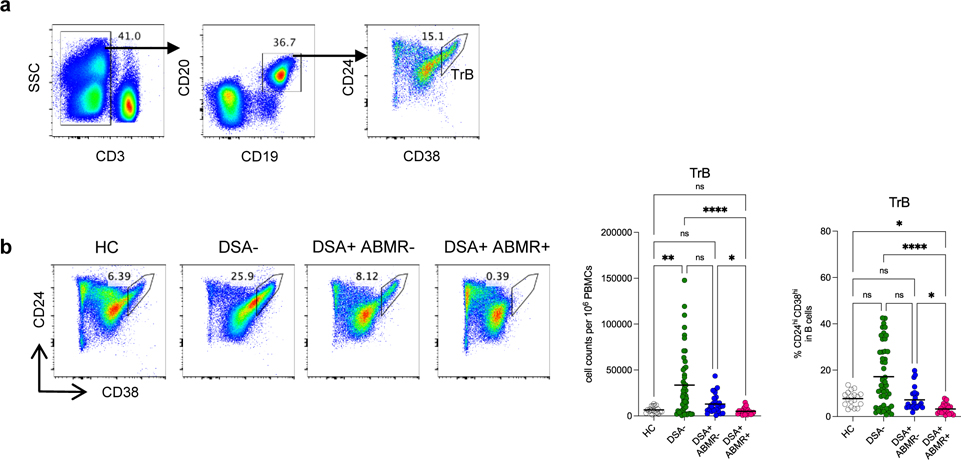
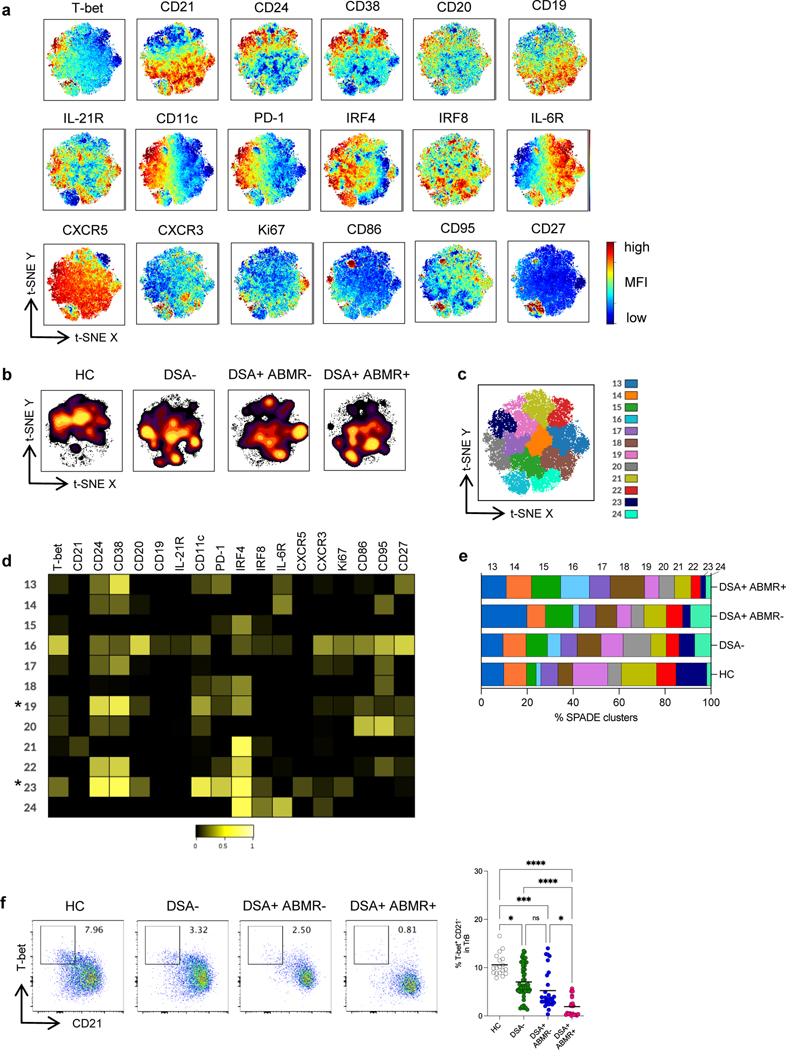
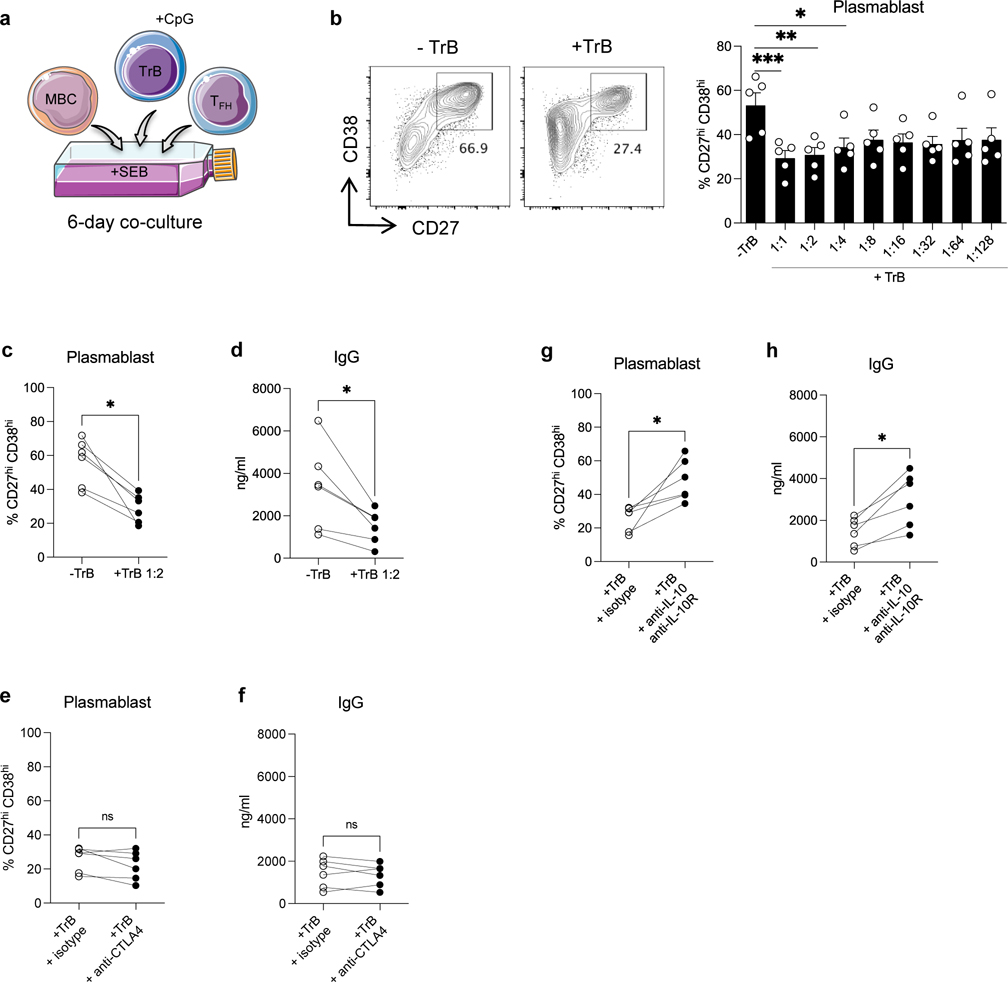
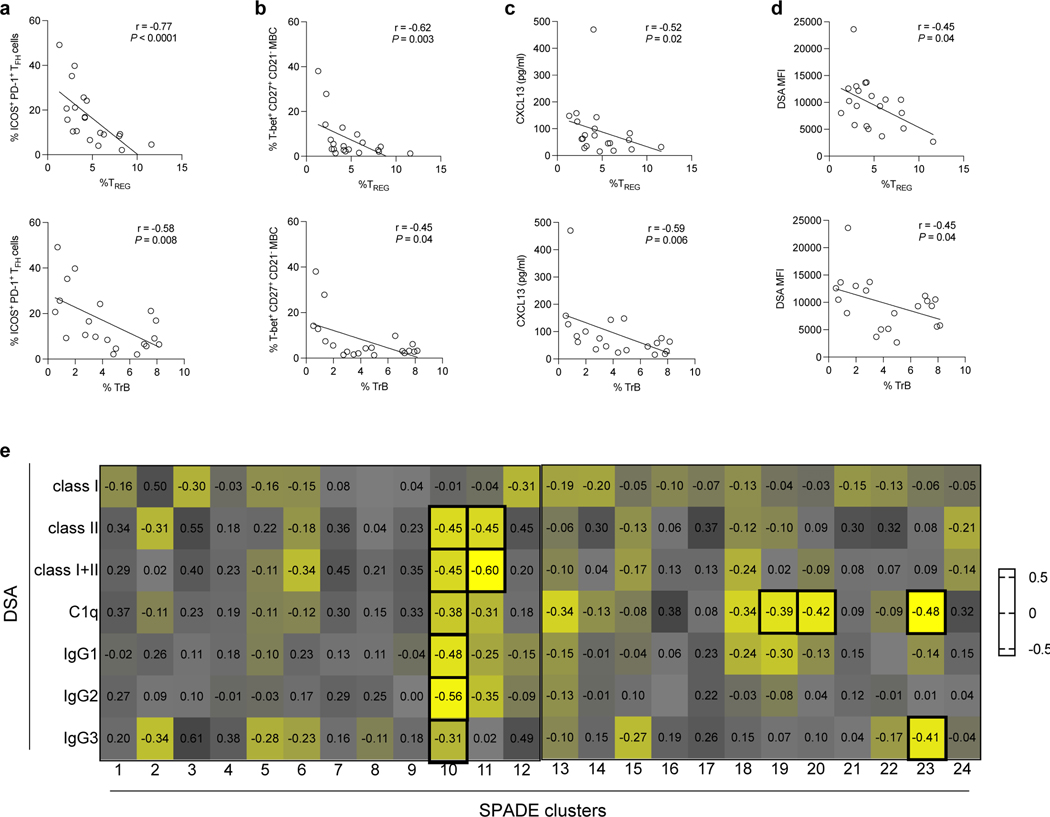
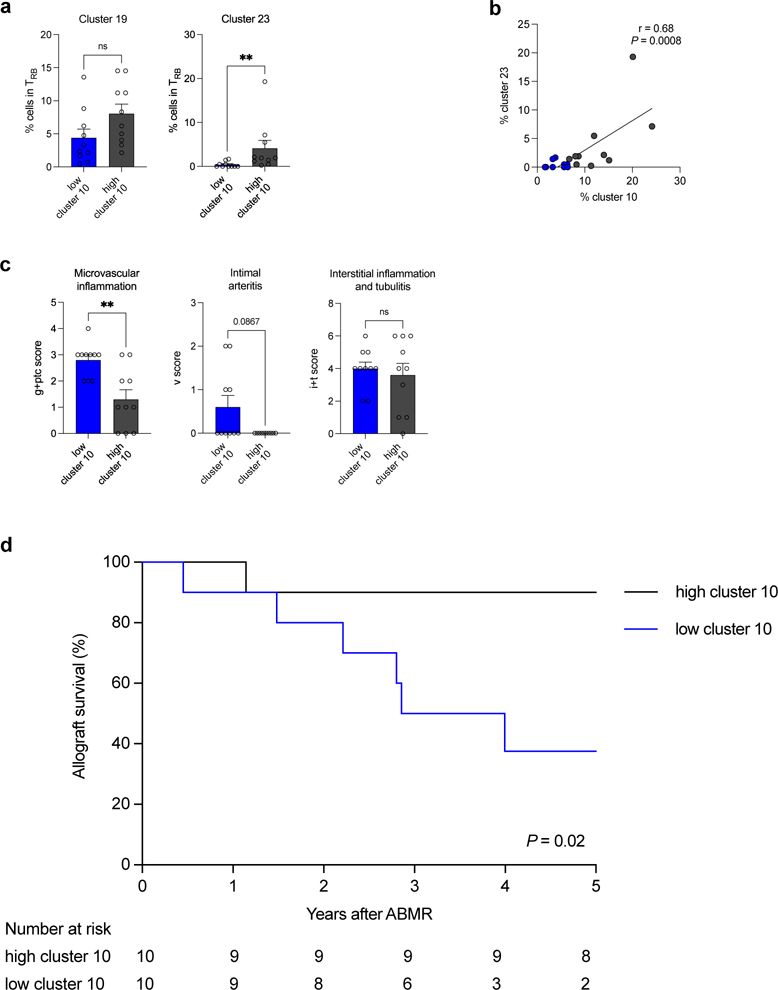
Although considerable advances have been made in understanding the cellular effector mechanisms responsible for donor-specific antibody generation leading to antibody-mediated rejection (ABMR), the identification of cellular regulators of such immune responses is lacking. To clarify this, we used high dimensional flow cytometry to concomitantly profile and track the two major subsets of regulatory lymphocytes in blood: T regulatory (TREG) and transitional B cells in a cohort of 96 kidney transplant recipients. Additionally, we established co-culture assays to address their respective capacity to suppress antibody responses in vitro. TREG and transitional B cells were found to be potent suppressors of T follicular helper-mediated B-cell differentiation into plasmablast and antibody generation. TREG and transitional B cells were both durably expanded in patients who did not develop donor-specific antibody post-transplant. However, patients who manifested donor-specific antibody and progressed to ABMR displayed a marked and persistent numerical reduction in TREG and transitional B cells. Strikingly, specific cell clusters expressing the transcription factor T-bet were selectively depleted in both TREG and transitional B-cell compartments in patients with ABMR. Importantly, the coordinated loss of these T-bet+CXCR5+TREG and T-bet+CD21- transitional B-cell clusters was correlated with increased and inflammatory donor specific antibody responses, more extensive microvascular inflammation and a higher rate of kidney allograft loss. Thus, our study identified coordinated and persistent defects in regulatory T- and B-cell responses in patients undergoing ABMR, which may contribute to their loss of humoral immune regulation, and warrant timely therapeutic interventions to replenish and sustain TREG and transitional B cells in these patients.

Keywords: B cells; T cells; antibody-mediated rejection; kidney transplantation; regulatory lymphocytes.


Conflict of interest statement

Disclosure

All the authors declared no competing interests.

Figures

Figure 1.
Figure 1.. Analysis of absolute numbers and frequencies of TREG in kidney transplant recipients
(a) Representative example of the gating strategy used for the identification of TREG (CD3+CD4+CD25hiCD127FoxP3+ cells) in blood by flow cytometry. (b) Representative examples of flow cytometry analysis, and dot plots of percentages and cell counts per million PBMC of TREG cells are displayed; HC (N=18), DSA− (N=48), DSA+ABMR− (N=28) and DSA+ABMR+ (N=20) patients. Kruskal-Wallis with Dunn’s post-test. *P < 0.05; **P < 0.01; ***P < 0.001; ****P < 0.0001. Each dot represents one subject and horizontal lines are mean values.
Figure 2.
Figure 2.. High dimensional flow cytometry analyses of TREG in kidney transplant recipients
(a) t-SNE projections were generated using a concatenated file of N= 73,600 TREG cells from HC (N=5), DSA− (N=20), DSA+ABMR− (N=20) and DSA+ABMR+ (N=20) patients; panels display expression levels of indicated markers (MFI). (b) t-SNE projections of TREG densities in the four groups using N=18,400 cells from each group, shown in panel a. (c) t-SNE map overlaid with 12 TREG clusters delineated by SPADE clustering of the concatenated file, as in panel a. (d) Heatmap showing the expression of markers for each TREG cluster according to transformed MFI ratio. * indicates the TREG clusters significantly diminished in frequencies in the DSA+ABMR+ group. (e) Stacked bar plot showing TREG cluster distribution based on SPADE clustering as in panel c. Clusters 1, 3, 6, 10 and 11 are significantly different in their proportions across the indicated groups. Kruskal-Wallis with Dunn’s post-test. (f) Representative examples of flow cytometry analysis and dot plot of percentages of T-bet+ CXCR5+ cells in TREG are displayed; HC (N=18), DSA− (N=48), DSA+ABMR− (N=28) and DSA+ABMR+ (N=20) patients. Kruskal-Wallis with Dunn’s post-test. *P < 0.05; **P < 0.01; ****P < 0.0001. Each dot represents one subject and horizontal lines are mean values.
Figure 3.
Figure 3.. Analyses of TREG capacity to suppress TFH-B cell interactions in vitro
(a) Schematic representation of sorted memory B cells (MBCs) (CD19+CD4CD38loCD27+) and TFH (CD19CD4+CD25loCD127+CD45RO+CXCR5+) co-cultured with autologous TREG (CD19CD4+CD25hiCD127) from HC, in the presence of SEB (6 days). (b) Representative examples of flow cytometry analysis of CD27hiCD38hi plasmablasts obtained after 6 days of TFH-B co-cultures with or without TREG at 1:2 ratio. Bar plot of overall data with or without supplementation of TREG from 1:1 to 1:128 ratio; N=4 per condition. (c) Percentages of CD27hiCD38hi plasmablasts (N=17), and (d) amount of IgG in supernatants (N=14) after 6 days of TFH-B co-cultures with or without supplementation of TREG at 1:2 ratio. TREG were pre-incubated with anti-CTLA4 antibody or isotype-matched control, then added to TFH-B co-cultures at 1:2 ratio. (e) Percentages of CD27hiCD38hi plasmablasts (N=6), and (f) amount of IgG in supernatants (N=6) after 6 days of co-cultures. TREG were pre-incubated with anti-IL-10 plus anti-IL-10R antibodies or isotype-matched control, then added to TFH-B co-cultures at 1:2 ratio. (g) Percentages of CD27hiCD38hi plasmablasts (N=6), and (h) amount of IgG in supernatants (N=6) after 6 days of co-cultures. Friedman test with Dunn’s post-test for panel b. Wilcoxon matched-pairs signed rank test for panel c, d, e, f, g and h. *P < 0.05; **P < 0.01; ***P < 0.001; ****P < 0.0001. Each dot represents one subject and horizontal lines of bars are mean values ± SEM.
Figure 4.
Figure 4.. Analysis of absolute numbers and frequencies of TrB in kidney transplant recipients
(a) Representative example of the gating strategy used for the identification of TrB (CD3CD19+CD24hiCD38hi cells) in blood by flow cytometry. (b) Representative examples of flow cytometry analysis, and dot plots of percentages and cell counts per million PBMC of TrB cells are displayed; HC (N=18), DSA− (N=48), DSA+ABMR− (N=28) and DSA+ABMR+ (N=20) patients. Kruskal-Wallis with Dunn’s post-test. *P < 0.05; **P < 0.01; ****P < 0.0001. Each dot represents one subject and horizontal lines are mean values.
Figure 5.
Figure 5.. High dimensional flow cytometry analyses of TrB in kidney transplant recipients
(a) t-SNE projections were generated using a concatenated file of N= 33,600 TrB cells from HC (N=5), DSA− (N=20), DSA+ABMR− (N=20) and DSA+ABMR+ (N=20) patients; panels display expression levels of indicated markers (MFI). (b) t-SNE projections of TrB densities in the four groups using N=8,400 cells from each group, shown in panel a. (c) t-SNE map overlaid with 12 TrB clusters delineated by SPADE clustering of the concatenated file, as in panel a. (d) Heatmap showing the expression of markers for each TrB cluster according to transformed MFI ratio. * indicates the TrB clusters significantly diminished in frequencies in the DSA+ABMR+ group. (e) Stacked bar plot showing TrB cluster distribution based on SPADE clustering as in panel c. Clusters 19, 20, 23 and 24 are significantly different in their proportions across the indicated groups. Kruskal-Wallis with Dunn’s post-test. (f) Representative examples of flow cytometry analysis and dot plot of percentages of T-bet+ CD21 cells in TrB are displayed; HC (N=18), DSA− (N=48), DSA+ABMR− (N=28) and DSA+ABMR+ (N=20) patients. Kruskal-Wallis with Dunn’s post-test. *P < 0.05; ***P < 0.001; ****P < 0.0001. Each dot represents one subject and horizontal lines are mean values.
Figure 6.
Figure 6.. Analyses of TrB capacity to suppress TFH-B cell interactions in vitro
(a) Schematic representation of sorted MBCs (CD19+CD4CD38loCD27+) and TFH (CD19CD4+CD25loCD127+CD45RO+CXCR5+) co-cultured with autologous CpG-pre-activated TrB (CD19+CD4CD24hiCD38hi) from HC, in the presence of SEB (6 days). (b) Representative examples of flow cytometry analysis of CD27hiCD38hi plasmablasts obtained after 6 days of TFH-B co-cultures with or without TrB at 1:2 ratio. Bar plot of percentages of CD27hiCD38hi plasmablasts after 6 days of TFH-B co-cultures with or without supplementation of TrB from 1:1 to 1:128 ratio; N=5 per condition. (c) Percentages of CD27hiCD38hi plasmablasts (N=6), and (d) amount of IgG in supernatants (N=6) after 6 days of TFH-B co-cultures with or without supplementation of TrB at 1:2 ratio. TrB were pre-incubated with anti-CTLA4 antibody or isotype-matched control, then added to TFH-B co-cultures at 1:2 ratio. (e) Percentages of CD27hiCD38hi plasmablasts (N=6), and (f) amount of IgG in supernatants (N=6) after 6 days of co-cultures. TrB were pre-incubated with anti-IL-10 plus anti-IL-10R antibodies or isotype-matched control, then added to TFH-B co-cultures at 1:2 ratio. (g) Percentages of CD27hiCD38hi plasmablasts (N=6), and (h) amount of IgG in supernatants (N=6) after 6 days of co-cultures. Friedman test with Dunn’s post-test for panel b. Wilcoxon matched-pairs signed rank test for panel c, d, e, f, g and h. *P < 0.05; **P < 0.01; ***P < 0.001; ****P < 0.0001. Each dot represents one subject and horizontal lines of bars are mean values ± SEM.
Figure 7.
Figure 7.. Correlation of TREG and TrB frequencies with DSA responses during ABMR
Spearman correlation analysis of percentages of blood TREG and TrB with percentages of blood (a) ICOS+PD-1+ TFH, (b) T-bet+CD27+CD21 MBCs, (c) CXCL13 levels measured in plasma by ELISA, and (d) DSA MFI levels measured in serum by Luminex are displayed in DSA+ABMR+ patients (N=20). (e) Heatmap showing Spearman correlation coefficients of percentages of TREG and TrB SPADE clusters with MFI levels of: class I, class II, sum of class I plus II, C1q-binding and IgG subclasses of DSA measured in serum from DSA+ABMR+ patients, by Luminex. Bold squares indicate correlations with P < 0.05. DSA class I and II analyses were performed for N=20, DSA IgG subclass analysis was performed for N=18 and DSA C1q-binding analysis was performed for N=19 patients.
Figure 8.
Figure 8.. Correlation of frequencies of cluster 10 of TREG with severity of ABMR manifestations
DSA+ABMR+ patients (N=20) were stratified into two subgroups based on the median percentage of cluster 10 of TREG <6.6% (low, N=10) and >6.6% (high, N=10) in the DSA+ABMR+ group. (a) Bar plots of percentages of cluster 19 and 23 of TrB by flow cytometry are displayed according to low or high cluster 10 status. (b) Spearman correlation analysis of percentages of cluster 10 of TREG with percentages of cluster 23 of TrB in patients with low (blue) or high (grey) cluster 10. (c) Bar plots of histologic Banff scores of kidney allograft lesions evaluated at the time of ABMR, according to low or high cluster 10 status; microvascular inflammation = g+ptc Banff score, intimal arteritis = v Banff score and interstitial inflammation and tubulitis = i+t Banff score. (d) Kaplan-Meier analysis of kidney allograft survival rate according to low or high cluster 10 status. Mann-Whitney U test for panel a and c, Spearman test for panel b and log-rank test for panel d. **P < 0.01. Each dot represents one subject and horizontal lines of bars are mean values ± SEM.

Comment in

References

    1. Gaston RS, Cecka JM, Kasiske BL, et al. Evidence for antibody-mediated injury as a major determinant of late kidney allograft failure. Transplantation. 2010;90:68–74. - PubMed
    1. Sellarés J, de Freitas DG, Mengel M, et al. Understanding the causes of kidney transplant failure: the dominant role of antibody-mediated rejection and nonadherence. Am J Transplant. 2012;12:388–399. - PubMed
    1. Loupy A, Lefaucheur C. Antibody-Mediated Rejection of Solid-Organ Allografts. N Engl J Med. 2018;379:1150–1160. - PubMed
    1. Louis K, Hertig A, Taupin J-L, et al. Markers of graft microvascular endothelial injury may identify harmful donor-specific anti-HLA antibodies and predict kidney allograft loss. Am J Transplant. 2019;19:2434–2445. - PubMed
    1. Louis K, Macedo C, Bailly E, et al. Coordinated Circulating T Follicular Helper and Activated B Cell Responses Underlie the Onset of Antibody-Mediated Rejection in Kidney Transplantation. J Am Soc Nephrol. 2020;31:2457–2474. - PMC - PubMed

Publication types