. 2022 Mar:127:105057.
doi: 10.1016/j.jmbbm.2021.105057. Epub 2022 Jan 6.

Tensile fatigue strength and endurance limit of human meniscus

Affiliations

Tensile fatigue strength and endurance limit of human meniscus

Bradley S Henderson et al. J Mech Behav Biomed Mater. 2022 Mar.

Abstract

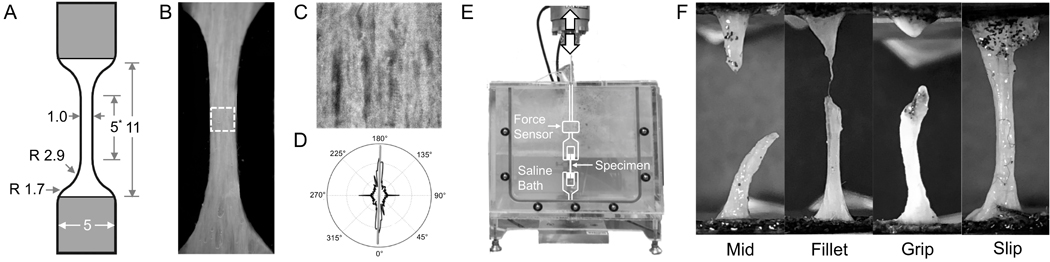
The knee menisci are prone to mechanical fatigue injury from the cyclic tensile stresses that are generated during daily joint loading. Here we characterize the tensile fatigue behavior of human medial meniscus and investigate the effect of aging on fatigue strength. Test specimens were excised from the medial meniscus of young (under 40 years) and older (over 65 years) fresh-frozen cadaver knees. Cyclic uniaxial tensile loads were applied parallel to the primary circumferential fibers at 70%, 50%, 40%, or 30% of the predicted ultimate tensile strength (UTS) until failure occurred or one million cycles was reached. Equations for fatigue strength (S-N curve) and the probability of fatigue failure (unreliability curves) were created from the measured number of cycles to failure. The mean number of cycles to failure at 70%, 50%, 40%, and 30% of UTS were estimated to be approximately 500, 40000, 340000, and 3 million cycles, respectively. The endurance limit, defined as the tensile stress that can be safely applied for the average lifetime of use (250 million cycles), was estimated to be 10% of UTS (∼1.0 MPa). When cyclic tensile stresses exceeded 30% of UTS (∼3.0 MPa), the probability of fatigue failure rapidly increased. While older menisci were generally weaker and more susceptible to fatigue failures at high-magnitude tensile stresses, both young and older age groups had similar fatigue resistance at low-magnitude tensile stresses. In addition, we found that fatigue failures occurred after the dynamic modulus decreased during cyclic loading by approximately 20%. This experimental study has quantified fundamental fatigue properties that are essential to properly predict and prevent injury in meniscus and other soft fibrous tissues.

Keywords: Damage; Effect of Aging; Fatigue life; Mechanical properties; Probability of Fatigue Failure; Soft tissue.


Figures

Fig. 1:
Fig. 1:
Tensile testing of human medial meniscus specimens. A) Dimensions of the punch used to cut dumbbell-shaped coupons from thin layers of meniscus. B) The central region of the gauge section (white dashed square) was C) imaged using a light microscope, and D) analyzed for fiber orientation using FiberFit software. E) Coupon specimens were inserted into a saline tank heated to 37°C. For fatigue testing, specimens were preconditioned and cycled in tension (white arrows) until failure. F) Mechanical failure was characterized as midsubstance, fillet, grip, or slip. All grip and slip failures occurring during fatigue testing were discarded and excluded from further analysis.
Fig. 2:
Fig. 2:
Stress and strain response during a fatigue experiment. A) A constant cyclic stress amplitude caused B) a steady increase in mean cyclic strain until rupture. C) The targeted maximum and minimum stress was achieved after an initial ramping period of approximately 50–80 cycles. The number of cycles to failure was counted between the start cycle (rises above 75% of targeted stress) and the tear cycle (drops below 95% of targeted stress). The sudden drop in stress after the tear cycle corresponded to D) a rapid increase in mean cyclic strain.
Fig. 3:
Fig. 3:
Analysis of cyclic creep during fatigue testing. A) The cyclic creep curve was split into three characteristic stages: I, II, and III. The creep rate was measured during stage II and the number of cycles to failure occurred at the end of stage III. An algorithm (Eq. 1) was developed to predict the number of cycles to failure by only using experimental data from stage I and II, where Δε represents the mean increase in tensile strain during stage II from all specimens that failed from fatigue. This algorithm could reasonably predict the number of cycles to rupture in specimens that fatigued and B) was applied to all specimens that did not fatigue (run-outs) to predict the number of cycles until rupture.
Fig. 4:
Fig. 4:
Fatigue curve for all human meniscus specimens (young and older combined). The median fatigue life at each prescribed stress level was calculated using a Weibull distribution. A semi-log function provided an excellent fit to the median cycles to failure at each stress level (R2 = 0.98). Sample size per stress level = 8.
Fig. 5:
Fig. 5:
Cumulative distribution functions for each stress level. The probability of failure P for a given number of cycles N markedly increases when loading meniscus above 30% of UTS.
Fig. 6:
Fig. 6:
Dynamic modulus decreased at each stage of creep for specimens that failed during fatigue testing. * = significantly less than all prior time points (p < 0.01).
Fig. 7:
Fig. 7:
Fatigue curves for both age groups. Semi-log functions provided good fits to the median cycles to failure at each stress level for A) young specimens (R2 = 0.90) and B) older specimens (R2 = 0.85). Here, stress level is calculated by normalizing the applied maximum tensile stress to the specimen-specific tensile strength (σuts). C) Alternatively, stress level can be converted to MPa using the average UTS predicted for all young and older specimens. This plot shows that while young specimens can withstand more loading cycles at high stresses, older specimens have comparable resistance to fatigue failure at lower stresses.
Fig. 8:
Fig. 8:
One million cycles of fatigue testing resulted in run-out specimens ("post-fatigue") with greater modulus, UTS, and failure strain than specimens that were not fatigue tested (“pre-fatigue”). * = significant difference (p < 0.05).
Fig. 9:
Fig. 9:
Fatigue life has been superimposed on a representative stress-strain curve for meniscus. The curve is built using average stress values from uniaxial pull to failure tests of human medial meniscus (Table 4). Here, cycles to failure represents a 50% probability of failure. The endurance limit (250 million cycles) is inside the toe region, suggesting that stresses below the transition point are relatively fatigue resistant. At yield stress, where damage causes the slope of the curve to begin decreasing, the meniscus is predicted to fail after 160,000 cycles (160k).

References

    1. Alam P, Mamalis D, Robert C, Floreani C, Ó Brádaigh CM, 2019. The fatigue of carbon fibre reinforced plastics - A review. Composites Part B: Engineering 166, 555–579. 10.1016/j.compositesb.2019.02.016 - DOI
    1. ASTM, 2017. Test Method for Uniaxial Fatigue Properties of Plastics. ASTM International. 10.1520/D7791-17 - DOI
    1. Berko J, Goetzel RZ, Roemer EC, Kent K, Marchibroda J, 2016. Results From the Bipartisan Policy Center’s CEO Council Physical Activity Challenge to American Business. Journal of Occupational and Environmental Medicine 58, 1239–1244. 10.1097/JOM.0000000000000897 - DOI - PMC - PubMed
    1. Budynas R, Nisbett K, 2014. Shigley’s Mechanical Engineering Design, 10th edition. ed. McGraw-Hill Education, New York, NY.
    1. Bursac P, York A, Kuznia P, Brown LM, Arnoczky SP, 2009. Influence of donor age on the biomechanical and biochemical properties of human meniscal allografts. Am J Sports Med 37, 884–889. 10.1177/0363546508330140 - DOI - PubMed

Publication types

LinkOut - more resources