Clinical Trial
. 2022 Apr 1;28(7):1335-1344.
doi: 10.1158/1078-0432.CCR-21-0426.

Phase I Trial of Cetuximab, Radiotherapy, and Ipilimumab in Locally Advanced Head and Neck Cancer

Affiliations
Clinical Trial

Phase I Trial of Cetuximab, Radiotherapy, and Ipilimumab in Locally Advanced Head and Neck Cancer

Robert L Ferris et al. Clin Cancer Res. .

Abstract

Purpose: Concurrent radiotherapy with cetuximab, an anti-EGFR mAb, is a standard treatment for locally advanced head and neck squamous carcinoma (HNSCC). Cytotoxic T lymphocyte antigen-4-positive (CTLA-4+) regulatory T cells (Treg) dampen cellular immunity and correlate negatively with clinical outcomes. This phase I study added ipilimumab, an anti-CTLA-4 mAb, to cetuximab-radiotherapy.

Patients and methods: A (3 + 3) design was used to establish the recommended phase II dose (RP2D) of ipilimumab, added at week 5 for four, every-3-week doses to fixed, standard cetuximab-radiotherapy. Eligible subjects had stage III to IVb, high-risk [human papillomavirus-negative (HPV-)] or intermediate-risk HPV-positive (HPV+)] HNSCC. Dose-limiting toxicity (DLT) was defined as any grade 4 adverse event (AE) except in-field radiation dermatitis or immune-related (ir) AE requiring ≥2 weeks of systemic steroids. Baseline tumor and serial blood specimens were collected for immune correlatives.

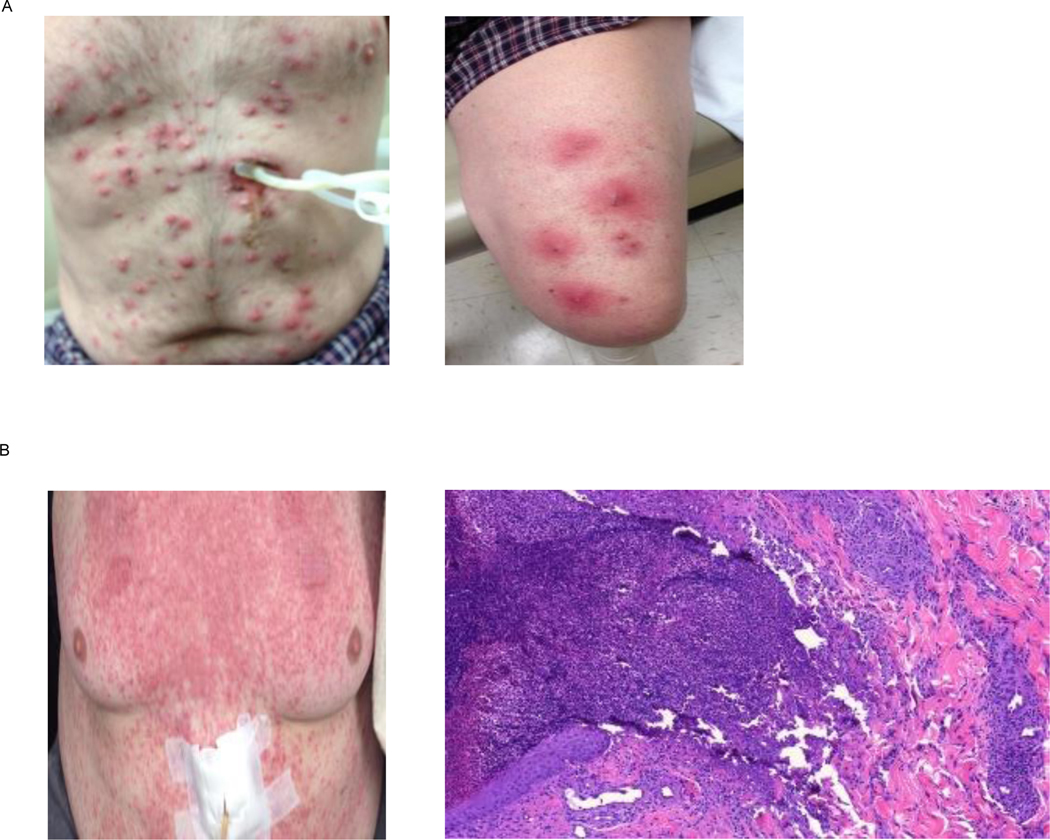
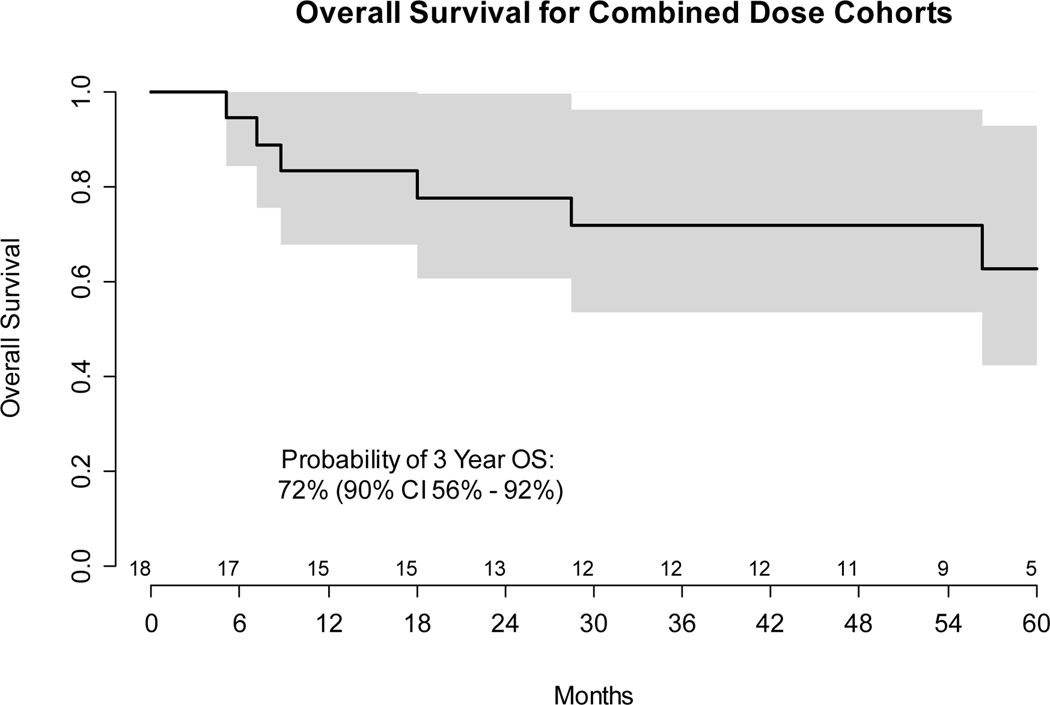
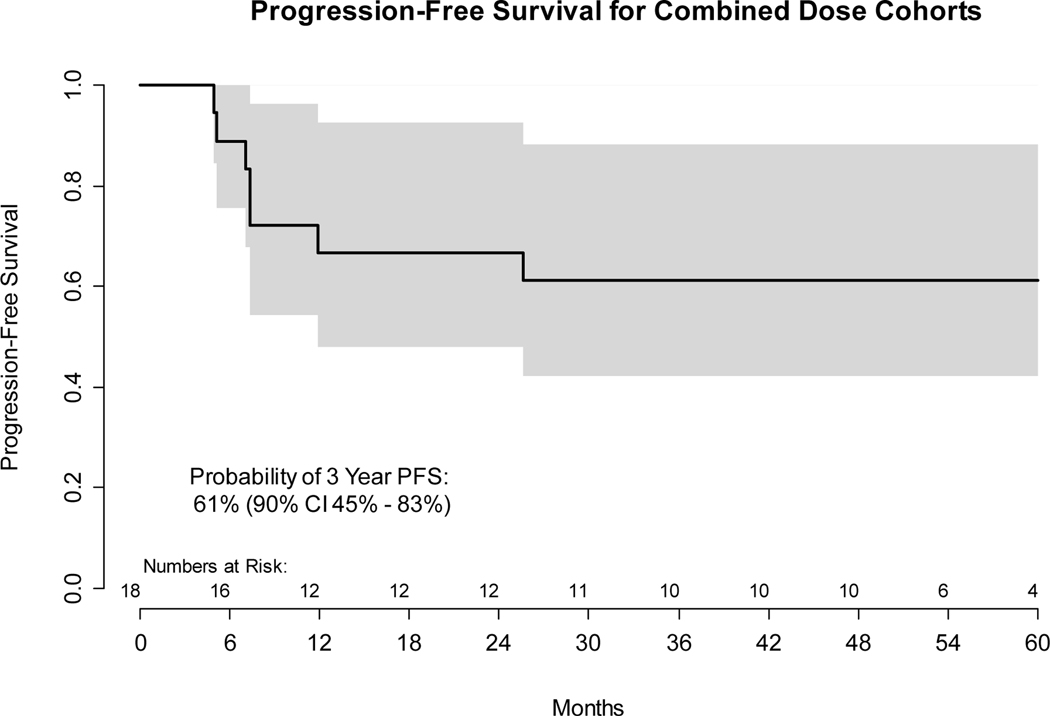
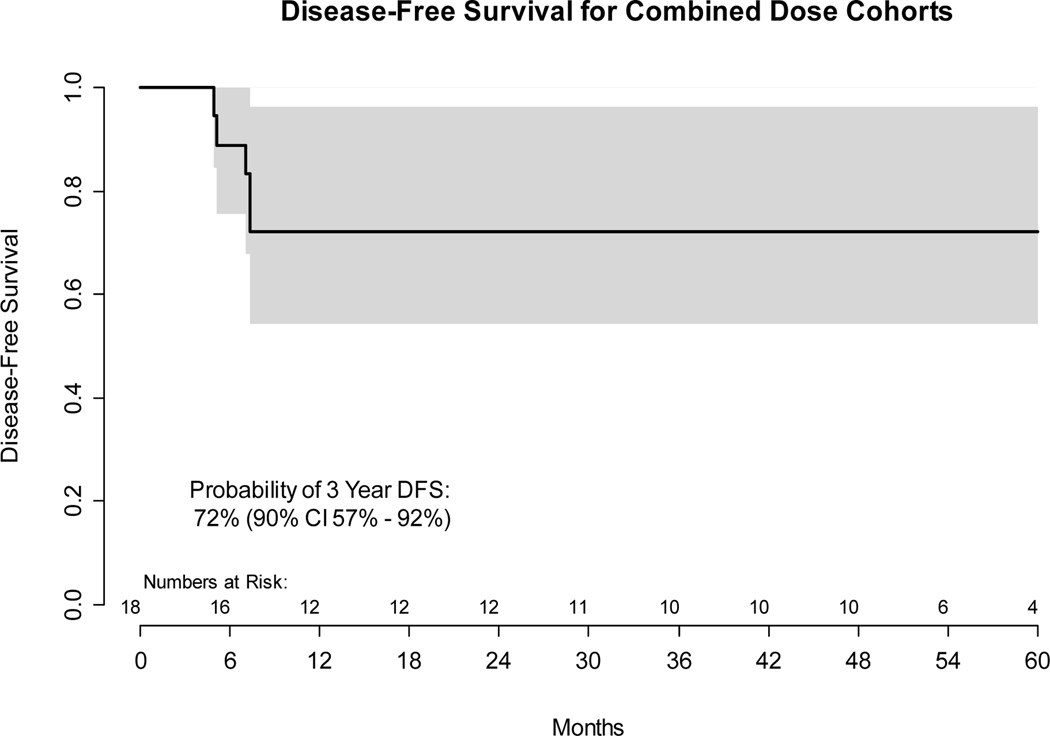
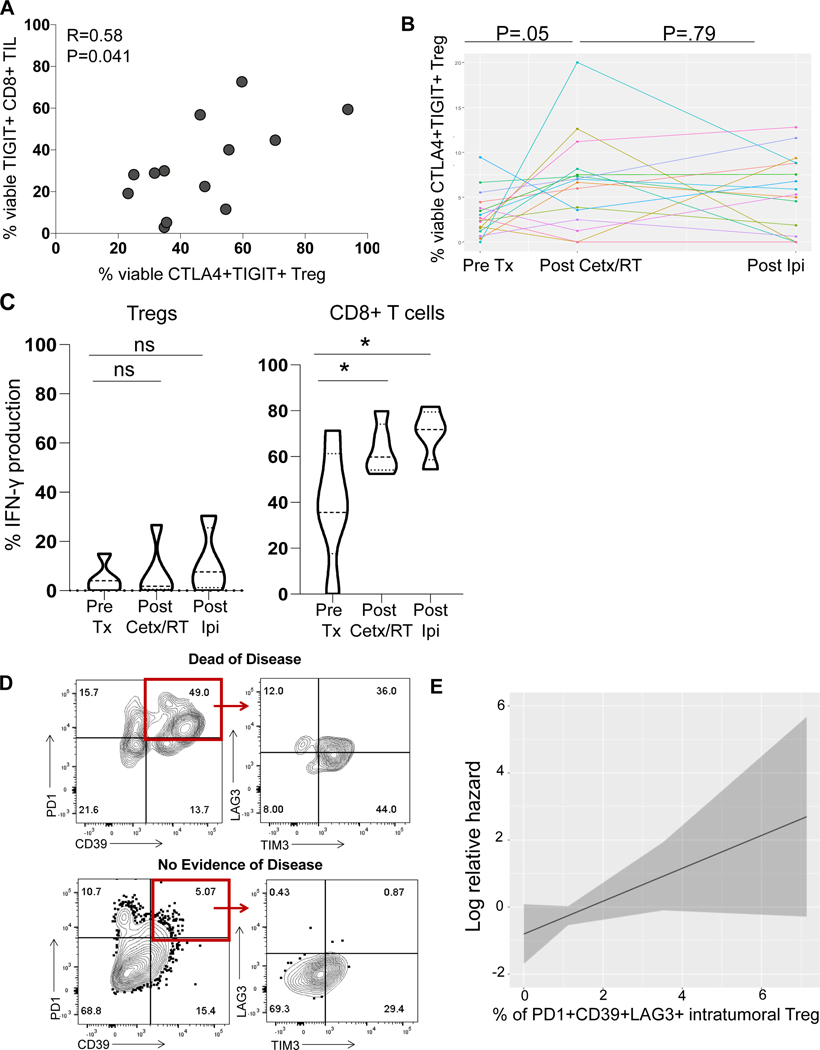
Results: From July 2013 to May 2016, 18 patients enrolled. Two of 6 in cohort 1 (ipilimumab 3 mg/kg) experienced grade 3 dermatologic DLTs, triggering deescalation of ipilimumab to 1 mg/kg. Dose level -1 was expanded to N = 12 without DLT. irAE included: grade 1, 2, and 3 dermatitis (2, 1, and 3 cases), grade 4 colitis (1), and grade 1 hyperthyroidism (1). Three-year disease-free survival (DFS) and overall survival were 72% [90% confidence interval (CI), 57-92] and 72% (90% CI, 56-92). High expression of coinhibitory receptors PD1/LAG3/CD39 on baseline tumor-infiltrating Treg was associated with worse DFS (HR = 5.6; 95% CI, 0.83-37.8; P = 0.08).

Conclusions: The RP2D for ipilimumab plus standard cetuximab-radiotherapy is 1 mg/kg in weeks 5, 8, 11, and 14. The regimen is tolerable and yields acceptable survival without cytotoxic chemotherapy.

Trial registration: ClinicalTrials.gov NCT01935921 NCT02777385.


Figures

Figure 1
Figure 1
a demonstrates gross findings of an erythematous papular rash with pustules involving the trunk, chest and extremities. Histologic findings (not shown) from this patient showed predominantly suppurative inflammation with a lesser granulomatous infiltrate within the dermis and superficial subcutis with accompanying necrobiosis. No changes to the basement membrane were noted, and there was alack of microorganisms. b is of a patient presenting with a fine maculopapular rash over the chest and trunk. A representative histologic section showed focal excoriation with neutrophilic scale and parakeratosis overlying a dense superficial and mid dermal perivascular infiltrate composed of lymphocytes, histiocytes, neutrophils, and scattered eosinophils.
Figure 2
Figure 2
A: Kaplan-Meier plot of progression-free survival from first treatment. Both dose cohorts are combined. Gray bands show the 90% confidence interval. Numbers of patients at risk at six month intervals are shown above the x axis. B: Kaplan-Meier plot of overall survival from first treatment. Both dose cohorts are combined. Gray bands show the 90% confidence interval. Numbers of patients at risk at six month intervals are shown above the x axis. C: Kaplan-Meier plot of progression-free survival from first treatment. Both dose cohorts are combined. Gray bands show the 90% confidence interval. Numbers of patients at risk at six month intervals are shown above the x axis.
Figure 2
Figure 2
A: Kaplan-Meier plot of progression-free survival from first treatment. Both dose cohorts are combined. Gray bands show the 90% confidence interval. Numbers of patients at risk at six month intervals are shown above the x axis. B: Kaplan-Meier plot of overall survival from first treatment. Both dose cohorts are combined. Gray bands show the 90% confidence interval. Numbers of patients at risk at six month intervals are shown above the x axis. C: Kaplan-Meier plot of progression-free survival from first treatment. Both dose cohorts are combined. Gray bands show the 90% confidence interval. Numbers of patients at risk at six month intervals are shown above the x axis.
Figure 3:
Figure 3:
(A) Evaluation of pre-treatment tumor infiltrating lymphocytes (TIL) demonstrates correlation of TIGIT+CD8+ T cells with CTLA4+TIGIT+ Tregs (n=13) (B) Linear analysis of CTLA4+TIGIT+ Tregs in the peripheral blood of patients pre-treatment, post cetux/RT and post Ipi (n=16). Red dotted line indicates a patient with SAE, severe grade III skin reaction. (C) Representative flow cytometry plots of intratumoral Treg (gated on CD4+CD3+FoxP3+ TIL) showing higher percentage of double positive PD1+CD39+ Tregs expressing LAG3 from a patient that died of disease after treatment. Representative flow cytometry plots of intratumoral Treg demonstrating a lower percentage of double positive PD1+CD39+ Tregs expressing LAG3 from a patient that continues to have no evidence of disease on most recent follow up. Patient flow plots in figures D had similar baseline characteristics and risk factors (HPV negative, stage II HNSCC). (D) Summary data of intratumoral Treg expressing PD1+CD39+ Tregs expressing LAG3. (E) Unbiased biostatistical analysis of all combinatorial parameters of patient baseline TIL and serial PBL. Patients with higher percentage of intratumoral Treg expressing PD1+LAG3+CD39+ had a higher hazard ratio of disease recurrence (F) Correlation of PD1+CD39+LAG3+ Treg signature in patient TIL vs. PBL.
Figure 4:
Figure 4:
(A) Evaluation of CD8:Treg ratio in the periphery of HNSCC patients with treatment (n=13), CB= healthy cord blood, AB= healthy adult blood and ratio of CD8:Treg in the periphery of HNSCC patients with survival (n=13). DOD=dead of disease, NED= no evidence of (B) Proliferation of Tregs in the periphery of HNSCC patients with treatment (n=13) (C) Co-expression of CTLA4 and other molecules related to Treg stability in the peripheral blood of HNSCC patients (n=13) (D) Modulation of molecules associated with Treg stability on peripheral CTLA4+ Tregs in HNSCC patients (n=13).
Figure 5:
Figure 5:
(A) Evaluation of granzyme B and IFNγ production in the periphery by CD8+ T cells of HNSCC patients with treatment (n=13), CB= healthy cord blood, AB= healthy adult blood (B) Correlation of IFNγ production by CD8+ T cells in periphery of HNSCC patients with survival (n=13). DOD=dead of disease, NED= no evidence of disease.

References

    1. Dunn GP, Old LJ, Schreiber RD. The immunobiology of cancer immunosurveillance and immunoediting. Immunity 2004;21:137–48. - PubMed
    1. Dunn GP, Bruce AT, Ikeda H, Old LJ, Schreiber RD. Cancer immunoediting: from immunosurveillance to tumor escape. Nat Immunol 2002;3:991–8. - PubMed
    1. Jie HB, Gildener-Leapman N, Li J, et al. Intratumoral regulatory T cells upregulate immunosuppressive molecules in head and neck cancer patients. British journal of cancer 2013;109:2629–35. - PMC - PubMed
    1. Cramer JD, Burtness B, Ferris RL. Immunotherapy for head and neck cancer: Recent advances and future directions. Oral Oncol 2019;99:104460. - PMC - PubMed
    1. Vesely MD, Kershaw MH, Schreiber RD, Smyth MJ. Natural innate and adaptive immunity to cancer. Annual review of immunology 2011;29:235–71. - PubMed

Publication types

MeSH terms

Associated data