. 2022 Mar 23;42(12):2404-2417.
doi: 10.1523/JNEUROSCI.1039-21.2022. Epub 2022 Jan 28.

Mu Opioid Receptors Acutely Regulate Adenosine Signaling in Striatal Glutamate Afferents

Affiliations

Mu Opioid Receptors Acutely Regulate Adenosine Signaling in Striatal Glutamate Afferents

Sweta Adhikary et al. J Neurosci. .

Abstract

Endogenous adenosine plays a crucial role in maintaining energy homeostasis, and adenosine levels are tightly regulated across neural circuits. In the dorsal medial striatum (DMS), adenosine inhibits neurotransmitter release, but the source and mechanism underlying its accumulation are largely unknown. Opioids also inhibit neurotransmitter release in the DMS and influence adenosine accumulation after prolonged exposure. However, how these two neurotransmitter systems interact acutely is also largely unknown. This study demonstrates that activation of µ opioid receptors, but not δ opioid receptors or κ opioid receptors, inhibits tonic activation of adenosine A1Rs via a cAMP-dependent mechanism in both male and female mice. Further, selectively knocking out µ opioid receptors from thalamic presynaptic terminals and postsynaptic medium spiny neurons (MSNs) revealed that activation of µ opioid receptors on D1R-positive MSNs, but not D2R-positive MSNs, is necessary to inhibit tonic adenosine signaling on presynaptic terminals. Given the role of D1R-positive MSNs in movement and motivated behaviors, these findings reveal a novel mechanism by which these neurons regulate their own synaptic inputs.SIGNIFICANCE STATEMENT Understanding interactions between neuromodulatory systems within brain circuits is a fundamental question in neuroscience. The present work uncovers a novel role of opioids in acutely inhibiting adenosine accumulation and subsequent adenosine receptor signaling in the striatum by inhibiting the production of cAMP. Adenosine receptor signaling regulates striatal neurotransmitters, including glutamate, GABA, dopamine, and acetylcholine. Furthermore, interactions between adenosine2A receptors and numerous other GPCRs, including D2 dopamine and CB1 cannabinoid receptors, suggest that endogenous adenosine broadly modulates striatal GPCR signaling. Additionally, this work discovered that the source of resting endogenous extracellular adenosine is likely D1, but not D2 receptor-positive medium spiny neurons, suggesting that opioid signaling and manipulation of D1R-expressing medium spiny neuron cAMP activity can broadly affect striatal function and behavior.

Keywords: adenosine; opioids; striatum; synaptic transmission; thalamus.


Figures

Figure 1.
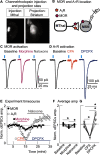
Figure 1.
Activation of both µ opioid receptor and adenosine A1 receptor leads to inhibition of thalamo-striatal oEPSCs. A, An acute mouse brain slice example of overlaid brightfield and epifluorescent images showing the viral injection site (Mthal; left) and the axonal projections (Striatum; right). B, Schematic showing the locations of both A1Rs and MORs in the thalamo-striatal synapse. C, Representative oEPSCs evoked by 470 nm light (black label), inhibition of oEPSC amplitude by morphine (1 μm; pink label), and reversal by naloxone (1 μm; gray label). D, Representative oEPSCs evoked by 470 nm light (black label), inhibition of oEPSC amplitude by CPA (1 μm; orange label), and over-reversal by DPCPX (200 nm; blue label). E, Plot of the time course of normalized oEPSC amplitude for cells treated with morphine, followed by naloxone (dark circles; n = 8 cells, 4 mice), and for cells treated with CPA, followed by DPCPX (clear circles; n = 7 cells, 6 mice). F, Mean summary data of normalized oEPSC amplitude in baseline condition, after morphine perfusion, followed by naloxone (morphine: 0.80 ± 0.05 fraction of baseline, p = 0.0002; naloxone: 0.98 ± 0.01 fraction of baseline, p = 0.002, n = 8 cells, 4 mice, F(2,14) = 17.29, one-way repeated-measures ANOVA, Tukey's multiple comparisons test). G, Mean summary data of normalized oEPSC amplitude in baseline condition, after CPA perfusion, followed by DPCPX (CPA 0.37 ± 0.04 fraction of baseline, p < 0.0001; DPCPX: 1.3 ± 0.08 fraction of baseline, p < 0.0001, n = 7 cells, 6 mice, F(2,12) = 87.95, one-way repeated-measures ANOVA, Tukey's multiple comparisons test). Line and error bars represent mean ± SEM. *Statistical significance.
Figure 2.
Figure 2.
Morphine inhibits adenosine tone in the thalamo-striatal synapse by activating MORs. A, Representative traces of oEPSCs evoked by 470 nm light (black label) and facilitation of oEPSC amplitude by DPCPX (200 nm; blue label). B, Representative traces of oEPSCs evoked by 470 nm light (black label), inhibition of oEPSC amplitude by morphine (1 μm; pink label), and lack of facilitation by DPCPX (200 nm; blue label). C, Plot of the time course of normalized oEPSC amplitude for cells superperfused with DPCPX (dark circles; n = 10 cells, 7 mice), and for cells superperfused with morphine and then DPCPX (clear circle; n = 6 cells, 4 mice). D, Mean summary data of normalized oEPSC amplitude in control and after DPCPX (1.3 ± 0.06 fraction of baseline, p = 0.0003, n = 10 cells, 7 mice, t(9) = 5.752, ratio paired t test). E, Mean summary data of normalized oEPSC amplitude in control, after morphine superperfusion, and after DPCPX superperfusion. Morphine significantly inhibited oEPSC amplitude (morphine 0.78 ± 0.03 fraction of baseline, p = 0.0011; DPCPX: 0.77 ± 0.05 fraction of baseline, p = 0.04, and 0.99 ± 0.06 fraction of morphine, p = 0.84, n = 6 cells, 4 mice, F(2,10) = 14.00, one-way repeated-measures ANOVA, Tukey's multiple comparisons test). F, Representative traces of oEPSCs evoked by 470 nm light (black label) and facilitation of oEPSC amplitude by DPCPX (200 nm; blue label), in slices from global MOR KO mice. G, Representative traces of oEPSCs evoked by 470 nm light (black label), lack of inhibition by morphine (1 μm; pink label), and facilitation of oEPSC amplitude by DPCPX (200 nm; blue label), in slices from global MOR KO mice. H, Plot of the time course of normalized oEPSC amplitude for cells superperfused with DPCPX (dark circles; n = 8 cells, 5 mice), and for cells superperfused with morphine and then DPCPX (clear circle; n = 6 cells, 3 mice). I, Mean summary data of normalized oEPSC amplitude in control and after DPCPX (1.37 ± 0.05 fraction of baseline, p = 0.0001, n = 8 cells, 5 mice, t(7) = 8.273, ratio paired t test). J, Mean summary data of normalized oEPSC amplitude in control, after morphine superperfusion, and after DPCPX superperfusion. Morphine did not inhibit oEPSC amplitude (morphine: 1.0 ± 0.05 fraction of baseline, p = 0.9863), and there was facilitation by DPCPX in the presence of morphine (1.4 ± 0.07 fraction of baseline, p = 0.0006, 1.3 ± 0.09 fraction morphine, p = 0.0008, n = 6 cells, 3 mice, F(2,12) = 17.46, one-way repeated-measures ANOVA, Tukey's multiple comparisons test). Line and error bars represent mean ± SEM. *Statistical significance.
Figure 3.
Figure 3.
Morphine inhibits adenosine signaling via a cAMP-dependent mechanism. A, Representative traces of oEPSCs evoked by 470 nm light (black label), inhibition of oEPSC amplitude by adenosine (100 μm; yellow label), washout of adenosine (gray label), and facilitation of oEPSC by DPCPX (200 nm; blue label) in naive conditions. B, Representative traces of oEPSCs evoked by 470 nm light (black label), inhibition of oEPSC amplitude by adenosine (100 μm; yellow label), washout of adenosine (gray label), and lack of facilitation of oEPSC by DPCPX (200 nm; blue label) in slices preincubated in Ro-20-1724. C, Plot of the time course of normalized oEPSC amplitude for cells superperfused with adenosine followed by washout and then DPCPX in naive slices (dark circles, n = 6 cells, 4 mice) and in slices preincubated in Ro-20-1724 (n = 6 cells, 4 mice). D, Mean summary data of normalized oEPSC amplitude for naive slices in baseline condition, after adenosine superperfusion, followed by a washout and then DPCPX. Adenosine significantly reduced oEPSC amplitude in naive slices, and DPCPX significantly facilitated oEPSC in these slices (adenosine 0.44 ± 0.07 fraction of baseline, p = 0.0094; washout: 1.0 ± 0.05 of baseline, p = 0.999, n = 6 cells, 4 mice, F(3,17) = 13.51, repeated-measures ANOVA, Tukey's multiple comparisons test). E, Mean summary data of normalized oEPSC amplitude for slices incubated in Ro-20-1724 in baseline condition, after adenosine superperfusion, followed by a washout and then DPCPX. Adenosine significantly reduced oEPSC amplitude in these slices (adenosine 0.52 ± 0.08 fraction of baseline, p = 0.0001; washout: 0.87 ± 0.06 of baseline, p = 0.0001, n = 6 cells, 4 mice, F(3,17) = 13.51, repeated-measures ANOVA, Tukey's multiple comparisons test), but DPCPX did not significantly facilitate oEPSCs in these slices (DPCPX: 0.96 ± 0.10 fraction of baseline, p = 0.8755, repeated-measures ANOVA, Tukey's multiple comparisons test). F, Representative traces of oEPSCs evoked by 470 nm light (black label) and facilitation of oEPSC amplitude by DPCPX (200 nm; blue label), in control slices. G, Representative traces of oEPSCs evoked by 470 nm light (black label) and facilitation of oEPSC amplitude by DPCPX (200 nm; blue label), in slices preincubated in CGS21680. H, Representative traces of oEPSCs evoked by 470 nm light (black label) and facilitation of oEPSC amplitude by DPCPX (200 nm; blue label), in slices preincubated in SKF81290. I, Plot of the time course of normalized oEPSC amplitude for cells superperfused with DPCPX in control condition (dark circles; n = 7 cells, 5 mice), for cells preincubated in SKF81290 (clear circles; n = 7 cells, 6 mice), and for cells preincubated in CGS21680 (gray circles; n = 6 cells, 4 mice). J, Mean summary data of normalized oEPSC amplitude in control, in slices preincubated in SKF81297, and CGS21680. The increase in amplitude induced by DPCPX was significantly higher in slices treated with SKF89217 (DPCPX 1.6 ± 0.11 fraction of baseline, p = 0.003) and in slices treated with CGS21680 (p < 0.001, F(5,32) = 32.24, one-way ANOVA, Tukey's multiple comparisons test) compared with control slices. Line and error bars represent mean ± SEM. *Statistical significance.
Figure 4.
Figure 4.
Inhibition of adenosine signaling by opioids is reversible. A, Representative traces of oEPSCs evoked by 470 nm light (black label), inhibition of oEPSC amplitude by ME (1 μm; pink label), lack of facilitation by DPCPX (200 nm; blue label), and an over-reversal of oEPSC after ME washout (gray label). B, Plot of the time course of normalized oEPSC amplitude for cells superperfused with ME, followed by DPCPX in the presence of ME, and then a washout of ME, but not DPCPX (n = 6 cells, 4 mice). C, Mean summary data of normalized oEPSC amplitude in baseline condition, after ME superperfusion, followed by DPCPX, and a washout of ME, but not DPCPX (ME 0.67 ± 0.03 fraction of baseline, p = 0.0002; DPCPX 0.56 ± 0.03 fraction of baseline, p < 0.0001; DPCPX 0.84 ± 0.05 fraction of ME, p = 0.2867, n = 6 cells, 4 mice, F(3,15) = 78.77, repeated-measures one-way ANOVA, Tukey's multiple comparisons test). Line and error bars represent mean ± SEM. *Statistical significance.
Figure 5.
Figure 5.
DORs and KORs do not mediate inhibition of adenosine signaling. A, Representative traces of oEPSCs evoked by 470 nm light (black label), lack of inhibition of oEPSC amplitude by deltorphin (300 nm; pink label), and facilitation by DPCPX (200 nm; blue label). B, Representative traces of oEPSCs evoked by 470 nm light (black label), lack of inhibition of oEPSC amplitude by U69593 (1 μm; pink label), and facilitation by DPCPX (200 nm; blue label). C, Plot of the time course of normalized oEPSC amplitude for cells superperfused with deltorphin (black circles), followed by DPCPX (n = 6 cells, 3 mice), and for cells superperfused with U69 (clear circles), followed by DPCPX (n = 6 cells, 4 mice). D, Mean summary data of normalized oEPSC amplitude in baseline condition, after deltorphin superperfusion, followed by DPCPX (deltorphin: 1.0 ± 0.04 fraction of baseline, p = 0.90; DPCPX: 1.42 ± 0.07 fraction of baseline, p = 0.0002, and 1.40 ± fraction of deltorphin, p = 0.0004, n = 6 cells, 3 mice, F(2,10) = 24.60, repeated-measures one-way ANOVA, Tukey's multiple comparisons test). E, Mean summary data of normalized oEPSC amplitude in baseline condition, after U69593 superperfusion, followed by DPCPX (U69593: 1.02 ± 0.06 fraction of baseline, p = 0.9670; DPCPX: 1.6 ± 0.09 fraction of baseline, p = 0.0051, and 1.6 ± 0.13 fraction of U69593, p = 0.0035, n = 6 cells, 4 mice, F(2,10) = 12.24, repeated-measures one-way ANOVA, Tukey's multiple comparisons test). Line and error bars represent mean ± SEM. *Statistical significance.
Figure 6.
Figure 6.
Presynaptic A1Rs and MORs inhibit thalamo-striatal oEPSCs. A, Representative traces of paired oEPSCs evoked by two optical stimuli (1 ms duration, 50 ms interval, 470 nm LED, cyan lines) from medial thalamic axons under baseline conditions (black) and in the presence of CPA (1 μm, orange) demonstrating a decrease in current amplitude. Right, oEPSCs from left normalized to the peak amplitude of the first oEPSC of the pair to demonstrate PPR between baseline and CPA conditions. B, Summary PPR data under baseline conditions and in the presence of CPA (1 μm) as in A, calculated as the peak amplitude of the second oEPSC/peak amplitude of first oEPSC (p = 0.027, n = 6 cells, 6 mice, t(7) = 3.085, ratio paired t test). C, Representative oEPSCs as in A, evoked under baseline conditions (black) and in the presence of DPCPX (200 nm, blue) plotted as absolute amplitude (left) or normalized to the peak of the first oEPSC (right). D, Summary PPR under baseline conditions and in the presence of DPCPX (200 nm) as in B (p = 0.020, n = 10 cells, 8 mice, t(9) = 2.836, ratio paired t test, n = 10 cells, 8 mice). E, Representative traces of oEPSCs evoked by 470 nm light (black label), inhibition of oEPSC amplitude by DAMGO (1 μm; pink label), and reversal by naloxone (1 μm; gray label) in control mice expressing MORs in presynaptic terminals. F, Representative traces of oEPSCs evoked by 470 nm light (black label), lack of inhibition of oEPSC amplitude by DAMGO (1 μm; pink label), and no effect of naloxone (1 μm; gray label) in mice lacking MORs in presynaptic terminals. G, Plot of the time course of normalized oEPSC amplitude for cells superperfused with DAMGO followed by naloxone in control mice (dark circles, n = 8 cells, 4 mice) and in mice lacking MORs in presynaptic terminals (clear circles, n = 7 cells, 6 mice). H, Mean summary data of normalized oEPSC amplitude in for control mice in baseline condition, after DAMGO superperfusion, followed by naloxone (DAMGO: 0.39 ± 0.05 fraction of baseline, p < 0.0001; naloxone: 0.80 ± 0.06 of baseline, n = 8 cells, 4 mice, F(2,14) = 29.9, repeated-measures one-way ANOVA, Tukey's multiple comparisons test). I, Mean summary data of normalized oEPSC amplitude for presynaptic MOR KO mice in baseline condition, after DAMGO perfusion, followed by naloxone (DAMGO: 0.99 ± 0.02 fraction of baseline, p = 0.6023; naloxone: 0.92 ± 0.05 fraction of baseline, p = 0.14, n = 7 cells, 6 mice, F(2,12) = 2.08, repeated-measures one-way ANOVA, Tukey's multiple comparisons test). Line and error bars represent mean ± SEM. *Statistical significance.
Figure 7.
Figure 7.
Presynaptic MORs do not mediate morphine inhibition of tonic A1R activation. A, Representative traces of oEPSCs evoked by 470 nm light (black label) and facilitation of oEPSC amplitude by DPCPX (200 nm; blue label) in mice lacking MORs in presynaptic terminals. B, Representative traces of oEPSCs evoked by 470 nm light (black label), lack of inhibition of oEPSC amplitude by morphine (1 μm; pink label), and lack of facilitation by DPCPX (200 nm; blue label). C, Plot of the time course of normalized oEPSC amplitude for cells superperfused with DPCPX (dark circles; n = 8 cells, 4 mice), and for cells superperfused with morphine and then DPCPX (clear circle; n = 6 cells, 4 mice). D, Mean summary data of normalized oEPSC amplitude in control and after DPCPX (1.3 ± 0.07 fraction of baseline, p = 0.0012, n = 8 cells, 4 mice, t(7) = 5.225, ratio paired t test). E, Mean summary data of normalized oEPSC amplitude in control, after morphine superperfusion, followed by DPCPX. Morphine did not inhibit oEPSC amplitude (morphine: 1.0 ± 0.07 fraction of baseline, p = 0.9935), and there was no facilitation by DPCPX in the presence of morphine (1.0 ± 0.07 fraction of baseline, p = 0.9119, and 1.0 ± 0.09 fraction of morphine, p = 0.9513, n = 6 cells, 4 mice, F(2,10) = 0.09141, repeated-measures one-way ANOVA, Tukey's multiple comparisons test). Line and error bars represent mean ± SEM. *Statistical significance. F, Representative oEPSCs evoked under baseline conditions (black), in the presence of DPCPX (200 nm, blue), and in the presence of the A2AR antagonist SCH58261 (100 nm) + DPCPX (gray). G, Experiment time course of averaged oESPCs across all cells under baseline conditions (black), in the presence of DPCPX (200 nm, blue bar), and in the presence of the A2AR antagonist SCH58261 (100 nm) + DPCPX (gray bar). H, Summary data plotting average peak amplitude for each cell under baseline, DPCPX, and DPCPX + SCH as in E and F (p = 0.008, F(1.77,12.37) = 7.702 repeated-measures one way ANOVA; p = 0.027 DPCPX vs baseline; p = 0.133 DPCPX + SCH vs baseline Tukey's multiple comparison, n = 8 cells, 5 mice).
Figure 8.
Figure 8.
MORs in D1R-expressing MSNs, but not D2R-expressing MSNs, regulate tonic A1R activation. A, Representative traces of oEPSCs evoked by 470 nm light (black label), facilitation of oEPSC amplitude by DPCPX (100 nm; blue label, mice lacking MORs in D2R-expressing MSNs). B, Representative traces of oEPSCs evoked by 470 nm light (black label), inhibition of oEPSC amplitude by morphine (1 μm; pink label), and lack of facilitation by DPCPX (200 nm; blue label) in mice lacking MORs in D2R-expressing MSNs. C, Plot of the time course of normalized oEPSC amplitude for cells superperfused with DPCPX (dark circles; n = 6 cells, 4 mice), and for cells superperfused with morphine and then DPCPX (clear circle; n = 6 cells, 4 mice). D, Mean summary data of normalized oEPSC amplitude in control and after DPCPX (DPCPX: 1.3 ± 0.05 fraction of baseline, p = 0.0049, n = 6 cells, 4 mice, t(5) = 4.787, ratio paired t test). E, Mean summary data of normalized oEPSC amplitude in control, after morphine superperfusion, and after DPCPX superperfusion. Morphine significantly inhibited oEPSC amplitude (morphine: 0.76 ± 0.03 fraction of baseline, p = 0.0001), but there was no facilitation by DPCPX in the presence of morphine (DPCPX: 0.75 ± 0.02 fraction of baseline, and 0.99 ± 0.04 fraction of morphine, p = 0.9969, n = 6 cells, 4 mice, F(2,10) = 30.38, repeated-measures one-way ANOVA, Tukey's multiple comparisons test). F, Representative traces of oEPSCs evoked by 470 nm light (black label) and facilitation of oEPSC amplitude by DPCPX (200 nm; blue label), in slices from mice lacking MORs from D1R-expressing MSNs. G, Representative traces of oEPSCs evoked by 470 nm light (black label), inhibition by morphine (1 μm; pink label), and facilitation of oEPSC amplitude by DPCPX (200 nm; blue label), in slices from mice lacking MORs from D1R-expressing MSNs. H, Plot of the time course of normalized oEPSC amplitude for cells superperfused with DPCPX (dark circles; n = 5 cells, 3 mice), and for cells superperfused with morphine and then DPCPX (clear circle; n = 5 cells, 3 mice). I, Mean summary data of normalized oEPSC amplitude in control and after DPCPX (DPCPX: 1.4 ± 0.09 fraction of baseline, p = 0.006, n = 5 cells, 3 mice, t(4) = 5.253, ratio paired t test). J, Mean summary data of normalized oEPSC amplitude in control, after morphine superperfusion, and after DPCPX superperfusion. Morphine inhibited oEPSC amplitude (morphine 0.72 ± 0.04 fraction of baseline, p = 0.013), and there was facilitation by DPCPX in the presence of morphine (1.14 ± 0.06 fraction of baseline, p = 0.06 and 1.51 ± 0.08 fraction of morphine, p = 0.0001, 5 cells, 3 mice, F(3,12) = 25.36, repeated-measures one-way ANOVA, Tukey's multiple comparisons test). Naloxone caused an over-reversal of oEPSC amplitude (1.30 ± 0.03 fraction of baseline, p = 0.004). Line and error bars represent mean ± SEM. *Statistical significance. K, Representative traces of oEPSCs evoked by 470 nm light (black label) and facilitation of oEPSC amplitude by DPCPX (200 nm; blue label), in slices from mice with a partial MOR KO from D1R-expressing MSNs. L, Representative traces of oEPSCs evoked by 470 nm light (black label), inhibition by morphine (1 μm; pink label), and facilitation of oEPSC amplitude by DPCPX (200 nm; blue label), in slices from mice with a partial MOR knockdown from D1R-expressing MSNs. M, Plot of the time course of normalized oEPSC amplitude for cells superperfused with DPCPX (dark circles; n = 3 cells, 2 mice), and for cells superperfused with morphine and then DPCPX, followed by naloxone (clear circle; n = 3 cells, 2 mice). N, Mean summary data of normalized oEPSC amplitude in control and after DPCPX (1.38 ± 0.22 fraction of baseline, p < 0.001, n = 6 cells, 5 mice, t(5) = 4.466, ratio paired t test). O, Mean summary data of normalized oEPSC amplitude in control, after morphine superperfusion, after DPCPX superperfusion, and after naloxone superperfusion. Morphine inhibited oEPSC amplitude (morphine: 0.70 ± 0.05 fraction of baseline, p = 0.0003), and there was facilitation by DPCPX in the presence of morphine (DPCPX: 0.91 ± 0.06 fraction of baseline, p = 0.39, and 1.34 ± 0.06 fraction of morphine, p = 0.0086, 6 cells, 4 mice, F(3,15) = 27.12, repeated-measures one-way ANOVA, Tukey's multiple comparisons test). Naloxone caused an over-reversal of oEPSC amplitude (1.2 ± 0.05 fraction of baseline, p = 0.0224). Line and error bars represent mean ± SEM. *Statistical significance.
Figure 9.
Figure 9.
Summary data comparing DPCPX response in the absence and presence of morphine in mice across all genotypes. Ratio of DPCPX facilitation compared with baseline and in morphine condition in WT mice, mice lacking MORs in presynaptic thalamic terminals, postsynaptic D1R-expressing MSNs, and D2R-expressing genotypes. There was no difference in DPCPX responses across genotypes in baseline condition, but mice lacking MORs in D1R-positive MSNs had a higher facilitation by DPCPX in morphine condition compared with WT mice, mice lacking MORs in presynaptic thalamic terminals, and postsynaptic D2R-expressing MSNs (p = 0.03 compared with WT, p = 0.04 compared with presynaptic MOR KOs, and p = 0.03 compared with MOR KO in D2R-positive MSNs, one-way ANOVA, Tukey's multiple comparisons test). Line and error bars represent mean ± SEM. *Statistical significance.
Figure 10.
Figure 10.
Morphine regulates adenosine release in opioid-insensitive cortico-striatal circuit. A, An acute mouse brain slice example of overlaid brightfield and epifluorescent images showing the viral injection site (ACC; left) and the axonal projections recording site (Striatum; right). B, Schematic showing the locations of MORs and A1Rs in the cortico-striatal synapse. C, Representative traces of oEPSCs evoked by 470 nm light (black label) and facilitation of oEPSC amplitude by DPCPX (200 nm; blue label). D, Representative traces of oEPSCs evoked by 470 nm light (black label), lack of inhibition of oEPSC amplitude by morphine (1 μm; pink label), and lack of facilitation by DPCPX (200 nm; blue label). E, Plot of the time course of normalized oEPSC amplitude for cells superperfused with DPCPX (dark circles; n = 7 cells, 4 mice), and for cells superperfused with morphine and then DPCPX (clear circle; n = 6 cells, 5 mice). F, Mean summary data of normalized oEPSC amplitude in control and after DPCPX (DPCPX: 1.42 ± 0.13 fraction of baseline, p = 0.0084, ratio paired t test). G, Mean summary data of normalized oEPSC amplitude in control, after morphine superperfusion, and after DPCPX superperfusion. Morphine did not inhibit oEPSC amplitude, and there was no facilitation by DPCPX in the presence of morphine (morphine: 1.08 ± 0.14 fraction of baseline, p = 0.9595; DPCPX: 0.99 ± 0.03 of baseline, p = 0.9593, and 0.99 ± 0.03 fraction of morphine, p = 0.9835, repeated-measures ANOVA, Tukey's multiple comparisons test). Line and error bars represent mean ± SEM. *Statistical significance.
Figure 11.
Figure 11.
Summary diagram of potential mechanism of morphine-mediated inhibition of tonic adenosine A1R signaling. Tonic A1R activation is able to inhibit glutamate release from MOR-expressing medial thalamic terminals and MOR-lacking ACC terminals in dorsomedial striatum. Morphine activation of MORs on D1-expressing MSNs decreases extracellular adenosine by inhibition of AC, which decreases extracellular striatal adenosine concentration, thereby decreasing A1R activation (and presumably A2AR activation) in a paracrine manner. Created using www.biorender.com.

References

    1. Al-Hasani R, McCall JG, Shin G, Gomez AM, Schmitz GP, Bernardi JM, Pyo CO, Park S, Marcinkiewcz CM, Crowley NA, Krashes MJ, Lowell BB, Kash TL, Rogers JA, Bruchas MR (2015) Distinct subpopulation of nucleus accumbens dynorphin neurons drive aversion and reward. Neuron 87:1063–1077. 10.1016/j.neuron.2015.08.019 - DOI - PMC - PubMed
    1. Atwood BK, Kupferschmidt DA, Lovinger DM (2014) Opioids induce dissociable forms of long-term depression of excitatory inputs to the dorsal striatum. Nat Neurosci 17:540–548. 10.1038/nn.3652 - DOI - PMC - PubMed
    1. Balleine BW, Delgado MR, Hikosaka O (2007) The role of the dorsal striatum in reward and decision-making. J Neurosci 27:8161–8165. 10.1523/JNEUROSCI.1554-07.2007 - DOI - PMC - PubMed
    1. Banghart MR, Neufeld RS, Wong NC, Sabatini BL (2015) Enkephalin disinhibits mu opioid receptor-rich striatal patches via delta opioid receptors. Neuron 88:1227–1239. 10.1016/j.neuron.2015.11.010 - DOI - PMC - PubMed
    1. Bertran-Gonzalez J, Laurent V, Chieng BC, Christie MJ, Balleine BW (2013) Learning-related translocation of delta-opioid receptors on ventral striatal cholinergic interneurons mediates choice between goal-directed actions. J Neurosci 33:16060–16071. 10.1523/JNEUROSCI.1927-13.2013 - DOI - PMC - PubMed

Publication types

LinkOut - more resources