. 2022 Jan 28;13(1):571.
doi: 10.1038/s41467-022-28142-w.

Mesenchymal stromal cell-derived septoclasts resorb cartilage during developmental ossification and fracture healing

Affiliations

Mesenchymal stromal cell-derived septoclasts resorb cartilage during developmental ossification and fracture healing

Kishor K Sivaraj et al. Nat Commun. .

Abstract

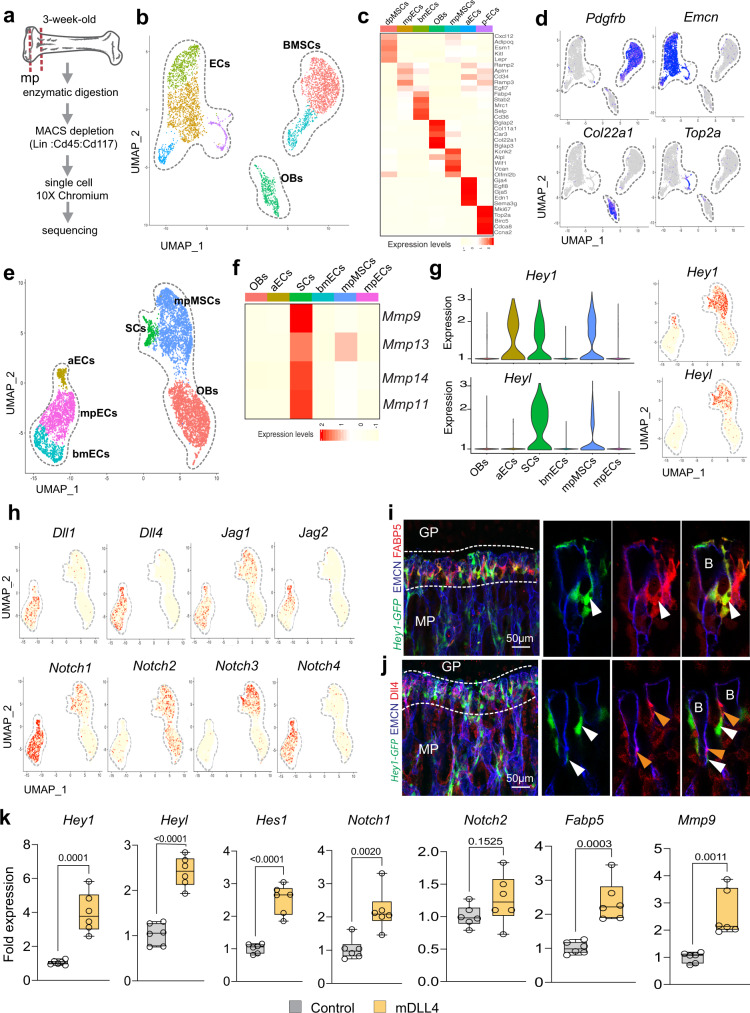
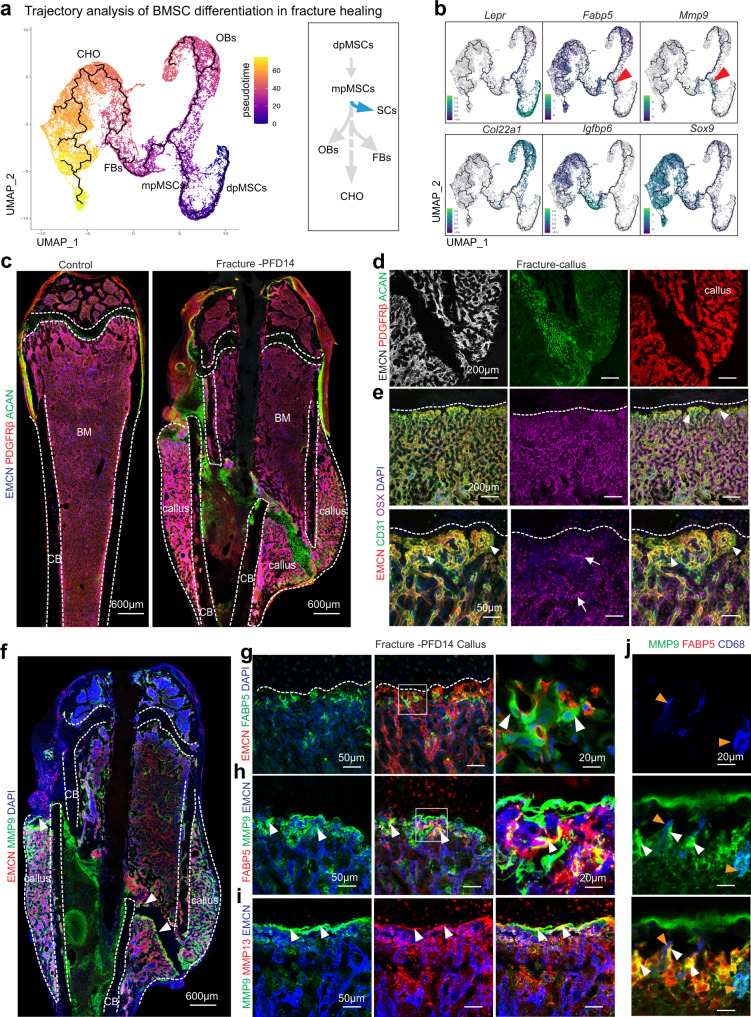
Developmental osteogenesis, physiological bone remodelling and fracture healing require removal of matrix and cellular debris. Osteoclasts generated by the fusion of circulating monocytes degrade bone, whereas the identity of the cells responsible for cartilage resorption is a long-standing and controversial question. Here we show that matrix degradation and chondrocyte phagocytosis are mediated by fatty acid binding protein 5-expressing cells representing septoclasts, which have a mesenchymal origin and are not derived from haematopoietic cells. The Notch ligand Delta-like 4, provided by endothelial cells, is necessary for septoclast specification and developmental bone growth. Consistent with the termination of growth, septoclasts disappear in adult and ageing bone, but re-emerge in association with growing vessels during fracture healing. We propose that cartilage degradation is mediated by rare, specialized cells distinct from osteoclasts. Our findings have implications for fracture healing, which is frequently impaired in aging humans.


Conflict of interest statement

The authors declare no competing interests.

Figures

Fig. 1
Fig. 1. Characterization of SCs.
a, b Tile scan confocal longitudinal view of 3-week-old wild-type femur with FABP5+ (green) SCs around distal vasculature (EMCN, red) near the growth plate (GP, dashed lines) (a). SCs associated with distal EC buds (B) (arrowheads) at chondro-osseous border (COB) (dashed lines). Image on the right show higher magnifications of boxed area (b). Enrichment of FABP5+ cells is not seen near or inside cortical bone (CB) in the diaphysis (bottom). BM, bone marrow. Quantification shows number of SCs in COB compared to metaphysis (MP). (n = 6). c FABP5+ SCs (red; arrowheads) associated with CD31+ vessels (grey) at the COB show expression of Pdgfra-GFP reporter (green) and PDGFRβ+ (magenta). The image at higher magnification on the right depicts FABP5+ cells with nuclear GFP expression (arrowheads) in association with distal EC bud (B). Graph shows percentage of Pdgfra-GFP+ cells among SCs (n = 6). d FABP5+ SCs (white arrowheads, red) are concentrated near the growth plate (GP, dashed line), whereas CD68+ (orange arrowheads, green) osteoclasts (OCs) are widely distributed throughout 3-week-old femoral metaphysis. Quantification of SCs relative to OCs around vascular buds (n = 6). e Electron micrographs of metaphysis showing SCs, ECs, osteoblastic cells (OB), and OCs, as indicated. Cells in top left image are false coloured. The endoplasmic reticulum (ER) of SCs is enlarged (yellow arrowheads) and covered by ribosomes, whereas other cells (asterisks) have narrow ER cisternae. SCs are rich in actin filaments (red arrowhead, bottom right panel). (n = 3). f Confocal image of E17.5 femur showing Pdgfra-GFP (green) reporter and FABP5+ SCs (arrowheads, red) near growth plate (gp, dashed line). Quantification of E16.5 in graph on the right (n = 5). g Increase of FABP5+ SCs (green, arrowheads) near growth plate (GP) at P1, P6, and P14. Quantification in graph on the right shows changes in septoclasts during postnatal development (n = 5; Statistical analysis performed using Tukey multiple comparison test (one-way Anova). ECs, EMCN (red); nuclei, DAPI (blue). h Schematic representation of SCs, ECs in vessel buds, OCs, osteoblastic cells (OBs), mesenchymal stromal cells (MSC), and hypertrophic chondrocytes (HC) at the chondro-osseous border. n = biological independent samples and data are presented as mean values ± SEM. bd, f Statistical analysis performed using Mann–Whitney test (two-tailed). Source data are provided in a Source data file.
Fig. 2
Fig. 2. Molecular signature and differentiation of SCs.
a Preparation of 3-week-old Pdgfra-GFP metaphysis-epiphysis region from femur and tibia for scRNA-seq analysis. b, c scRNA-seq of 3-week-old Pdgfra-H2BGFP reporter bone. UMAP plot of colour-coded cell clusters within Pdgfra-GFP+ positive cells (b) and visualization of cell type-specific marker genes (c). df Monocle trajectory analysis of BMSC lineage differentiation with coloured cell clusters (d) and representation of individual cluster in trajectory (e). Cell type-specific relative gene expression shown in pseudo-time (f). g, h Representative confocal images of 3-week-old Pdgfrb-CreERT2 R26-mT/mG reporter femur with GFP+ (green) and FABP5+ (red) SCs (arrowheads) near vessel buds (B). Bottom panels show a single optical plane (left) and higher magnifications of the boxed area (centre and right), respectively (g). Vav1-Cre-controlled R26-mT/mG reporter activation (GFP expression) labelling hematopoietic cells and osteoclasts (arrow) but not FABP5+ (red) SCs (arrowheads) (h). Independent animals, g, h (n = 4).
Fig. 3
Fig. 3. Septoclast function in bone.
a Scatter plot showing differential gene expression (DGE) in SCs relative to other bone mesenchymal stromal cells. DGE are Log2 fold scale and significant differences are represented by blue dots. b Gene-set enrichment analysis for significantly upregulated genes in SCs. c Heatmap showing expression of Fabp5 and various genes encoding metalloproteinases in SCs relative to other cell populations, namely diaphyseal MSCs (dpMSCs1 and dpMSCs2), metaphyseal MSCs (mpMSCs), osteoblasts (OBs), and proliferating bone mesenchymal stromal cells (p-BMSCs). d, e Maximum intensity projection of 3-week-old wild-type femur showing high MMP9 staining in SCs (arrowheads) (d). MMP13 (red) expression in MMP9+ (green) CD68- cells (white arrowheads) but also in CD68+ (blue) OCs (orange arrowheads) (e). f Confocal image showing MMP9 (green) immunosignals around ACAN+ (cartilage-specific proteoglycan core protein aggrecan) (red) hypertrophic chondrocytes (HC, arrowheads). g Acan-CreERT2-labelled (GFP, green) chondrocyte fragments in FABP5+ (red) SCs (white arrowheads) but not in CD68+ OCs (orange arrowheads) in proximity of the growth plate. h High magnification confocal images showing strong LAMP1 (green) signal in FABP5+ SCs (red, white arrowhead) relative to vATPase+ (red, orange arrowheads) OCs. DAPI (blue). i Double immunogold labelling showing strong LAMP1 staining (15 nm gold, yellow arrowheads) in SCs relative to vATPase-labelled (10 nm gold, orange arrowheads) OCs. ER, endoplasmic reticulum; LYS, lysosome. j FABP5+ SCs (arrowheads) decline in adult and ageing femurs relative to juvenile metaphysis. GP, growth plate; EPI, ephiphyseal line. Quantitation is shown on the right (n = 6 biologically independent samples; data are presented as mean values ± SEM, p-values. Statistical analysis was performed using Tukey multiple comparison test (one-way Anova). Source data are provided in a Source data file. k Schematic summary showing MMP secretion by EC-associated SCs to degrade growth plate matrix, and phagocytosis of hypertrophic chondrocytes (HC) debris. Independent animals, dh (n = 5–6) and i (n = 3).
Fig. 4
Fig. 4. Identification of Notch as mediator of EC–SC interactions.
a Preparation of non-haematopoietic bone stromal cells for scRNA-seq analysis. bd UMAP plot showing colour-coded cell clusters in bone stromal cells (b). Top 5 marker genes shown in heatmap (c). Feature blots of cell type-specific markers: Emcn—Endothelial cells (ECs); Col22a1—osteoblastic cells (OBs); Pdgfrb—bone mesenchymal stromal cells (BMSCs); Top2a—proliferating cells (d). e, f Visualization of subclusters in merged scRNA-seq data from Pdgfra-GFP+ cells and non-haematopoietic stromal cells. Indicated are arterial (aECs), metaphyseal (mpECs) and bone marrow (bmECs) ECs in addition to SCs, OBs and metaphyseal MSCs (mpMSCs) (e). Heatmaps of Mmp9, Mmp13, Mmp14, and Mmp11 expression in SCs relative to other cell populations (f). g, h Violin and UMAP plots showing high expression of Notch target genes Hey1 and Heyl in SCs and lower levels in mpMSCs (g). Expression of Notch ligand transcripts and Notch1 and Notch4 by ECs. Multiple Notch receptor transcripts are also found in SCs and mpMSCs (h). i, j Confocal image showing Hey1-GFP (green) in FABP5+ (red) SCs (white arrowheads) near vessel buds (B) but also in mpMSCs in 3-week-old femur (i). DLL4 (red) marks bud ECs (orange arrowheads) next to Hey1-GFP+ perivascular SCs (white arrowheads) (j). Independent animals, i, j (n = 4). k RT-qPCR analysis shows that Notch target genes Hey1, Heyl, Hes and expression of Fabp5 and Mmp9 are significantly increased ex vivo by stimulation of SCs with immobilized recombinant mouse DLL4 (n = 6 control and mDll4 treated samples in three independent experiments. Data are presented as mean values ± SEM. Statistical analysis was performed using Mann–Whitney test (two-tailed). Source data are provided in a Source data file.
Fig. 5
Fig. 5. Endothelial Notch ligand Dll4 controls SC functions.
a Experimental scheme showing tamoxifen-inducible Dll4 inactivation in ECs with Cdh5-CreERT2 transgenic mice in the Hey1-GFP reporter background. b Representative confocal images showing strongly reduced Hey1-GFP expression after Dll4 inactivation in ECs (Dll4iΔEC) compared to CreERT2-negative control. Growth plate (GP, dashed line), metaphysis (MP) and distal vessel buds (B) are indicated. SCs, FABP5 (red); nuclei, DAPI (blue). Independent animals, a, b (n = 5). c, d Septoclast number and expression of Hey1-GFP and FABP5 (red) are reduced in Dll4 iΔEC mutant bone metaphysis compared to control (arrowheads) (c). Quantification of data (arbitrary units) (d). (no. of SC n = 5 control and mutant bones; expression in SCs n = 4 bones × 10 cells; data are presented as mean values ± SEM. Statistical analysis performed using Mann–Whitney test (two-tailed). e Confocal images showing reduction of total and SC-associated (green, arrowheads) MMP9 immunostaining in Dll4iΔEC mutants relative to control. Graph shows quantification of MMP9 expression in SCs (arbitrary units) n = 4 bones × 10 SCs; data are presented as mean values ± SEM. Statistical analysis performed by Mann–Whitney test (two-tailed). f Confocal images showing accumulation of hypertrophic chondrocytes (HC) in Dll4iΔEC growth plate (GP). EMCN, ECs (red); DAPI, nuclei (blue). GP length and HC number are increased in mutants (n = 5 control and mutant bone; data are presented as mean values ± SEM, Statistical analysis performed using Mann–Whitney test (Two-tailed). g Proposed model of Dll4-controlled interactions between bud ECs and SCs in the regulation of MMP9 expression and resorption of hypertrophic chondrocytes. d-f, source data are provided in a Source data file.
Fig. 6
Fig. 6. Single cell RNA-sequencing analysis of healing bone fractures.
a Preparation of non-haematopoietic stromal cells from PFD14 and control bone for scRNA-seq analysis. b UMAP plots showing colour-coded cell clusters from control and PFD14 bone. Cell types and numbers per cluster are displayed on the right. ce Heatmap showing the top 5 marker genes for each cluster (c). Feature blots showing markers for non-haematopoietic bone cells: Acan—chondrocytes (CHO); Igfbp6—fibroblasts (FB); Pdgfrb—bone mesenchymal stromal cells (BMSCs); Col22a1—osteoblast lineage cells (OBs); Emcn—ECs; Rgs5—Smooth muscle cells (SMCs) (d). Comparison of marker gene expression in PFD14 and control samples (e). Haematopoietic cells (HCs-1,2,3,4). f, g UMAP plots showing colour-coded BMSC subclusters from control and PFD14 bone (f). Fabp5 and Mmp9 expressing cells are increased in PFD14 samples (g). h, i UMAP plot showing mpMSCs and SCs in the control and PFD14 mpMSC subcluster (h). Fracture-derived SCs show higher expression of Mmp9 and Fabp5 (i).
Fig. 7
Fig. 7. Septoclasts in fracture healing.
a, b. Monocle trajectory analysis of BMSC lineage cell differentiation path during fracture repair (a). Expression of marker genes is displayed in trajectory. Red arrowhead indicates Mmp9+ and Fabp5+ cells in proximity of mpMSC cluster (b). ce Tile scan confocal images of PFD14 and age-matched control femur showing ECs (EMCN, blue), BMSCs (PDGFRβ, red) and chondrocytes (ACAN, green) (c). High magnification images showing avascular regions of callus containing ACAN+ chondrocytes and PDGFRβ+ BMSCs associated with vessels (d). Low and high magnification images showing CD31hi (green) and EMCNhi (red) vessels and endothelial buds (arrowheads) in proximity of callus chondrocytes. OSX+ (purple) cells (arrows) are abundant around vessels (e). fj Tile scan confocal image of PFD14 femur showing MMP9 (green) at the vessel front in the callus (arrowheads) and, at lower level, in the metaphysis near growth plate. Dashed lines mark cortical bone (CB), bone marrow (BM), callus area, and growth plate (f). Representative confocal image of PFD14 callus with FABP5+ (green) SCs associated with distal EMCN+ (red) vessels (arrowheads) (g). High magnifications images show MMP9 and MMP13 immunosignals in the region containing SCs (arrowheads) (h, i). Weaker MMP9 signals relative to SCs (white arrowheads) mark CD68+ (blue) OCs (orange arrowheads) in the PFD14 callus (j). ci (control = 5 and fracture = 4) independent biological samples.

References

    1. Kronenberg HM. Developmental regulation of the growth plate. Nature. 2003;423:332–336. - PubMed
    1. Einhorn TA, Gerstenfeld LC. Fracture healing: mechanisms and interventions. Nat. Rev. Rheumatol. 2015;11:45–54. - PMC - PubMed
    1. Yip RKH, Chan D, Cheah KSE. Mechanistic insights into skeletal development gained from genetic disorders. Curr. Top. Dev. Biol. 2019;133:343–385. - PubMed
    1. Boyle WJ, Simonet WS, Lacey DL. Osteoclast differentiation and activation. Nature. 2003;423:337–342. - PubMed
    1. Gartland A, et al. Septoclast deficiency accompanies postnatal growth plate chondrodysplasia in the toothless (tl) osteopetrotic, colony-stimulating factor-1 (CSF-1)-deficient rat and is partially responsive to CSF-1 injections. Am. J. Pathol. 2009;175:2668–2675. - PMC - PubMed

Publication types

MeSH terms

LinkOut - more resources