. 2022 Jan 28;8(1):2.
doi: 10.1038/s41526-021-00187-z.

Numerical characterization of astronaut CaOx renal stone incidence rates to quantify in-flight and post-flight relative risk

Affiliations

Numerical characterization of astronaut CaOx renal stone incidence rates to quantify in-flight and post-flight relative risk

Debra A Goodenow-Messman et al. NPJ Microgravity. .

Abstract

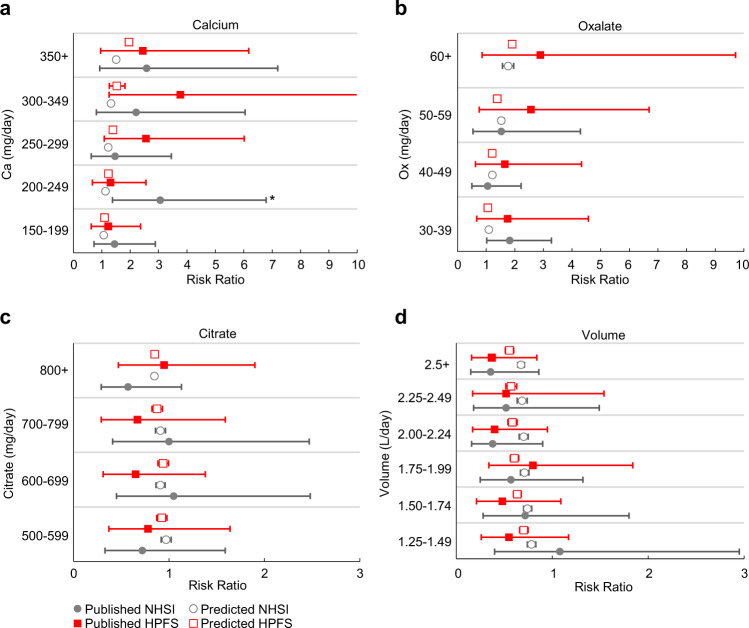
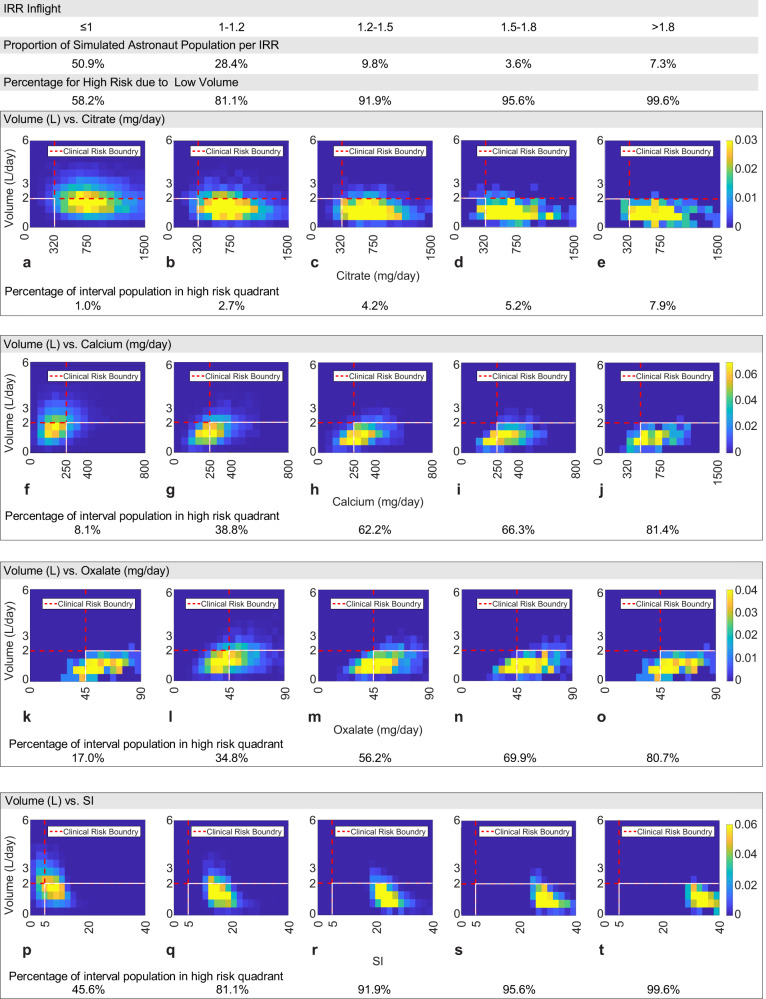
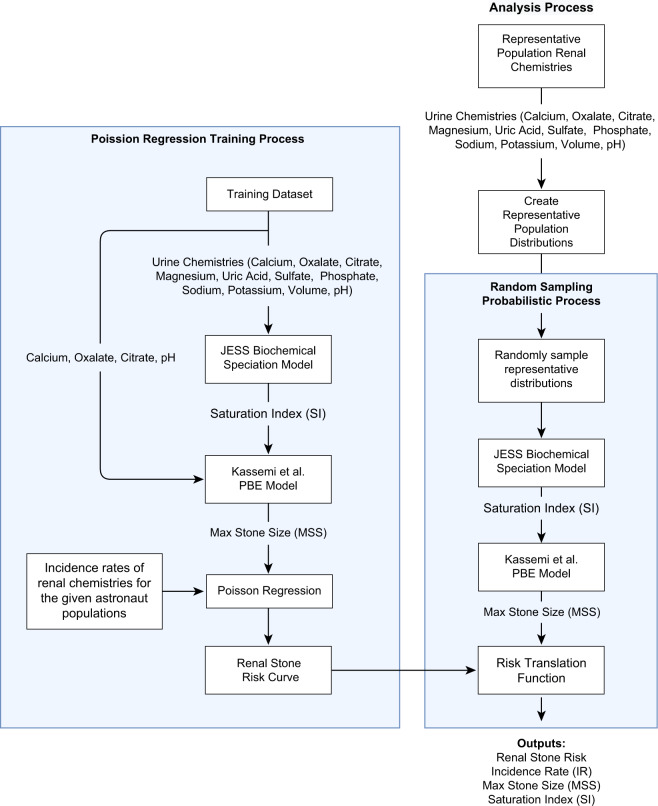
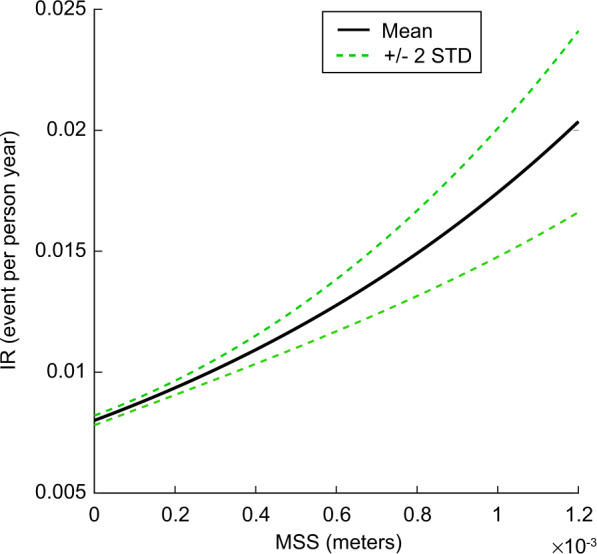
Changes in urine chemistry potentially alter the risk of renal stone formation in astronauts. Quantifying spaceflight renal stone incidence risk compared to pre-flight levels remains a significant challenge for assessing the appropriate vehicle, mission, and countermeasure design. A computational biochemistry model representing CaOx crystal precipitation, growth, and agglomeration is combined with a probabilistic analysis to predict the in- and post-flight CaOx renal stone incidence risk ratio (IRR) relative to pre-flight values using 1517 astronaut 24-h urine chemistries. Our simulations predict that in-flight fluid intake alone would need to increase from current prescriptions of 2.0-2.5 L/day to ~3.2 L/day to approach the CaOx IRR of the pre-flight population. Bone protective interventions would reduce CaOx risk to pre-flight levels if Ca excretion alone is reduced to <150 mg/day or if current levels are diminished to 190 mg/day in combination with increasing fluid intake to 2.5-2.7 L/day. This analysis provides a quantitative risk assessment that can influence the critical balance between engineering and astronaut health requirements.


Conflict of interest statement

The authors declare no competing interests.

Figures

Fig. 1
Fig. 1. Comparison of estimated symptomatic calcium kidney stone occurrence rates for astronaut risk.
Comparing occurrence rates, including first presentation incidence rates, evaluated for the overall population, all pre-flight, in-flight, post-flight astronauts, the NASA IMM Risk Model, analogous pre-flight astronaut non-stone former aviator assumption, and 1-year post-flight astronauts to recurrent stone formers illustrates the degree of ambiguity possible in predicting astronaut symptomatic calcium kidney stone formation rates. The calculations for the 1-year post-flight astronaut rate are described in the “Methods” and tabulated in Table 4 with all population incidence and recurrence rates identified for this study. The overall population rate is below the astronauts’ rate. This is to be expected, considering the astronaut population has a higher proportion of males than the general population, and males have a higher incidence rate of renal stones. Additionally, the various astronaut incidence rate estimates either include post-flight astronauts or are premised on analogous aviator population data that have a higher incidence of renal stones, as shown in the “Methods”.
Fig. 2
Fig. 2. Characterization of numerical predictions for known stone formers (SF) and non-stone formers (NSF) population urine chemistries.
The model’s ability to predict differences in SF and NSF populations is illustrated by contrasting male and female stone formers (SF) and non-stone formers (NSF) population urine chemistries from case and control sources [A] and [B]. In a, each numerically predicted IRR distribution is normalized using the case and control pair’s control group mean predicted IR as the reference. In b, the SI of each case and control pair, as determined by JESS, is presented. SI values in b are not normalized by the control mean of each pair.
Fig. 3
Fig. 3. Comparisons of the published Curhan HPFS and NHSI populations relative risk ratios to numerically predicted risk ratios.
The numerical estimates utilize sample populations derived from the published mean and standard deviation for each urine constituent: a calcium, b oxalate, c citrate, and d urine volume. The combined case’s and control’s urine constituent statistics were used to create a gamma distribution which was then sampled, to create 10,000 representative urine samples for the sample population predictions. Markers illustrate the mean value of each referent and predicted population and the whiskers represent the 95% confidence intervals of the mean. * indicates that the published and predicted pair show a statistically significant difference with P < 0.05.
Fig. 4
Fig. 4. IRR distribution of the modeled astronaut population per flight phase.
The predicted variation in renal stone risk for each simulated flight phase is shown following the renal stone risk analysis process described in the “Methods” section with a IRR distributions represented as box plots, b pie charts of the percentage of the simulated astronaut populations at select IRR intervals c cumulative density graphs of IRR, and d cumulative density graphs of SI for the simulated astronaut population. The estimated IR data is normalized to IRR using the predicted mean pre-flight incidence rate. We chose the IRR ranges in c to correspond to relatively important IRR ranges identified in the referent analysis or where natural cutoffs existed in the data set.
Fig. 5
Fig. 5. In-flight urine constituent concentration and CaOx Supersaturation Index (SI) heat maps at select IRR risk intervals.
Each row of heat maps identifies the distribution of paired urine chemistry constituent data, while each column represents the percentage of the total simulated population that falls into that IRR interval. Calcium (fj) and oxalate (ko) represent the primary components of CaOx stones and citrate (ae) represents urine chemistry modulation via dietary countermeasures. 24-h urine volume is considered a common factor as the denominator in determining the relative concentration of the other three constituents. SI (pt) is used to represent the integrated impact of these constituents. The color of each cell in the heat map represents the relative percentage of the population within that risk interval that exhibits the paired constituent values of the cell location on the heat map. Each heat map includes a nominal characteristic threshold for each constituent (dashed line) and the quadrant where both constituents contribute to a higher risk of renal stones in a terrestrial population (outlined by the solid line) per representative renal stone clinical risk levels as defined by the UT Southwestern Medical Center Stone Profile. The characteristic threshold for SI is chosen based on published assessments of JESS CaOx SI calculations distinguishing SF and NSF populations derived from Rodgers et al.. The color bar is scaled per urine constituent chemistry.
Fig. 6
Fig. 6. Plots of the proportion of the simulated astronaut population with IRR ≥ 1.2 with respect to 24-h urine levels.
Each figure demonstrates the population proportion with IRR > 1.2 when evaluated independently for a calcium, b oxalate, c SI, d citrate, and e 24-h volume levels used in the in-flight, post-flight and pre-flight simulations. Points on each curve represent the midpoint of each bin range: a calcium ± 50 mg/day, b oxalate ± 10 mg/day, c SI ± 1, d citrate ± 100 mg/day, and e volume ± 0.125 L/day. These bin sizes ensure at least 100 simulated results reside in each datapoint to maintain a representation of the other stone formation factors. It is to be noted that the pre-flight IRR ≥ 1.2 population proportion level is illustrated by the solid horizontal line on each graph.
Fig. 7
Fig. 7. Illustration of renal stone incidence rate prediction model training and analysis processes.
The left-hand side of the figure illustrates the use of individualized urine chemistries in sequential calculations of SI and PBE-MSS, known stone-forming characteristics (stone former, non-stone former), spaceflight status characteristics (pre- and post-flight), and estimates of the appropriate population incidence distributions (Fig. 1) in order to develop an MSS to IR relation utilizing Poisson regression. The right-hand side of the figure illustrates a similar process for the analysis, where representations of urine constituent population statistics are used to generate >10,000 unique urine combinations from which SI, MSS, and IR calculations are combined in a Monte Carlo process to predict the astronaut population risk.
Fig. 8
Fig. 8. Relationship of IR to MSS as determined via Poisson regression for rates.
The largest MSS for a complete pre- and post-flight data set is 1.2 × 10⁻³ m. Rather than extrapolating, we assign the max calculated incidence rate of the regression when the MSS exceeds the limits of the training data. Therefore, to keep the model within the fit’s limits, the incidence rate output is not reported as greater than at 2.07 × 10² person-years. All IRR are calculated by dividing the discrete, predicted, IR values by the appropriate reference population predicted IR mean value. The parameter values for the resultant curve of the regression are A 8.0027 × 10⁻³ person-years, and B 7.7804 ×10² (1/m).

References

    1. Sibonga, J. D. & Pietrzyk, R. Evidence report: risk of renal stone formation. Evid. Rep. NASA Hum. Res. Progr. NTRS JSC-CN-39600. https://ntrs.nasa.gov/ (2017).
    1. NASA. Human Research Roadmap. https://humanresearchroadmap.nasa.gov/Evidence/ (2020).
    1. Buckey, J. C. Space Physiology (Oxford University Press, 2006).
    1. Clément, G. Fundamentals of Space Medicine (Microcosm Press, 2011).
    1. Demontis GC, et al. Human pathophysiological adaptations to the space environment. Front. Physiol. 2017;8:547. - PMC - PubMed