. 2022 Jan 28;7(1):9.
doi: 10.1038/s41525-021-00277-7.

Oligonucleotide correction of an intronic TIMMDC1 variant in cells of patients with severe neurodegenerative disorder

Affiliations

Oligonucleotide correction of an intronic TIMMDC1 variant in cells of patients with severe neurodegenerative disorder

Raman Kumar et al. NPJ Genom Med. .

Abstract

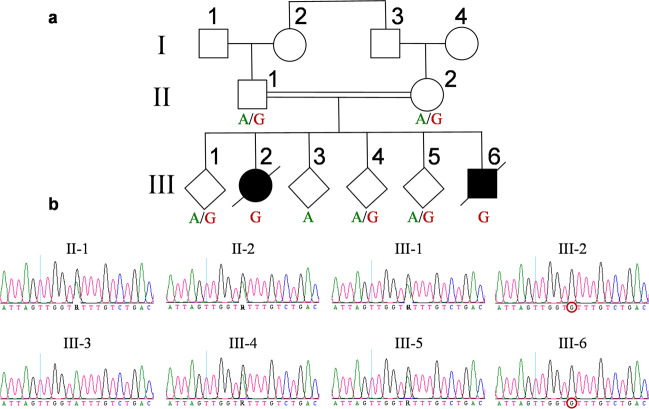
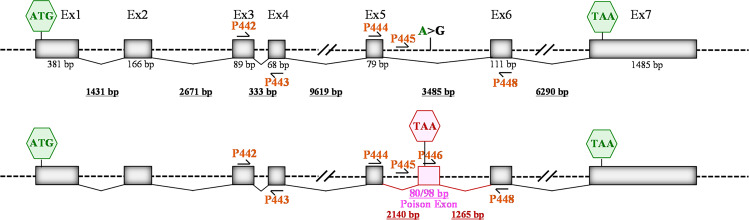
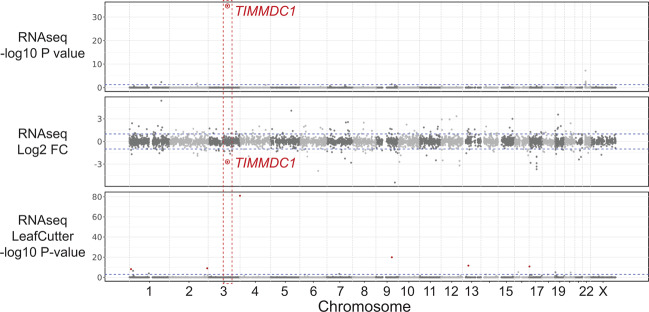
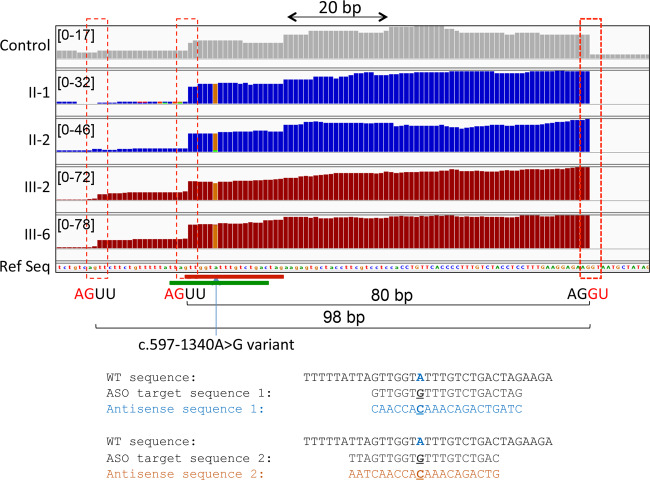
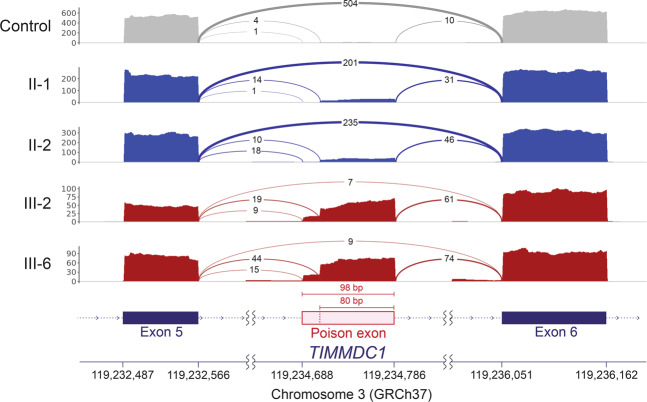
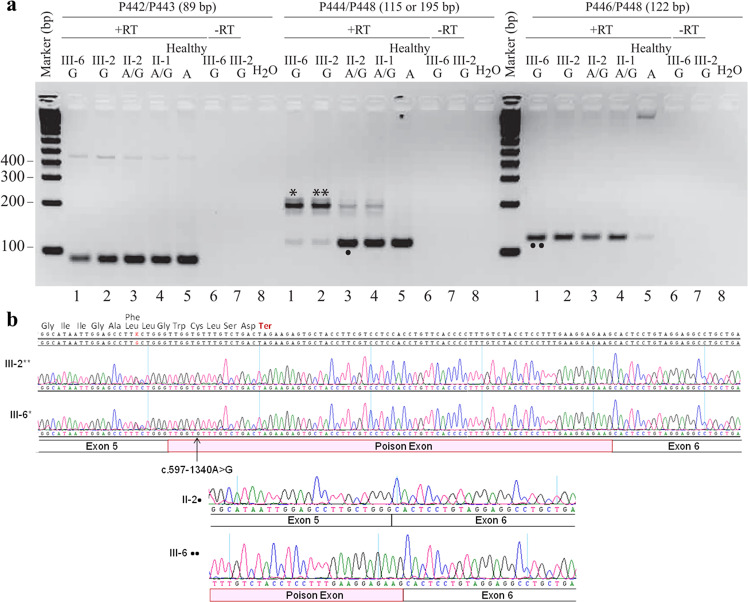
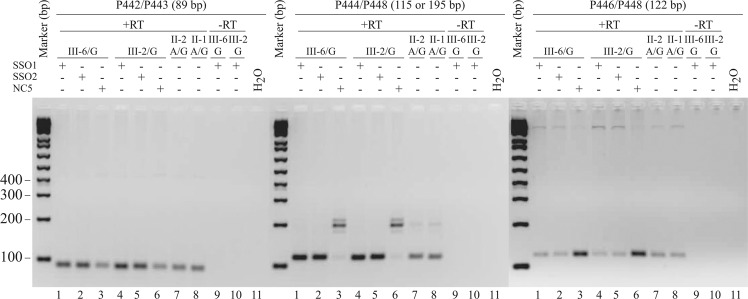
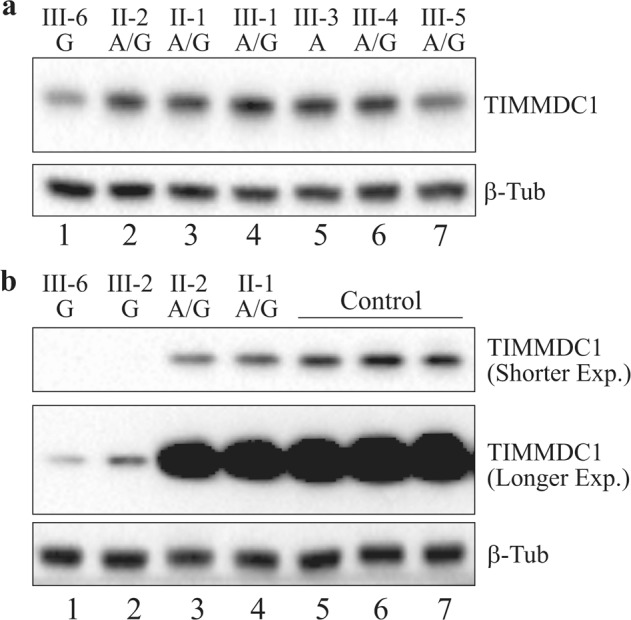
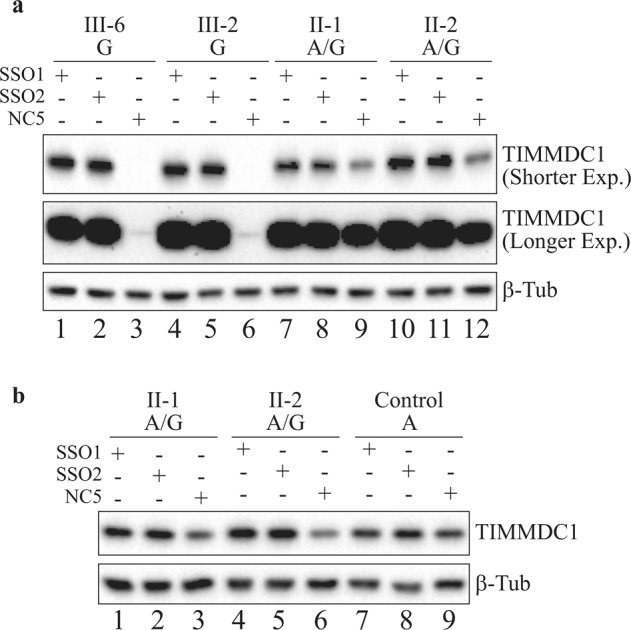
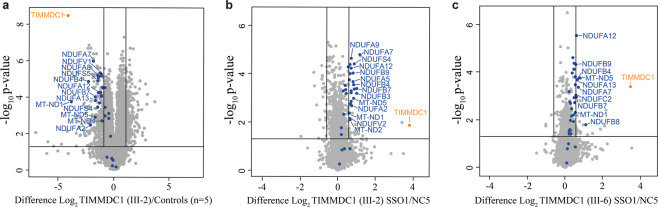
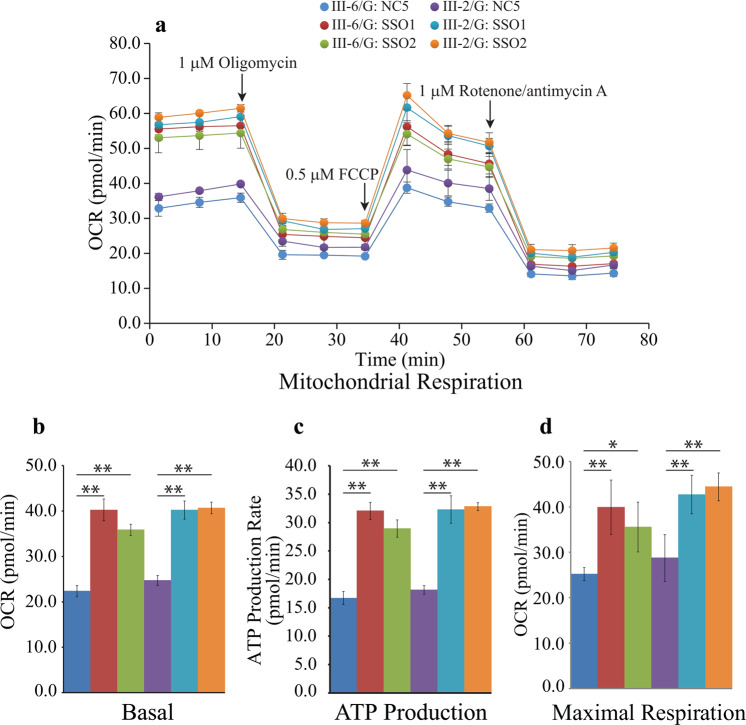
TIMMDC1 encodes the Translocase of Inner Mitochondrial Membrane Domain-Containing protein 1 (TIMMDC1) subunit of complex I of the electron transport chain responsible for ATP production. We studied a consanguineous family with two affected children, now deceased, who presented with failure to thrive in the early postnatal period, poor feeding, hypotonia, peripheral neuropathy and drug-resistant epilepsy. Genome sequencing data revealed a known, deep intronic pathogenic variant TIMMDC1 c.597-1340A>G, also present in gnomAD (~1/5000 frequency), that enhances aberrant splicing. Using RNA and protein analysis we show almost complete loss of TIMMDC1 protein and compromised mitochondrial complex I function. We have designed and applied two different splice-switching antisense oligonucleotides (SSO) to restore normal TIMMDC1 mRNA processing and protein levels in patients' cells. Quantitative proteomics and real-time metabolic analysis of mitochondrial function on patient fibroblasts treated with SSOs showed restoration of complex I subunit abundance and function. SSO-mediated therapy of this inevitably fatal TIMMDC1 neurologic disorder is an attractive possibility.


Conflict of interest statement

The authors declare no competing interests.

Figures

Fig. 1
Fig. 1. TIMMDC1 rare intronic variant c.597-1340A>G segregates in the family as a recessive allele.
a Family pedigree showing the consanguineous heterozygous (A/G) parents (II-1 and II-2), two affected homozygous (G) individuals (III-2 and III-6) and other unaffected heterozygous (A/G) or homozygous wild type (A) sibs. A slash symbol represents deceased individuals. b Segregation of TIMMDC1 c.597-1340A>G variant. Sanger sequencing chromatograms show the presence or absence of the TIMMDC1 variant in the family members. The TIMMDC1 c.597-1340A>G homozygous variant in affected individuals III-2 and III-6 is marked with a red circle.
Fig. 2
Fig. 2. TIMMDC1 intronic variant c.597-1340A>G inserts a poison exon between exons 5 and 6.
Schematic structure of the TIMMDC1 gene. Not to scale. Locations of the primers for generating data are presented in Figs. 6, 7 and poison exon between Exons 5 and 6 are shown.
Fig. 3
Fig. 3. Only TIMMDC1 gene is dysregulated in patient fibroblasts.
Expression of only TIMMDC1 gene that occurs within the previously mapped linkage interval is dysregulated (−2.7 Log2 fold) in patient fibroblasts compared with 107 control fibroblast cell lines analysed concurrently. Note that LeafCutter did not identify mis-splicing.
Fig. 4
Fig. 4. TIMMDC1 c.597-1340A>G variant acts as a splice enhancer.
Zoom in TIMMDC1 exon showing two cryptic splice acceptor sites (AGUU) 5′ to the variant. Sequence reads from the parents (II-1 and II-2) and affected children (III-2 and III-6) contain this variant suggesting it drives mis-splicing. SSO1 and SSO2 antisense oligonucleotide target sequences are included and marked with red and green bars, respectively.
Fig. 5
Fig. 5. TIMMDC1 c.597-1340A>G variant enhances alternative splicing across exons 5 and 6.
TIMMDC1 c.597-1340A>G variant-induced aberrant splicing across exons 5 and 6 inserts higher levels of a poison exon in the affected individuals (III-2 and III-6) than in both parents (II-1 and II-2) and that is almost absent in control mRNAs. Sashimi plots showing TIMMDC1 mRNA read density maps for parents (blue), two affected children (red) and an unrelated healthy control (grey). The new poison exon is shown in pink. Note number of mRNA reads are reduced in the homozygous patients (III-2 and III-6) and heterozygous parents (II-1 and II-2) compared to the unrelated healthy control.
Fig. 6
Fig. 6. TIMMDC1 c.597-1340A>G variant inserts an 80 bp poison exonic sequence between Exon 5 and 6 in TIMMDC1 mRNAs of the affected individuals.
a Agarose gel showing semi-quantitative RT-PCR amplicons from normally and alternatively spliced mRNAs from two affected (lanes 1 and 2), carrier parents (lanes 3 and 4) and an unrelated healthy control (lane 5) fibroblast RNAs. Minus RT reactions of the affected fibroblast RNAs (lanes 6 and 7) were also included. Left panel: Control PCR products from primers (P442/P443) located in Exon 3 and 4 showing amplification from the unaltered mRNA region, middle panel: PCR products from primers (P444/448) located in Exon 5 and 6 showing amplification of mRNAs with (lanes 1 and 2) and without (lanes 3–5) poison exon, and right panel: PCR products from primers (P446 located within poison exon and P448 within Exon 6) that specifically amplify mRNAs with poison exon sequence. Note that levels of mRNA with poison exon sequences in the affected individuals and parents (carrying the TIMMDC1 variant; lanes 1–4) are higher than the unrelated control (lane 5) that has low level of aberrant splicing that generates the mRNAs with poison exon sequences. See Fig. 2 for primer location. b Chromatograms showing mRNA sequences with an 80 bp poison exon in fibroblasts of the two affected individuals (see sequence of III-6*, III-2** and III-6•• bands from the gel in a). Parent II-2• band sequence, as expected, showed the absence of poison exon.
Fig. 7
Fig. 7. TIMMDC1 SSO1 and SSO2 antisense oligonucleotides restore normal splicing in the c.597-1340A>G affected fibroblasts.
Agarose gels showing semi-quantitative RT-PCR amplicons of normally and alternatively spliced mRNAs in the SSO1, SSO2 or non-specific control NC5 antisense oligonucleotides treated affected (III-6 and III-2; lanes 1–6) and untreated parent (II-1 and II-2) fibroblasts (lanes 7 and 8). Minus RT reactions of the affected fibroblast RNAs (lanes 9 and 10) are also shown. Left panel: Control PCR products from primers (P442/P443) located in Exon 3 and 4 showing amplification from the unaltered mRNA region. The gel showed increased levels of normal TIMMDC1 mRNA in SSO1 and SSO2 (lanes 1, 2 and 4, 5) compared to NC5 (lanes 3, 6) treated affected or untreated (lanes 7, 8) parent fibroblasts. Middle panel: PCR products from primers (P444/448) located in Exon 5 and 6 showing increased levels of normally spliced TIMMDC1 mRNA in SSO1 and SSO2 (lanes 1, 2 and 4, 5) compared to NC5 (lane 3, 6 with predominantly poison exon containing mRNA) treated affected or untreated (lanes 7 and 8 with predominantly normal mRNA) parent fibroblasts. Right panel: PCR products from primers (P446 located within poison exon and P448 within Exon 6) that specifically amplify mRNAs with poison exon sequence. Levels of poison exon containing mRNA is reduced in SSO1 and SSO2 treated (lanes 1, 2 and 4, 5) compared to NC5 (lanes 3 and 6) treated affected fibroblasts but comparable to untreated (lanes 7 and 8) parent fibroblasts.
Fig. 8
Fig. 8. TIMMDC1 protein levels are reduced in the affected LCLs and fibroblasts.
a Western blot showing moderate reduction in TIMMDC1 protein level in the affected male III-6 LCLs (lane 1) compared to the unaffected family members (lanes 2–7). b Western blot showing significant reduction in TIMMDC1 protein level in the affected male (III-6) and female (III-2) fibroblasts (lanes 1, 2) compared to the unaffected carrier parents (II-1 and II-2; lanes 3, 4) and unrelated healthy controls (lanes 5–7). Low levels of TIMMDC1 protein—that was undetectable in shorter exposure—were seen in—the affected (lanes 1, 2) compared to the two carrier-parent (lane 3, 4) fibroblasts. Note that as the parents are heterozygous for the c.597-1340A>G variant, the TIMMDC1 protein level is lower than the unrelated control fibroblasts without this variant. Housekeeping protein β-tubulin was used as a loading control.
Fig. 9
Fig. 9. TIMMDC1 protein levels are restored in SSO1 and SSO2 antisense oligonucleotide treated affected fibroblasts.
a Western blot showing significantly increased TIMMDC1 protein level in SSO1 and SSO2 treated affected (III-2 and III-6; lanes 1, 2 and 4, 5) compared to almost non-existent protein in the NC5 control treated (lanes 3, 6; very low-level signal was detectable after longer exposure) fibroblasts. Note that TIMMDC1 protein level was also increased in SSO1 and SSO2 treated parent (lanes 7, 8 and 10, 11) (heterozygous for the variant) compared to NC5 control (lanes 9 and 12) parent fibroblasts. However, as shown in b, no difference in the TIMMDC1 protein levels was observed in SSO1, SSO2 or NC5 control treated healthy unrelated individual’s fibroblasts (lanes 7, 8). Housekeeping protein β-tubulin was used as a loading control.
Fig. 10
Fig. 10. Mitochondrial complex I proteome is restored in SSO1 treated affected fibroblasts.
a Volcano plot expressing quantitative proteomics data showing a decreased abundance of TIMMDC1 and other complex I subunits in patient III-2 relative to healthy control (n = 5) whole fibroblasts. b Volcano plot showing increased abundance of TIMMDC1 and other complex I subunits in SSO1 relative to NC5 treated patient III-2 or c III-6 whole fibroblasts. Horizontal line within the volcano plots represents a significance of p = 0.05 and vertical lines represent a fold-change of ±1.5. Blue = complex I subunits.
Fig. 11
Fig. 11. Mitochondrial function is restored in SSO treated affected fibroblasts.
a Oxygen consumption rate (pmol/min) at baseline conditions and then after oligomycin, FCCP and rotenone/antimycin A injections. b Basal respiration, c ATP production, and d Maximal respiration were measured in SSO1, SSO2 or NC5 treated patient fibroblasts. Results are expressed as mean ± SEM. *p < 0.05; **p < 0.01 (two-tail Student’s t test).

References

    1. Bamshad MJ, Nickerson DA, Chong JX. Mendelian gene discovery: fast and furious with no end in sight. Am. J. Hum. Genet. 2019;105:448–455. - PMC - PubMed
    1. Gonorazky HD, et al. Expanding the boundaries of RNA sequencing as a diagnostic tool for rare Mendelian disease. Am. J. Hum. Genet. 2019;104:1007. - PMC - PubMed
    1. Fresard L, et al. Identification of rare-disease genes using blood transcriptome sequencing and large control cohorts. Nat. Med. 2019;25:911–919. - PMC - PubMed
    1. Kremer LS, et al. Genetic diagnosis of Mendelian disorders via RNA sequencing. Nat. Commun. 2017;8:15824. - PMC - PubMed
    1. Kumar R, et al. Homozygous mutation of STXBP5L explains an autosomal recessive infantile-onset neurodegenerative disorder. Hum. Mol. Genet. 2015;24:2000–2010. - PubMed